Baird, T. 2016. Surveillance Design Communities in Europe: A Network Analysis. Surveillance & Society 14
Theodore Baird
VU University Amsterdam, The Netherlands.
Abstract
Building on the concept of the ‘surveillance-industrial complex,’ I move from the ‘complex’ to the ‘community,’ situating a number of organizations within ‘surveillance design communities’ (SDCs). SDCs are networks of linked organizations which engage in researching, developing, producing, and circulating surveillance technologies. Empirically I draw from data on the organizations involved in border surveillance funded by the European Union’s FP7-Security programme. Based on the novel conceptualization of SDCs, coupled with an analysis of new network data, the article demonstrates that important contributions to the design of surveillance are distributed among a small core of central organizations surrounded by communities of actors assembled in overlapping hierarchies. Hence, SDCs are interwoven, multi-scalar networks rather than a total ‘complex’ or sites for the overlap of the ‘public’ and ‘private.’
Introduction
A number of scholars, journalists, and activists have argued that we may be witnessing the development of a ‘security-industrial complex’ in Europe which resembles the earlier ‘military-industrial complex’ of the Cold War (Hayes 2006; Guittet and Jeandesboz 2010). The security-industrial complex refers to the relations between military, security, academia, and industry within a global market for the design and implementation of security technologies. The main actors are governments, suppliers of security technologies, research organizations, and security forces demanding use of new technologies. The idea of a security-industrial complex has been extended by the concept of the surveillance-industrial complex, a notion proposed by Hayes (2012: 167) to refer to “the relationship between the private sector and the state in developing and implementing surveillance systems for law enforcement and security purposes.” Although the concepts of security-industrial and surveillance-industrial complex promise a critical and empirically grounded picture of the relations between public and private security actors, they have been criticized as oversimplifying a complex and diverse field which has a number of local manifestations, with a heterogeneity of actors involved in the funding, development, marketing, promotion, and use of technological systems of security and surveillance (Guittet and Jeandesboz 2010: 236).
In order to address these criticisms, I choose to focus on the research and development of surveillance technologies in Europe by accounting for the formation of what I call ‘surveillance design communities’ (SDCs), moving from the total ‘complex’ to the tangled ‘community’ in order to unravel the overlapping network structures involved in surveillance technology design. Surveillance design communities can be conceived of as networks “in which the practical and political steps needed to transform an information technology into a system for surveillance and control are inevitably embodied” (Hayes 2012: 167).
In this article I develop a network analytic conception of SDCs, allowing us to graph, visualize, and analyze them using standard network analytic techniques. I draw on empirical data collected from the European Union’s FP7-Security programme, focusing on projects funded to research and develop border surveillance technologies. The article begins with a theoretical section introducing surveillance design communities and their formation, followed by a methods section detailing the network analytic methods employed. I then use a number of techniques from network analysis to visualize and analyze the central organizations and communities which arise from the data. The article concludes with a discussion and suggestions for future research.
The Formation of Surveillance Design Communities
The growth of SDCs is rooted in multiple mutually constitutive processes. Two main processes are discussed here in relational to borders and frontiers, as the current analysis focuses on border surveillance. Additional explanations for SDCs in other domains (urban surveillance, cybersurveillance, etc.) are not covered here.
First, the politics of constructing borders, or ‘teichopolitics,’ in parallel with the transformation of the boundaries between internal/external security and public/private institutions, have expanded the space for new models of ‘border surveillance’ to form in Europe (Bigo 2001, 2006; Abrahamsen and Williams 2011; Rosiere and Jones 2012). ‘Border surveillance,’ as a manifestation of teichopolitics (deliberations over how to ‘improve’ territorial enclosures and boundaries) and the entangling of internal/external and public/private, becomes a socio-technical model for constructing new divisions of inside/outside, protecting national privileges, and gaining economic advantage for transnational elites (Rosiere and Jones 2012).
The de-centering of the national scale has rearranged relations among the organizations involved in border-making politics at multiple scales, recalibrating how ‘border surveillance’ is thought and practiced, and re-calibrating demand from the state for the involvement of new organizations in migration management (Guiraudon and Lahav 2000). The multi-scalar character of EU teichopolitics, the growing integration of internal/external security and public/private, has led to intensified surveillance of border spaces, through the erection of new high-tech boundaries around Europe such as the European Border Surveillance System (EUROSUR), and new demands for surveillance technologies which provide the material infrastructure for the new boundaries (The European Parliament and The Council of the European Union 2013).
‘capabilities,’ ‘integration,’ and ‘demonstration’ projects) ensure that (a) market competition is fostered by the state and competitive pressure is state-led, and (b) risk is shared between the state and market during the design and production of surveillance technologies in Europe.
Support for the new structures of market-state integration has come partly through FP7 programmes, and in this sense surveillance design communities deliberately arise through FP7-Security funding. Bigo et al. (2014: 8) confirm that overall FP7 security funding “has been overwhelmingly devoted to security and defence programmes of large transnational corporations, ministries of Interior and Defence and technical research institutions, with little funding for data protection, privacy and the respect of fundamental freedoms in security applications.” The variegation of teichopolitical models of border surveillance across multiple institutions and scales has led to a staggering growth of organizations (such as lobbyists, think-tanks, consultancies, etc.) which promote surveillance, as well as to the involvement of scholarly and legal ‘expertise’ in the design of surveillance technologies (Hayes 2012).
The actual structure of state-market forms, I will demonstrate, is embodied by surveillance design communities (SDCs) composed of heterogeneous actors operating at multiple hierarchical scales. This suggests that there is no single relation between state and market, but multiple relations linking actors together in tangled communities. By defining SDCs in a manner covalent with theories of network structure, we can hone in on particular components of the system and map the actors, their relations, and closely trace the outline of community structure.
Community, in the sense used in this article, is distinct from conceptions of ‘security communities,’ ‘epistemic communities,’ ‘international community,’ or even ‘system’ or ‘assemblage.’ ‘Community,’ in the network theoretic sense employed here, is an identifiable group of organizations who are linked through an identifiable pattern of relations arranged in a scalable social structure. ‘Design’ can be conceived as a social process where technological innovation occurs, and certain actors within the network space are (dis)empowered by their relations and positions within the social structure. Design involves the production and adaption of surveillance technologies, within a community social structure which can be mapped using network analytic methods.
Building on network theory, teichopolitics, and movement between market and state, a number of interrelated questions arise from the preceding discussion:
(1) Which are the main organizations involved in the design of border surveillance technologies in Europe? Where are they located? Do they form discernible ‘community’ structures which we can graph, visualize, and analyze?
(2) Do the relational structures of SDCs reflect the movement between state and market in the development of border surveillance technologies? What is the financial investment into SDCs?
In the following sections I provide answers to these questions by using theoretical elements from security studies, network analytic methods, and a collection of relevant primary and secondary sources.
Methods: Graphing, Visualizing, and Analyzing Surveillance Design Communities
Networks are complex structures which have common properties, including scale-free distributions, the formation of clusters and communities, and small-world properties (Strogatz 2001). Social networks are patterns of relations, composed of actors (synonymous with nodes or vertices depending on the
structures of actors in networks and how they vary, making it a suitable methodological tool for exploring SDCs.1
Network Analysis in Security Studies
Network analytic thinking conceives of social structures in relational terms: how patterns of social ties form across multiple scales, and what these relations mean for the distribution of power or resources. Relations, or ties, between actors are the unit of analysis rather than the categories or attributes of the actors themselves. Actors are constituted by the patterns of relations which form with others (Emirbayer 1997; Emirbayer and Goodwin 1994). Relational thinking allows us to understand complex heterogeneous linkages within and across social scales, so that social patterns and configurations at one scale can be understood in relation to other scales in which they are embedded. For example, “[s]uch links become central to current security issues, such as the techno-scientific assemblage of the military-industrial complex” (Soreanu and Simionca 2013: 183).
Furthermore, network analysis can be “applied in a non-positivist fashion” (Buch-Hansen 2013: 1), supporting work in critical security studies which analyzes the relations between actors and their changing positions. Rather than defining a set of hypotheses and testing them, social network analysis can be used as a ‘design tool’ to raise questions about security and surveillance (Weber and Lacy 2010), a creative way of coupling available computer technologies to critiques of surveillance technologies and SDCs. Network analytic methods spring from technological innovation within the fields of network and data science, and the resourceful researcher can utilize these innovations and harness their power in the pursuit of critical rethinking of security and surveillance. Such an approach provides a suitable companion to researchers working across disciplines and provides opportunities for researchers aiming for ‘messy truths’ and ‘political effects’ through their methods (Aradau and Huysmans 2014).
Relational accounts of surveillance communities which analyze the patterns of ties that form between actors at multiple scales, how these patterns evolve, and what impacts they have on the politics and practice of (in)security and surveillance, represent powerful tools for deriving new empirical, theoretical, and methodological insights. This article complements previous work by outlining a network analytic approach to the surveillance-industrial complex, allowing us to map the complex heterogeneous linkages between actors. However, due to data limitations and space concerns, an extended discussion of the formation and the effects of SDCs is not possible (see ‘Formation’ above and Discussion below), and the analysis focuses on network structure.
1 and 2-mode Network Analysis
Most network analysis focuses on links between one type of actor—people to people, firms to firms, or states to states—known as 1-mode networks because they consist of ties connecting like to like. In order to take into account multiple scales and structures, networks can be constructed where links form between distinct types which differ—people to firms, people to events, firms to owners, and so forth—known as mode networks (alternatively ‘affiliation’ or ‘bipartite’ networks) (Borgatti and Halgin 2011). In the 2-mode network graphed in this article, links form between organizations and FP7-Security projects. For example, if organization a participates in project z, then a link between the organization and the project is formed.
Analyzing 2-mode networks requires sensitivity to the bipartite structure of the graph, as measures used for 1-mode networks require some modification to be used on a 2-mode graph (Borgatti and Everett 1997; Vernet, Kilduff, and Salter 2014; Everett and Borgatti 2013; Latapy, Magnien, and Vecchio 2008).
1 For standard accounts of social network analysis and theory, see Wasserman and Faust (1994), Knoke and Yang
Typically, 2-mode graphs are projected into two separate 1-mode graphs with weighted links, which allows for the use of standard graph analytic techniques, although in projecting 2-mode graphs into 1-mode graphs information may be lost. However, combining insights from analyzing the 2-1-mode graph in correspondence with its two 1-mode projections allows us to recover the loss of information and present a rich and detailed analysis of the patterns of relations at multiple structural levels (Everett and Borgatti 2013). In the current analysis, the 2-mode network is projected into two 1-mode networks: a project network and an organizational network, both weighted (non-normalized) based on the frequency of co-participation in projects (Borgatti and Halgin 2011). The analysis will focus on three networks—a 2-mode network of organizations and projects, a projected mode network of only projects, and a projected 1-mode network of only organizations—in order to reveal the complex multi-scalar communities involved in researching and developing surveillance technologies in Europe.
Finally, the advantage of FP7 network data is that they are available publically online. Data on nodes and their connections was compiled using public sources freely available online via the EU Commission, FP7 project websites, and secondary academic sources. FP7 project websites detail all the partners of a particular project. Only project ‘partners,’ not ‘end users’ (primarily composed of governments), were included as nodes. Each project partner was selected as a node, and each partner of a project was connected to their respective project node. Where some nodes were partners of multiple projects, their connections spanned between them. Node attributes were collected from the organizations’ websites and secondary academic sources.
Centralities
Power hierarchies in networks are captured by measures of centrality. Measures of degree centrality, eigenvector centrality, closeness, and betweenness reveal the distribution of power within networks, providing insight into who the main actors are and what logics of border surveillance design are more privileged than others. Centrality scores are derived from the positions of actors within the network structure, revealing distinct positions. More central actors are those which are thought to have unequal influence over network formation and network outcomes. The centrality scores are discussed in the Data and Results section.
Degree centrality is simply a node’s total number of connections to other nodes. The more connections a node has, the more ‘central’ the node, and the more central the node the more power, influence, or resources that node is expected to have. Graphs tend to have a few nodes with very high degrees and many nodes with low degrees, following a power-law or exponential distribution (Clauset, Shalizi, and Newman 2009). However, degree centrality is a weak measure because it does not bring the structure of the entire graph into the frame, but only the degree of a particular node. Closeness centrality measures how ‘close’ a node is to all the other nodes, based on network geodesics (shortest paths among the nodes). Closeness centrality measures the reciprocal of the distance between all the nodes in the graph. The closer a node is to every other node, the higher its closeness centrality. Betweenness centrality is also based on geodesics (shortest paths). Betweenness centrality measures the degree to which a node is advantageously placed to deliver information or resources ‘between’ other nodes. Nodes which have higher betweenness are better situated to allow information or resources to flow through them. Finally, eigenvector centrality builds on degree centrality, and measures the centrality of a node depending on the centralities of other nodes in its neighborhood. A node with high eigenvector centrality is more central if it is connected to other central nodes. It measures degree centrality, but weights the node by the degree centrality of the nodes connected to it, which are weighted by the nodes connected to them, and so on. The largest values are gained by nodes in high-density cliques (where every node is connected to every other node).
Community Detection
network (Radicchi et al. 2004). Communities can be thought of as ‘modular’ in that they are modules of the larger network. The community detection problem is common in network analysis, and a number of different algorithms and techniques have been devised to detect communities in large 1-mode and 2-mode networks (Clauset, Newman, and Moore 2004; Girvan and Newman 2002; Newman and Girvan 2004; Palla et al. 2005). It is a question of how to split a network graph (which in this case represents a group of related and interacting organizations) into sub-graphs (communities). Sub-graphs should be modular, meaning that the nodes belonging to that sub-graph interact more with each other than with nodes outside the sub-graph, in the rest of the network. The problem arose in the study of social structure, social systems, and cohesion, and is related to the methodological issue of clustering in data mining. In applied research or research in critical security studies, community detection can assist in decomposing large networks into sub-networks, revealing important actors, their overlapping relations, and centralities. With regard to SDCs, community detection methods are crucial. Looking only at the formal FP7 projects, we only gain sight of what is visible based on project ties. Community detection can reveal unseen relationships between projects and among organizations. Raw numbers of affiliation in multiple projects only reveal the frequency of co-participation but do not say much about the unseen communities that form in-between projects: only community detection methods allow us to hone in on the multiple, overlapping, and hierarchical character of surveillance design communities. In other words, an analysis of FP7 projects alone provides opportunities for understanding how surveillance is designed within projects, but detecting overlapping communities allows us to see how design flows between and among projects at multiple scales. In this way we are able to trace the ‘logics’ behind the relational structure of the network revealed by graphing SDCs.
In the analysis of SDCs here, the link communities algorithm is used (Ahn, Bagrow, and Lehmann 2010). Link communities are an alternative community detection measure which detects communities based not on the position of actors within the network, but on the links between actors. Whereas hierarchical clustering and the fast-unfolding algorithms focus on actors as members of the community, the link communities algorithm focuses on links as members of a community (Ahn, Bagrow, and Lehmann 2010). In the context of FP7 projects, analyzing linkages rather than nodes makes sense: we are interested in the relations between organizations and the content of these relations, and detecting the complex patterns of relations can reveal underlying community dynamics relevant for addressing the research questions. Resources, knowledge, and techniques about the design of surveillance are expected to flow through the links, and understanding the communities that form because of these linkages can reveal the complex ways in which SDCs transfer socio-technical models of border surveillance and market logics of research design through their organizational structures. Visualization and analysis of these communities is carried out on the 1-mode organizations graph using the link communities algorithm in R (Kalinka and Tomancak 2011; Ahn, Bagrow, and Lehmann 2010). There are two visualizations presented: a dendrogram showing the number and distribution of communities, and a community membership plot showing the organizations which belong to multiple communities, which accompanies a table showing the most central organizations within the communities.
Data and Results
airplanes and small boats. During the exercise airplanes, boats, radars, maritime sensors, unmanned-aerial vehicles, and integrated information sharing were ‘synced’ in real-time to gather, analyze, and respond to cross-border movement from Africa towards Europe. Attendees included members of the Spanish Ministry of Interior, the Directorate General for Enterprise and Industry of the European Commission, Directorate General for Home Affairs, research officers from FRONTEX, and a spokesperson for Indra Sistemas, the private firm coordinating the project, among others.
PERSEUS is a large ‘demonstration’ project designed to test and validate the feasibility of carrying out large-scale maritime surveillance in the Mediterranean Sea (http://www.perseus-fp7.eu/). PERSEUS is unique—as a mirror of EUROSUR it utilizes a network architecture arising from a culmination of research projects developing technology and data systems for surveilling the European maritime border. It involves 29 partners from 12 European countries. The participating organizations are of diverse types: PERSEUS involves multinational private firms with multiple branches, domestic private firms specializing in specific technologies, information systems specialists, and non-governmental organizations assisting with training, legal issues, and procurement. The users of PERSEUS are primarily EU Member State governments: ministries of interior and defense, coast guards, border police, air forces, as well as port authorities. The ultimate goals of PERSEUS are a “higher level of automation in the generation of the CSPs [Common Situational Pictures] at national, regional and European levels,” “higher integration of all assets at trans-national level,” and “continuous surveillance coverage” (PERSEUS 2011: 42). The project was funded by the European Commission’s Framework 7 Security programme (FP7-SEC-2010-1) for €43.7 million (€27.9 million from the Commission and €15.8 million from PERSEUS partners). Thus, PERSEUS is an important example of how relations between political (state) and economic (market) ‘elites’ are re-calibrated in new transnational networks of power (Kauppi and Madsen 2013).
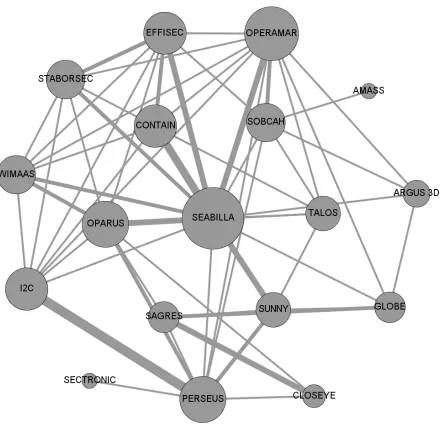
FP7 lasted for seven years, between 2007-2013, with a total budget of €50 billion. The European Security Research Programme, a subset of FP7 funding, totaled €1.4 billion (Bigo et al. 2014: 6). PERSEUS, however, is only the largest project funded by FP7 for developing border surveillance technologies: there are at least 17 more FP7-funded research projects assisting the implementation of EUROSUR (see the Appendix for the full list of projects included, and Figure 1 for the projected 1-mode network of projects). Each research and development project is led by a major transnational firm in Europe, many of which are subsidiaries or directly affiliated with larger global defense firms. The coordinator sits at the center of (un)equal power relations driving the logics of research: these organizations may attempt to impose particular conceptions of how to conceive of the design of surveillance technologies and what these technologies are supposed to do. In order to understand the power dynamics involved, we turn to measures of network centrality to chart who the most central actors are in the networks before turning to the communities which they form.
Centralities
Figure 1. Visualization of 1-mode FP7 Project Network. Note: Projects are linked by co-affiliated organizations. Nodes are sized by degree. Edges are sized by the number of co-affiliates between projects. Thicker edges indicate more co-affiliates. Centralities are non-normalized.
Degree Centrality (Normalized)
Closeness Centrality (Normalized)
Betweenness Centrality (Normalized)
Total Value of Projects (in Millions of Euro)
Project Value Project Value Project Value Project Value
SEABILLA 0.13 SEABILLA 0.35 PERSEUS 0.32 PERSEUS 43.7
PERSEUS 0.12 OPERAMAR 0.32 SEABILLA 0.29 TALOS 19.5
CONTAIN 0.09 PERSEUS 0.32 SOBCAH 0.21 EFFISEC 16.1
I2C 0.09 SOBCAH 0.29 SUNNY 0.15 I2C 16.0
SUNNY 0.09 OPARUS 0.29 I2C 0.14 SEABILLA 15.6
Table 1: Top five node centralities of projects in the 2-mode network, including the top highly valued projects. Note: Centralities are normalized and scaled based on UCINET’s 2-mode centrality function (Borgatti and Everett 1997). Scores are rounded to the nearest hundredths. Similarities are due to rounding.
Degree Centrality
(Normalized) Eigenvector Centrality (Normalized) Closeness Centrality (Normalized) Betweenness Centrality (Normalized)
Organization Value Organization Value Organization Value Organization Value
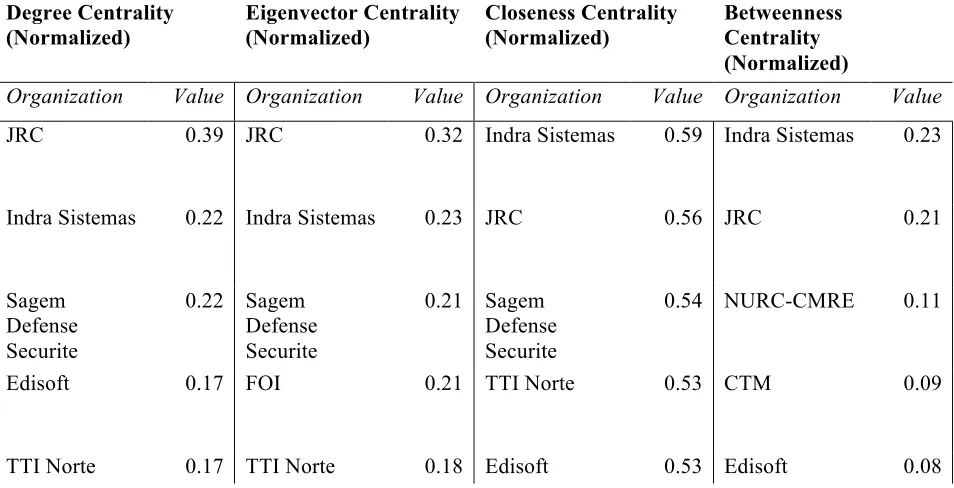
JRC 0.39 JRC 0.32 Indra Sistemas 0.59 Indra Sistemas 0.23
Indra Sistemas 0.22 Indra Sistemas 0.23 JRC 0.56 JRC 0.21
Sagem Defense Securite
0.22 Sagem Defense Securite
0.21 Sagem Defense Securite
0.54 NURC-CMRE 0.11
Edisoft 0.17 FOI 0.21 TTI Norte 0.53 CTM 0.09
TTI Norte 0.17 TTI Norte 0.18 Edisoft 0.53 Edisoft 0.08
Table 2: Top five node centralities of organizations in the 2-mode network. Note: Centralities are normalized and scaled based on UCINET’s 2-mode centrality function (Borgatti and Everett 1997). Scores are rounded to the nearest hundredths. Similarities are due to rounding. JRC= Joint Research Centre (JRC) of the EU Commission; FOI= Swedish Defense Research Agency (FOI); NURC=NATO Undersea Research Center (Center for Maritime Research and Experimentation (CMRE)); CTM= Centrum Techniki Morskiej (CTM). In addition to the JRC of the EU Commission, predominantly Spanish (Indra and TTI Norte), Portuguese (Edisoft), and French (Sagem) private firms maintain high values across the measures.
arranging competitive applications, bidding, and tendering processes through application for funding, defining the criteria for membership in projects, deciding on the distribution of funding, and encouraging the participation of the private sector are each crucial components of the Commission’s activities in spearheading the practice of designing surveillance technologies. Matters related to the design process— establishing standards, ‘harmonizing’ decision-making, promoting the transfer of knowledge and practice within the network, facilitating partnerships among diverse organizations (linking universities to the private sector for example), or acting as broker between national ministries—are handled by the JRC, partially explaining its strong central position across all scores.
Beyond the JRC, the most central actors of the network are private firms and applied research organizations either involved in (a) the research, development, design, and manufacture of experimental technologies in the field of surveillance, (b) information technologies (IT), or (c) aerospace and defense agencies. The most central organizations roughly correspond to two of the three “universes of EU border control” identified by Bigo (2014): the military-strategic field (military/navy) and the global cyber-surveillance social universe (database analysts). The internal security field (border guards/police) is involved as well, but such organizations do not occupy central positions in SDCs as graphed here, but nevertheless are crucial players as implementing organizations (‘end-users’).
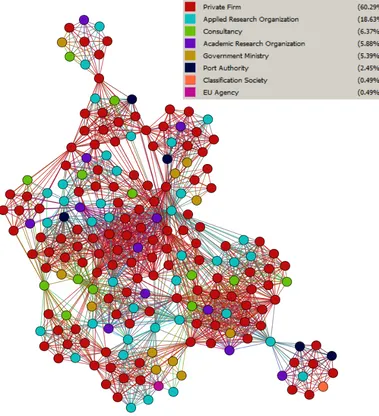
Figure 2: Visualization of 1-mode organizational network. Note: Colors indicate organizational type (see legend). The graph indicates the preponderance of private firms, applied research organizations, and consultancies in the network. It is also clear from the visualization that how organizations are tightly clustered, roughly corresponding to the outline of FP7 projects. The EU Agency is the Joint Research Centre of the EU Commission. The graph was visualized in Gephi 0.8.2 beta.
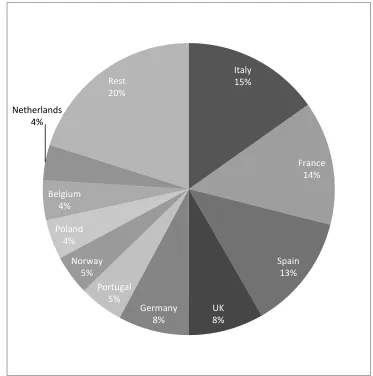
A number of non-EU organizations are involved in SDCs, primarily located in Turkey (Aselsan, STM), Israel (Israel Aerospace Industries, Correlation Systems), and the United States of America (Boeing). ‘European border surveillance’ could be thought of as a misnomer—the design of maritime surveillance technologies for use with EUROSUR occurs in globally distributed transnational networks. The major centers of design are predominantly located in Europe, but a number of important destinations also form core locales for the transference of design knowledge through transnational design communities. Europe is not only exporting the border into extraterritorial spaces, as much scholarship has aptly demonstrated, but is also importing logics, rationales, practices, and technologies of border surveillance from outside Europe in order to surveil its border territories.
Figure 3: Geographical Locations of Organizational Headquarters. Note: ‘Rest,’ ranked by percentage, includes Finland, Greece, Sweden, Ireland, Romania, Malta, Turkey, Switzerland, Israel, Luxembourg, Hungary, Czech Republic, USA, Austria, Slovenia, Denmark, Cyprus, Estonia (non-EU in italics). Note that the top countries for R&D investment in Europe by rank, according to the Commission, are: Germany, France, UK, Netherlands, Sweden, Italy, Finland, and Spain (see the ‘EU R&D Scoreboard 2014,’ available online at: https://ec.europa.eu/jrc/sites/default/files/eu-rd-scoreboard-2014-infographic_en.pdf).
Communities
In this section, the visualization and analysis of these communities is carried out on the 1-mode organizations graph using the link communities algorithm in R (Kalinka and Tomancak 2011; Ahn, Bagrow, and Lehmann 2010).
Italy 15%
France 14%
Spain 13%
UK 8% Germany
8% Portugal
5% Norway
5% Poland
4% Belgium
4% Netherlands
4%
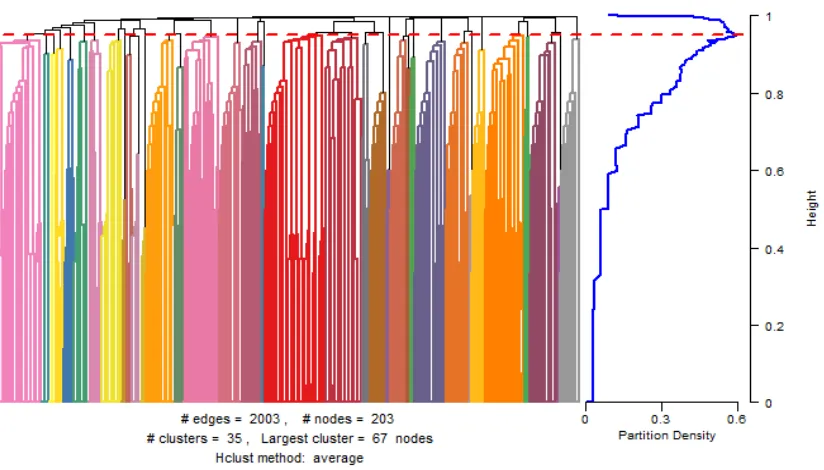
Figure 4 represents SDCs in a dendrogram, which visualizes the number and overlapping character of communities, displaying a dense concentration of 35 overlapping communities of varying size (far more than the 18 formal FP7 projects). The link communities algorithm is able to detect complexity at multiple scales, represented by the multiple partitions of the dendrogram. The dendrogram is cut at the optimal partition in order to visualize the most relevant communities, based on link density within communities, although other meaningful communities can be revealed by cutting above or below the optimal partition (Ahn, Bagrow, and Lehmann 2010). The 35 detected communities are unified, overlapping, multi-scalar organizational formations, revealing the complex power hierarchies within and between surveillance design communities, and highlighting the difficulties in untangling the positions, relations, and centralities of major organizations within SDCs. The link communities dendrogram visualizes the overlapping hierarchical structure which undergirds the inter-organizational diffusion of socio-technical models of border surveillance and models for the design and development of surveillance technologies in Europe.
Figure 4. Visualization of Surveillance Design Communities in a link community dendrogram. Note: Colored ‘clusters’ represent communities. Visualization was done using the linkcomm package in R
(Kalinka and Tomancak 2011).
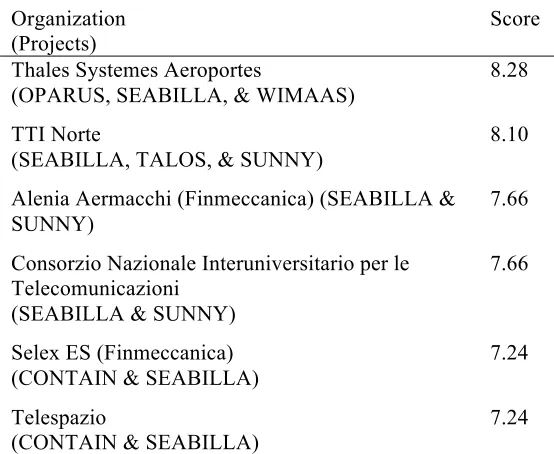
Figure 5: Community Membership Plot. This matrix visualizes the organizations which belong to more than one community. Only the top 10 organizations are visualized. The right vertical axis labels the organizations, the left vertical axis the number of communities each organization belongs, the top horizontal axis shows the community number corresponding to the dendrogram, and the bottom horizontal axis shows the number of organizations in a community. CNIT= Consorzio Nazionale Interuniversitario per le Telecomunicazioni; TNO= Nederlandse Organisatie Voor Toegepast Natuurwetenschappelijk Onderzoek (The Netherlands Organization for Applied Scientific Research). Note that not every community is represented, only those with the most ‘overlap.’ Visualization was completed with the linkcomm package in R (Kalinka and Tomancak 2011).
Organization (Projects)
Score Thales Systemes Aeroportes
(OPARUS, SEABILLA, & WIMAAS)
8.28
TTI Norte
(SEABILLA, TALOS, & SUNNY)
8.10
Alenia Aermacchi (Finmeccanica) (SEABILLA & SUNNY)
7.66
Consorzio Nazionale Interuniversitario per le Telecomunicazioni
(SEABILLA & SUNNY)
7.66
Selex ES (Finmeccanica) (CONTAIN & SEABILLA)
7.24
Telespazio
(CONTAIN & SEABILLA)
7.24
Participation in multiple SDCs is further represented in Figure 5, whereby the most active organizations are revealed. Again, predominantly private firms and applied research organizations involved in aerospace and maritime defense are represented, underscoring the complex power hierarchies which arise among SDCs. Finmeccanica, one of the largest defense producers in the world, is represented in multiple communities. Other large defense companies like Boeing (USA), BAE Systems (UK), EADS (trans-European, now Airbus Group), participate in multiple surveillance design communities, but are not the most central.
It is striking to note that many of the most central organizations also participate in multiple communities, suggesting that primarily large multinational firms and applied research organizations knit together SDCs through their overlapping ties. The centrality of private firms has important implications for the formation of SDCs and the important design and policy resources which flow within and between them.
Hence, in extension of theories which outline a division and/or overlap between the ‘public’ and ‘private,’ or theories of the ‘security-industrial complex,’ SDCs are associated with tangled overlapping hierarchies, vertical and horizontal power networks, and tangled relations which form communities. There are multiple entry points into the community: through powerful central actors, or through peripheral actors, or through actors who are neither central nor peripheral, but inhabit multiple communities at once. The division of design tasks is linked not only to powerful central actors, but to diffuse communities. The SDCs give space to resource exchange, rationalities of design, and process work-flows that lead to technological innovation. Hence, SDCs are interwoven overlapping networks rather than simply a total ‘complex’ or sites for the overlap of the ‘public’ and ‘private.’
Discussion
Due to the limited empirical basis of the article (all data come from network ties) it is difficult to draw further conclusions regarding SDCs beyond the network data. A number of critical comments and hypotheses can be made, however.
First, further data on the growth of SDCs can enhance our understanding of how SDCs arise in particular contexts. Beyond the limited literature review provided in the current article, a much more robust collection and analysis of data on the growth of SDCs is in order. Qualitative and comparative historical data from within and beyond Europe can aid in this endeavor.
Second, the data do not reveal the actual impacts and outcomes of SDCs. SDCs may be important vehicles for impacting how and why frontiers are surveilled, but the data in this article do not reveal the impact of SDCs, only their social structure. For example, it is unclear if the technologies designed within PERSEUS (or within SDCs in general) have been implemented beyond the demonstration, as the limited web data available are not conclusive. It is plausible that the money spent within SDCs has few other deliverables than large-scale demonstration projects, and we must question the level of ‘pork’ found in SDCs (i.e. using R&D funding to support organizations which are important for supporting loyal political constituencies) (Lakoff and Klinenberg 2010). In other words, we should remain critical to decisions over the allocation of funding to SDCs and scrutinize their impact.
design, production, and spread of new surveillance technologies through specific networks, industry may also influence the negotiation of policies related to the newly designed technologies, as evidenced by the central role played by the JRC of the Commission, a major conduit through which policy information is expected to flow in multiple directions and across multiple scales. Future work could elucidate the complex ways in which the interests of the surveillance industry are served over the interests of other organizations both within and without the network.
Finally, the central involvement of public security organizations (both national and supranational), public and applied research organizations, and large-scale defense and security firms means that state-led models of border surveillance are coupled with market logics of investment and research design, potentially leading to models of border surveillance which conform not to the demands of citizens or civil society, but to the logics, practices, and knowledges of specific surveillance design communities involved in the research and development of surveillance technologies. In other words, it is plausible that the EU, national governments, research, and private industry work together as strategic partners in researching, designing, and marketing border surveillance at the expense of alternative organizations from civil society. Since many FP7 projects have embedded ethical working groups where surveillance scholars participate, it would be enlightening to see how surveillance scholars may impact the growth and impact of SDCs. Further work could probe the main organizations which benefit from the growth and impact of SDCs, and how shifts in the composition of SDCs occur over time may impact democratic oversight and accountability over the technologies produced with SDCs, as the design phase of surveillance technologies has emerged as an ethical and political concern for Europe.
Conclusion
The data show that the main organizations involved in SDCs are distributed among a small core of central organizations surrounded by communities of actors participating within various FP7 research projects. Rather than being decentralized or de-linked along a diffuse chain of actors, SDCs contain highly centralized organizations which are simultaneously members of multiple overlapping hierarchies which cohere in communities. Here we see SDCs not as simply decentralized sites where states outsource control to private actors, but as overlapping communities composed of hierarchical relations spanning multiple scales. SDCs exemplify the teichopolitical strategies and projects of the EU and its networked structures of border surveillance.
In response to the weaknesses of the conception of the security-industrial complex, I suggest that critical network analysis, when located within a network theoretic framework sensitive to teichopolitics and state-market maneuvers, is useful in refining conceptions of the security-industrial complex and in analyzing the community structures and networks of surveillance technology design. In this context, however, the current analysis is limited for the following reasons, and could be supported by further research: (a) data are limited and focused on FP7 projects, (b) the network analysis provides only a static snapshot of a network which is in constant transformation, (c) the focus on border surveillance is narrow, and other domains of surveillance could be well analyzed in comparison, and (d) the organizational and project levels only capture dynamics at particular scales, obscuring social dynamics at alternative scales. Further work can address these limitations by taking into considerations the points of discussion in the section above, as well as (a) looking beyond FP7 projects for the formation of SDCs, (b) focusing on longitudinal change of SDCs, depending on the availability of data, (c) widening the scope to graph and analyze other SDCs as well as other geographical regions beyond Europe, and (d) produce new network data on the actors involved or compliment network analyses with ethnographic and qualitative portraits of relations at the micro- and meso-scales.
concentrated among a handful of central organizations participating in a small number of design communities that the average citizen does not notice. For this reason it is important to continue to methodically map the social relations of SDCs in other contexts in order to shed light on the structural complexity of surveillance in Europe. Applied work which addresses the ways in which SDCs can be made more accountable, democratic, and organizationally diverse is welcome.
Acknowledgments
Special thanks to Francesco Ragazzi and Thomas Spijkerboer for comments on an earlier version. A draft was presented at the Second Crimmigration Control Conference: The Borders of Crimmigration, held by the Crimmigration Control International Net of Studies (CINETS), 9-10 October 2014, Leiden, the Netherlands and the Council for European Studies’ 22nd International Conference of Europeanists, 8-10 July 2015, Paris, France. Research for this article was conducted as part of the project ‘Border Policies and Sovereignty: Human Rights and the Right to Life of Irregular Migrants,’ supported by Dutch NWO Vici grant number 016.130.061.
References
Abrahamsen, Rita, and Michael C. Williams. 2011. Security Beyond the State: Private Security in International Politics. Cambridge: Cambridge University Press.
Ahn, Yong-Yeol, James P. Bagrow, and Sune Lehmann. 2010. “Link communities reveal multiscale complexity in networks.”
Nature 466 (7307):761-764. DOI: 10.1038/nature09182.
Aradau, Claudia, and Jef Huysmans. 2014. “Critical methods in International Relations: The politics of techniques, devices and acts.” European Journal of International Relations 20 (3):596-619. DOI: 10.1177/1354066112474479.
Bechtel, Michael M., and Gerald Schneider. 2010. “Eliciting Substance from 'Hot Air': Financial Market Responses to EU Summit Decisions on European Defense.” International Organization 64 (2):199-223. DOI: 10.1017/S0020818310000019.
Bigo, Didier. 2001. “The Möbius Ribbon of Internal and External Security(ies).” In Identities, Borders, Orders: Rethinking International Relations Theory, edited by M. Albert, D. Jacobsen and Y. Lapid. Minneapolis, MN: University of Minnesota Press.
Bigo, Didier. 2006. “Internal and External Aspects of Security.” European Security 15 (4):385-404.
Bigo, Didier. 2014. “The (in)securitization practices of the three universes of EU border control: Military/Navy - border guards/police - database analysts.” Security Dialogue 45 (3):209-225. DOI: 10.1177/0967010614530459.
Bigo, Didier, Julien Jeandesboz, Mederic Martin-Maze, and Francesco Ragazzi. 2014. “Review of Security Measures in the 7th Research Framework Programme FP7 2007-2013.” Committee On Civil Liberties, Justice And Home Affairs (LIBE)
Directorate General For Internal Policies, Policy Department C: Citizens' Rights and Constitutional Affairs, Civil Liberties, Justice And Home Affairs (PE 509.979).
Borgatti, Stephen P., and Martin G. Everett. 1997. “Network analysis of 2-mode data.” Social Networks 19 (3):243-269.
Borgatti, Stephen P., and Daniel S. Halgin. 2011. “Analyzing Affiliation Networks.” In The SAGE Handbook of Social Network Analysis, edited by John Scott and Peter J. Carrington. SAGE Publications.
Buch-Hansen, Hubert. 2013. “Social Network Analysis and Critical Realism.” Journal for the Theory of Social Behaviour
Earlyview. DOI: 10.1111/jtsb.12044.
Clauset, Aaron, Mark E. J. Newman, and Cristopher Moore. 2004. “Finding community structure in very large networks.”
Physical review E 70 (6):026132.
Clauset, Aaron, Cosma Rohilla Shalizi, and Mark E. J. Newman. 2009. “Power-law distributions in empirical data.” SIAM Review
51 (4):661-703.
Emirbayer, Mustafa. 1997. “Manifesto for a relational sociology.” American Journal of Sociology 103 (2):281-317. DOI: 10.1086/231209.
Emirbayer, Mustafa, and Jeff Goodwin. 1994. “Network Analysis, Culture, and the Problem of Agency.” American Journal of Sociology 99 (6):1411-1454. DOI: 10.1086/230450.
Everett, Martin G., and Stephen P. Borgatti. 2013. “The dual-projection approach for two-mode networks.” Social Networks 35 (2):204-210.
Girvan, Michelle, and Mark E. J. Newman. 2002. “Community structure in social and biological networks.” Proceedings of the National Academy of Sciences of the United States of America (PNAS) 99 (12):7821-7826.
Guardia Civil. 2013. PERSEUS Demonstration Event: Agenda. Madrid, Spain, 24 September 2013: Guardia Civil.
Guiraudon, Virginie, and Gallya Lahav. 2000. “A Reappraisal of the State Sovereignty Debate: The Case of Migration Control.”
Comparative Political Studies 33:163-194.
Guittet, Emmanuel-Pierre, and Julien Jeandesboz. 2010. “Security Technologies.” In The Routledge Handbook of New Security Studies, edited by J. Peter Burgess. London and New York: Routledge.
Hayes, Ben. 2006. Arming Big Brother: The EU's Security Research Programme. Amsterdam, April 2006: Transnational Institute (TNI).
Hayes, Ben, and Vermeulen, Mathias. 2012. Borderline: EU Border Surveillance Initiatives - An Assessment of the Costs and Its Impact on Fundamental Rights. Berlin, May 2012: Heinrich-Böll-Stiftung.
Kalinka, Alex T., and Pavel Tomancak. 2011. “linkcomm: an R package for the generation, visualization, and analysis of link communities in networks of arbitrary size and type.” Bioinformatics 27 (14):2011-2012.
Kauppi, Niilo, and Mikael Rask Madsen, eds. 2013. Transnational Power Elites: The new professionals of governance, law and security. Abingdon, England: Routledge.
Knoke, David, and Song Yang. 2008. Social Network Analysis, Second Edition, Quantitative Applications in the Social Sciences: SAGE Publications.
Krahmann, Elke 2008. “Security: Collective good or commodity?” European Journal of International Relations 14 (3):379-404. DOI: 10.1177/1354066108092304.
Lakoff, Andrew, and Eric Klinenberg. 2010. “Of risk and pork: urban security and the politics of objectivity.” Theory and Society
39 (5): 503-525.
Latapy, Matthieu, Clemence Magnien, and Nathalie Del Vecchio. 2008. “Basic notions for the analysis of large two-mode networks.” Social Networks 30 (1):31-48.
Newman, Mark E. J., and Michelle Girvan. 2004. “Finding and evaluating community structure in networks.” Physical Review E
69 (2). DOI: 10.1103/PhysRevE.69.026113.
Palla, Gergely, Imre Derenyi, Illes Farkas, and Tamas Vicsek. 2005. “Uncovering the overlapping community structure of complex networks in nature and society.” Nature 435. DOI:10.1038/nature03607.
PERSEUS. 2011. Protection of European Seas and bordersthrough the intelligent use of surveillance. PERSEUS. Available online at: http://www.perseus-fp7.eu/wp-content/uploads/2011/06/2011_PERSEUS_Overview_v2.6.pdf.
Radicchi, Filippo, Claudio Castellano, Federico Cecconi, Vittorio Loreto, and Domenico Parisi. 2004. “Defining and identifying communities in networks.” Proceedings of the National Academy of Sciences of the United States of America (PNAS)
101 (9):2658-2663. DOI: 10.1073/pnas.0400054101.
Rosiere, Stephane, and Reece Jones. 2012. “Teichopolitics: Re-considering Globalisation Through the Role of Walls and Fences.”
Geopolitics 17 (1):217-234. DOI: 10.1080/14650045.2011.574653.
Salieri, Paolo. 2014. “EU R&D related to (Maritime (Border)) Security. PERSEUS: its “flagship” project.” European Commission
Piraeus (15 October 2014): Available online at: http://www.perseus-fp7.eu/wp-content/uploads/2014/10/SALIERI-15-October-2014-PERSEUS-Piraeus-New.pdf.
Scott, John, and Peter J. Carrington, eds. 2011. The SAGE Handbook of Social Network Analysis: SAGE Publications.
Soreanu, Raluca, and Anca Simionca. 2013. “Social network analysis.” In Critical Approaches to Security: An introduction to theories and methods, edited by Laura J. Shepherd, 181-195. London and New York: Routledge.
Strogatz, Steven H. 2001. “Exploring complex networks.” Nature 410:268-276. DOI:10.1038/35065725.
The European Council. 2010. “The Stockholm Programme - An Open and Secure Europe Serving And Protecting Citizens.”
Offical Journal of the European Union 2010/C 115/01.
The European Parliament, and The Council of the European Union. 2013. “REGULATION (EU) No 1052/2013 OF THE EUROPEAN PARLIAMENT AND OF THE COUNCIL of 22 October 2013 establishing the European Border Surveillance System (Eurosur).” Official Journal of the European Union L 295/11.
Vernet, Antoine, Martin Kilduff, and Ammon Salter. 2014. “The Two-Pipe Problem: Analysing and Theorizing about 2-Mode Networks.” In Contemporary Perspectives on Organizational Social Networks, edited by Daniel J. Brass, Giuseppe Labianca, Ajay Mehra, Daniel S. Halgin and Stephen P. Borgatti, 337 - 354. Bingley, United Kingdom: Emerald Group Publishing Limited.
Wasserman, Stanley, and Katherine Faust. 1994. Social Network Analysis: Methods and Applications, Structural Analysis in the Social Sciences. Cambridge: Cambridge University Press.
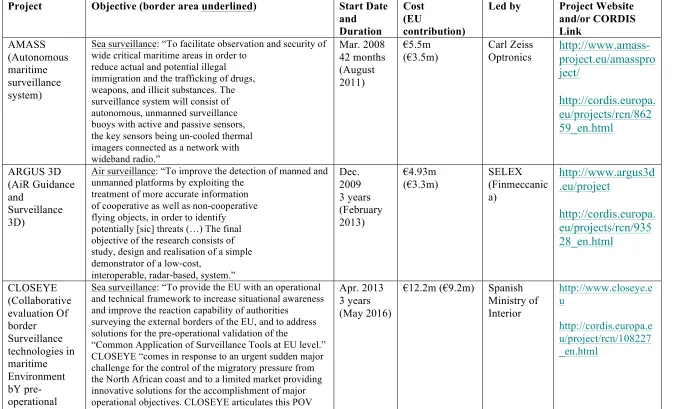
Table of Selected Border Surveillance Projects from the European Union’s FP7 Security Programme
Project Objective (border area underlined) Start Date
and Duration
Cost (EU
contribution)
Led by Project Website
and/or CORDIS Link AMASS (Autonomous maritime surveillance system)
Sea surveillance: “To facilitate observation and security of wide critical maritime areas in order to
reduce actual and potential illegal immigration and the trafficking of drugs, weapons, and illicit substances. The surveillance system will consist of autonomous, unmanned surveillance buoys with active and passive sensors,
the key sensors being un-‐cooled thermal
imagers connected as a network with wideband radio.” Mar. 2008 42 months (August 2011) €5.5m
(€3.5m)
Carl Zeiss
Optronics
http://www.amass-
project.eu/amasspro
ject/
http://cordis.europa.
eu/projects/rcn/862
59_en.html
ARGUS 3D (AiR Guidance and Surveillance 3D)Air surveillance: “To improve the detection of manned and unmanned platforms by exploiting the
treatment of more accurate information
of cooperative as well as non-‐cooperative
flying objects, in order to identify potentially [sic] threats (…) The final objective of the research consists of study, design and realisation of a simple
demonstrator of a low-‐cost,
interoperable, radar-‐based, system.”
Dec. 2009 3 years (February 2013) €4.93m
(€3.3m)
SELEX (Finmeccanic a)
http://www.argus3d
.eu/project
http://cordis.europa.
eu/projects/rcn/935
28_en.html
CLOSEYE (Collaborative evaluation Of border Surveillance technologies in maritime Environment bY pre-operational validation of innovativeSea surveillance: “To provide the EU with an operational and technical framework to increase situational awareness and improve the reaction capability of authorities
surveying the external borders of the EU, and to address solutions for the pre-operational validation of the
“Common Application of Surveillance Tools at EU level.” CLOSEYE “comes in response to an urgent sudden major challenge for the control of the migratory pressure from the North African coast and to a limited market providing innovative solutions for the accomplishment of major operational objectives. CLOSEYE articulates this POV through three phases encompassing the necessary activities to:
Apr. 2013 3 years (May 2016)
€12.2m (€9.2m) Spanish
solutions) • identify the problem and the alternatives
• demonstrate that there are existing innovative solutions which provide the required additional capabilities • to assess the performance levels of these solutions • and to evaluate the experimentation results and promote their extensibility to future solutions.”
CONTAIN (Container Security Advanced Information Networking)
Sea surveillance: “To support transport security stakeholders in managing container
security threats as part of an integrated approach to the management of transportation networks; provide a coherent set of technology options for
screening and scanning, plus container integrated sensor, communication, and
security technologies to monitor
container movements and security related parameters in real time; enable
ports to establish upgraded port
container security processes; and provide information feeds to port community systems and national and European security databases.”
Oct. 2010 42 months
€15.6m
(€10m)
FOI (Swedish Defence Research Agency)
http://www.contain
project.com/
http://www.contain
project.eu/
EFFISEC (EFFicient Integrated SECurity Checkpoints)Sea and land surveillance: “(1) To enhance the security and efficiency
of land and maritime checkpoints through technology; (2) improve the working conditions for border inspectors; (3) increase flow of people crossing borders.”
May 2009 4 years
€16.1m
(€10m)
Morpho
http://www.effisec.
eu/
http://cordis.europa.
eu/projects/rcn/909
55_en.html
GLOBE (European Global Border Environment)Land surveillance: “To provide a comprehensive framework
in which an integrated global border management system must be developed (…) moving throughout the four main layers of border control (country of origin, transit areas, regulated and unregulated border lines, and internal territory). Described as the “first phase” in the EUROSUR demonstration project.”
July 2008 12 months
€1m
(€1m)
I2C (Integrated System for Interoperable sensors and Information sources for Common abnormal vessel behaviour detection and Collaborative identification of threat)
Sea surveillance: “To combine radar and vessel-‐tracking
systems together with new prototypes and sensor technologies to create an “all weather traffic surveillance” system that it claims will be able to “track small crafts” over a “wide maritime zone [of] up to 200 nautical miles.” Will
incorporate data from “deployable sensor platforms” including aircraft and vessel patrols, unmanned submarine vehicles (USVs), and “Zeppelin” airships, which offer “absolute quiet flight with no vibration for high resolution observation quality and a payload of 2 tons for sensors and communication devices.” Promises EUROSUR a “common intelligent operational traffic picture appending to vessel tracks information [sic] on performed activities, flags, sea state conditions, regulations, etc.”; the capacity to “detect abnormal vessel behaviours and issue automatically alarms to operator for validation.”
Oct. 2010 4 years
€16m
(€9.9m)
DCNS (French naval contractor)
http://www.i2c.eu/
http://cordis.europa.
eu/projects/rcn/962
59_en.html
OPARUS (Open Architecture
for UAV-‐based
Surveillance System)
Air Surveillance: “(1) The integration of UAVs/drones into
EUROSUR by defining the “open architecture for the operation of
unmanned air-‐to-‐ground wide area land
and sea border surveillance platforms in Europe,” taking into account the draft
legislation for insertion of UAVs into civilian airspace currently being drafted
by the European Commission and
EUROCONTROL (the pan European Civil Aerospace Association); (2) demonstrate drone surveillance, secure datalinks, communication networks, and a generic ground control station.”
Sept. 2010 18 months
€1.4m
(€1.19m) Sagem
http://cordis.europa.
eu/projects/242491
(Interoperable approach to the European union maritime security management)
European Maritime Security Awareness by addressing the insufficient
interoperability of European and national assets with a view to generating unified data models for seamless exchange and contributing to address the discrepancies of the behavioural, organisational, and cultural issues.”
15 months (€0.7m) Underwater
Systems
eu/projects/rcn/862
54_en.html
PERSEUS (Protection of European seas and borders through the intelligent use of surveillance)
Sea surveillance: “(1) Showcase an “EU Maritime Surveillance System of Systems”
incorporating “existing national systems and platforms, enhancing them with innovative capabilities and moving beyond EUROSUR’s 2013 expectations”; (2) support the development of the member states’ NCC network and incorporate both FRONTEX and the surveillance systems of the European Maritime Safety Association. Includes applications to improve “detection and identification of non collaborative/suspicious small boats and low flying aircraft”; “enhanced and increasingly automated detection of abnormal vessel behaviours”; and “identification of threats and tracking of
reporting and non-‐reporting vessels.”
Jan. 2011 4 years
€43.7m
(€27.9m)
Indra
Sistemas
http://www.perseus
-fp7.eu/
http://cordis.europa.
eu/projects/rcn/975
15_en.html
SAGRES (Services Activations for Growing Eurosur’s Success)Sea surveillance: “1.Tracking vessels on the high seas with two main components:
a.Monitoring of a specific third country port. b.Tracking the identified vessel over high seas. 2.Punctual monitoring of third-country port and coasts with one component:
a.Monitoring of specific ports and stretches of third country coasts.”
Jan. 2013 2 years (Dec. 2014)
€5.7m (€3.4m) GMV
Aerospace and Defence
http://www.coperni
cus-sagres.eu/
http://cordis.europa.
eu/projects/rcn/106
574_en.html
SEABILLA (Sea Border Surveillance)Sea surveillance: “(1) Define the architecture for costeffective
European Sea Border
Surveillance systems, integrating space, land, sea, and air assets, including legacy
June 2010 45 months
€15.6m
(€9.9m)
SELEX (Finmeccanic a)
http://www.seabilla
systems; (2) apply advanced technological solutions to increase performances of surveillance functions; (3) develop and demonstrate significant improvements in detection, tracking, identification, and automated behaviour
analysis of all vessels, including hard-‐todetect
vessels, in open waters as well as close to coast.”
SECTRONIC (Security system for maritime infrastructure, ports and coastal zones)
Sea surveillance: “To develop “a 24h small area surveillance
system that is designed to be used on any ship, platform, container/oil/gas terminal or harbour” using “all accessible means of observation (offshore, onshore, air, space) (…) exchanged via an onshore control center.””
Feb. 2008 4 years
€4.1m
(€2.8m)
Marine & Remote Sensing Solutions
http://www.sectroni
c.eu/
http://cordis.europa.
eu/projects/rcn/862
57_en.html
SOBCAH (Surveillance of Borders, Coastlines and Harbours)Land and Sea Surveillance: “To identify the main threats relevant to
”green” and “blue” borders; elaborate the most suitable architectural solutions based on the most advanced existing sensors and network technologies; execute a proper modelling of the established solution; carry out the technology validation of the selected solution, first in the laboratory and then in the port of Genoa (Italy); elaborate a consistent road map.”
Feb. 2006 18 months
€3m
(€2m)
Galileo
Avionica
ftp://ftp.cordis.euro
pa.eu/pub/fp7/secur
ity/docs/sobcah_en.
General Border Surveillance: “To produce an inventory of needed
standards for stand-‐alone equipment
used for border security.”
Feb. 2007 18 months
€0.7m
(€0.5m)
Sagem
ftp://ftp.cordis.euro
pa.eu/pub/fp7/secur
ity/docs/straborsec_
en.pdf
SUNNY (Smart UNmanned aerial vehicle sensor NetworkAir Surveillance: “The SUNNY project aims to contribute to EUROSUR by defining a new tool for collecting real-time information in operational scenarios.
SUNNY represents a step beyond existing research
January 2014 to June 2017
€14.4m (€9.6m) BMT Group
http://cordis.europa.
for detection of border crossing and illegal entrY)
projects due to the following main features:
•A two-tier intelligent heterogeneous UAV sensor network will be considered in order to provide both large field and focused surveillance capabilities, where the first-tier sensors, carried by medium altitude, long-endurance autonomous UAVs, are used to patrol large border areas to detect suspicious targets and provide global situation awareness. Fed with the information collected by the first-tier sensors, the second-first-tier sensors will be deployed to provide more focused surveillance capability by tracking the targets and collecting further evidence for more accurate target recognition and threat evaluation. Novel algorithms will be developed to analyse the data collected by the sensors for robust and accurate target identification and event detection;
•Novel sensors and on-board processing generation, integrated on UAV system, will be focus on low weight, low cost, high resolution that can operate under variable conditions such as darkness, snow, and rain. In particular, SUNNY will develop sensors that generate both RGB image, Near Infrared (NIR) image and hyperspectral image and that use radar information to detect, discriminate and track objects of interest inside complex environment, over land and sea. Alloying to couple sensor processing and preliminary detection results (on-board) with local UAV control, leading to innovative active sensing techniques, replacing low level sensor data communication by a higher abstraction level of information communication.
•The exploitation and adaptation of emerging standard wireless technologies and architectures as IEEE 802.11a/g/n, IEEE 802.11p, DVB-T2, Mobile WiMAX, LTE, and Wi-Fi@700MHz will be considered due to their low cost and advantageous features.”
TALOS (Transportable autonomous patrol for land border
surveillance)
Land surveillance: To field-‐test “a mobile, modular,
scalable,
autonomous and adaptive system for protecting European borders” that will
“take measures to stop the illegal action almost autonomously with supervision of border guard officers.” Uses drones and
June 2008 4 years
€19.5m
(€12.9m)
PIAP (Polish denfence contractor)
unmanned land vehicles.
WIMAAS (Wide maritime area airborne surveillance)
Sea and air surveillance: “Provide the airborne building block of
maritime surveillance with the potential for reduced cost of operation, more autonomous and improved efficiency through the introduction of air vehicles with reduced or zero onboard crew [drones] (…) You cannot control what you do not patrol. Even if cooperation is crucial, air assets are a unique capability
for wide-‐area maritime surveillance
because they provide situation awareness over extended areas
(endurance, speed, and long-‐distance detection), re-‐
direction to areas of
interest (threat) and flexible reaction
(inspection when needed). WiMA²S will
develop concepts and technologies for better operational use at lower costs of Maritime Surveillance Manned Airborne Vehicle, and Maritime Surveillance Optionally Piloted Vehicles because regulations will not allow UAVs to fly across European Airspace for years to come.”
Dec. 2008 3 years
€4m
(€2.7m)
Thales Systemes Aeroportes