The Thirty-Third AAAI Conference on Artificial Intelligence (AAAI-19)
Beyond Speech: Generalizing D-Vectors for Biometric Verification
∗Jacob Baldwin, Ryan Burnham, Andrew Meyer, Robert Dora, Robert Wright
Assured Information Security, Inc. 153 Brooks Rd.
Rome, NY 13441
{baldwinj, burnhamr, meyera, dorar, wrightr}@ainfosec.com
Abstract
Deep learning based automatic feature extraction methods have radically transformed speaker identification and facial recognition. Current approaches are typically specialized for individual domains, such as Deep Vectors (D-Vectors) for speaker identification. We provide two distinct contributions: a generalized framework for biometric verification inspired by D-Vectors and novel models that outperform current state-of-the-art approaches. Our approach supports substitution of various feature extraction models and improves the robust-ness of verification tests across domains. We demonstrate the framework and models for two different behavioral biometric verification problems: keystroke and mobile gait. We present a comprehensive empirical analysis comparing our frame-work to the state-of-the-art in both domains. Our models per-form verification with higher accuracy using orders of mag-nitude less data than state-of-the-art approaches in both do-mains. We believe that the combination of high accuracy and practical data requirements will enable application of behav-ioral biometric models outside of the laboratory in support of much-needed improvements to cyber security.
Introduction
Automatic feature extraction is revolutionizing the appli-cation of machine learning. The advent of deep learning has given rise to viable automatic feature extraction meth-ods (LeCun, Bengio, and Hinton 2015) that derive latent features from high-dimensional problem spaces with little-to-no domain knowledge. This approach has been demon-strably more effective than traditional handcrafted features, leading to breakthroughs in computer vision (Krizhevsky, Sutskever, and Hinton 2012), speech recognition (Graves, Mohamed, and Hinton 2013), and artificial intelligence (Sil-ver and Hassabis 2016).
Deep learning is leading to similar advancements in biometrics, where it has been successfully applied to fa-cial (Taigman et al. 2014) and speaker recognition (Snyder et al. 2017). One such advancement is an approach for speaker
∗
This research was developed with funding from the Defense Advanced Research Projects Agency (DARPA). The views, opin-ions and/or findings expressed are those of the author and should not be interpreted as representing the official views or policies of the Department of Defense or the U.S. Government.
Copyright c2019, Association for the Advancement of Artificial Intelligence (www.aaai.org). All rights reserved.
verification known as Deep Vectors (D-Vectors) (Variani et al. 2014). Speaker verification, and biometric verification in general, is the process of positively identifying an indi-vidual based upon their unique biometric patterns, such as speech. This technology has many important applications including secure computer access (Smith 2018) and fraud detection (Cowley 2018).
D-Vectors automatically extracts a latent feature space from speech audio that effectively separates the unique-nesses of individuals. This approach has demonstrated sig-nificant improvements over competing speaker verification methods with regard to equal error rates (EER) and robust-ness to noise (Variani et al. 2014; Heigold et al. 2016); how-ever, the D-Vectors approach and models are not passive, require explicitly formatted input to function, and specific to speaker verification. As such, D-Vectors has not been ex-plored outside of speaker verification.
In this paper, we present a novel framework, inspired by D-Vectors, that generalizes beyond speaker verification and can readily be applied to any biometric verification prob-lem. The only requirements for the application of this frame-work are user-labeled data and a parameterized model for feature extraction. As evidence of the framework’s general-ity, we apply it to two distinctly different and challenging behavioral verification problems, keystroke and mobile gait. Unlike in prior applications of D-Vectors, the data was col-lected passively and few assumptions are made upon input sequences. Additionally, we provide an empirical evaluation that shows our approach is more robust and significantly out-performs modern state-of-the-art (SOA) verification meth-ods for these modalities. Our key contributions can be sum-marized as follows:
• Generalization of D-Vectors as a framework for any bio-metric verification problem
• Improvements to the robustness of similarity scoring by incorporating two additional distance measures
• Detailed descriptions of how the framework can be ap-plied to keystroke and mobile gait verification
• A novel featurization model for keystroke data that breaks from four decades of research and dramatically improves performance
datasets against the latest comparable SOA methods • Results across domains demonstrating significant
reduc-tions in EER,by greater than 10%
• Our approach demonstratesorders of magnitude reduc-tions in data requirements
Background
Traditionally, handcrafted features are used for biometric verification; a probe (“sample”) composed of those features is compared against a user’s signature(s) to determine if the probe data matches the patterns defined in the signature(s). The signature is a model or a distribution that describes a user’s behavior in a given context (e.g., keystroke timings). This is true for the two behavior biometric domains we study in this paper, keystroke and mobile gait verification.
Current SOA engineered features in keystroke biometric verification are extracted from key-pairs (i.e., digraphs) or
n-grams. For every pair or n-gram several features are ex-tracted based on the timings of the press and release of the keys (Dora et al. 2013). These features are then compared using a distance metric or traditional classification algorithm (Banerjee and Woodard 2012).
Gait detection using inertial sensors, specifically those available in mobile phones, has received far less atten-tion (Lu et al. 2014). Tri-axial accelerometer and gyroscope are the most commonly used mobile sensors for gait anal-ysis. Typically, arbitrarily-sized windows are drawn from the samples and features are extracted from these windows. Features are often drawn from both the time and frequency domains, and often include standard statistical measures (mean, standard deviation, etc.). Classification algorithms are then applied to these features, with each window rep-resenting a sample (Anguita et al. 2013).
While handcrafted features can be effective, they require a well-defined connection between the data and behavioral models, excessive data filtering, and extensive outlier detec-tion. It can also be difficult to find features that capture the signal of the model and not the noise. These shortcomings have been demonstrated on several occasions by keystroke dynamics researchers. Killourhy & Maxion (Killourhy and Maxion 2009) and Murphy et al. (Murphy et al. 2017) com-pared algorithms reported by several different studies on var-ious datasets, including real-world datasets, and found that the performance of these algorithms often degraded signifi-cantly outside of laboratory settings.
Automatic feature extraction can improve on these weak-nesses and minimizes bias introduced by human-defined fea-tures. To this end, D-Vectors were originally developed for speaker verification with “Ok Google” (Variani et al. 2014). The authors use speech processing and a small Deep Neural Network (DNN) to perform automatic feature extraction to derive a feature set for speaker representations that outper-forms standard methods and is more robust to noise. Heigold et al. (Heigold et al. 2016) implemented an alternative end-to-end approach for training D-Vector representations that trains the model directly on the verification task rather than using an intermediary classification step. This approach in-troduces several layers of complexity to produce statistically
significant, yet marginal, improvements to accuracy. Our ap-proach generalizes Variani et al.’s (Variani et al. 2014) clas-sification approach to provide a framework that operates in-dependently of the data type.
Method: D-Vectors
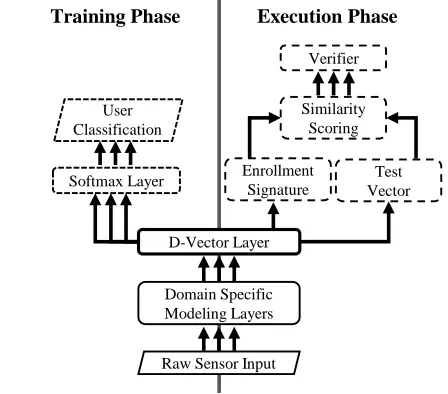
In this paper, we show that D-Vectors can be generalized beyond speaker verification and applied, as a framework for training and employing DNNs, to any verification prob-lem. Figure 1 is a block diagram of our general D-Vector framework. Our architecture employs a base DNN model that feeds two distinct phases: training and execution. In the training phase, the model parameters are tuned to learn the latent feature space described by the D-Vector. This is fol-lowed by the execution phase, where D-Vector values are used as signatures and similarity scores are calculated to per-form verification.
Softmax Layer
Training Phase Execution Phase
Enrollment Signature
Test Vector Similarity
Scoring Verifier
User Classification
Raw Sensor Input D-Vector Layer
Domain Specific Modeling Layers
Figure 1: D-Vector framework diagram. This diagram de-picts both the training and execution phases.
Both phases share the same base DNN model. The model starts with theRaw Sensor Input that accepts sensor read-ings from whichever modality of biometrics is being mea-sured. This is followed byDomain Specific Modeling Lay-ers which contains pre-processing techniques and a DNN. First, we transform the raw data into a usable format for the DNN. The DNN must be carefully designed to appropriately model the problem. For the two biometric modalities that we apply the framework to, keystroke and gait, we provide de-tails on the design of these layers in greater detail in subse-quent sections. The model ends at theD-Vector Layerwhich, once trained, describes a point in a latent feature space that is highly discriminative between subjects.
of lengthn, wherenis equal to the number of subjects in the training corpus. This layer enables us to train the DNN as a standard n-class classification problem using logistic regression. Each output node on the softmax layer corre-sponds to the predicted probability that a specific subject created the data sample. We optimize and train the DNN us-ing a cross entropy loss function on the prediction error. We hypothesize that the classification training process will au-tomatically extract features that are discriminative between the various subjects in the training corpus and that these fea-tures generalize well, assuming that the training corpus is sufficiently representative of the intended target population. Once training is complete, theSoftmax Layer is discarded and we are left with a model that translates subject data into points within the discriminative D-Vector space.
After training, the DNN model can be employed in the ex-ecution phase. This phase includes subject enrollment (sig-nature generation) and similarity evaluations (comparison of D-Vector samples against a signature). Enrollment involves multiple D-Vector samples from a single subject and aver-ages them to produce a single D-Vector that can be used as a signature for that subject.
Once thisEnrollment Signatureis collected, it can be ver-ified against one or moreTest Vectorsusing similarity mea-sures to verify whether the test vector is from the same sub-ject as the enrollment signature. This is accomplished by the
Similarity Scoring function of the architecture. Unlike the original D-Vector work, our approach uses a combination of three scoring measures: cosine similarity, L2distance, and z-score using logistic regression. Later in our empirical study, we show that the additional measures, L2 distance and z-score, increases the accuracy of the approach beyond cosine similarity alone. Finally, these scores are combined as fea-tures to a binary logistic regression classifier, Verifier, that learns an appropriate threshold for verifying if the signature and test vector are from the same subject. This last classifier can be trained by reusing the original training corpus or a secondary corpus.
Keystroke Verification
While the D-Vector framework itself is data-agnostic, its success depends on the design and implementation of an ap-propriate model for data type. The model must be carefully designed to capture the relevant patterns within the data. We describe a novel design for a DNN model of keystroke data that captures more information than prior methods and, thus, produces more accurate results.
Classical approaches to keystroke verification use aggre-gate key-pair timing statistics to model these parameters. A major shortcoming of this approach is that the statistics do not model long-term (beyond two keys) inter-key patterns that may be present in keystroke data. Our initial keystroke model fed these traditional n-gram features into a simple neural network with three fully connected layers. This only produced a minor improvement over SOA methods, so we employed an alternative approach that uses more of the data and discovers long-term patterns. We hypothesize that such patterns provide valuable verification information that can be automatically extracted using an appropriate model.
Preprocessing The keystroke data ingested by our model was collected by recording key events that occur every time a key is pressed or released. Three values are recorded for each key event: the unique key identifier, whether the event was a press or release, and a timestamp of the event in mil-liseconds. Once collected, we perform minor processing be-fore feeding it to our model. First, the timestamps are con-verted to relative times; the first keystroke in a session is discarded and the other time values are calculated as the dif-ference in timestamps between each key event, ∆t. Next, any∆tgreater than 500msis removed, as this represents a sufficiently long pause not reflective of fluid typing motions. Finally, the∆tvalues are transformed into scores between zero and one and normalized. We found that key timings fol-low an exponential distribution, so the mean of the training dataset is taken and values are transformed using the expo-nential cumulative distribution function:
y= 1−e−λ∆t
whereyis the transformed timing value andλis the mean.
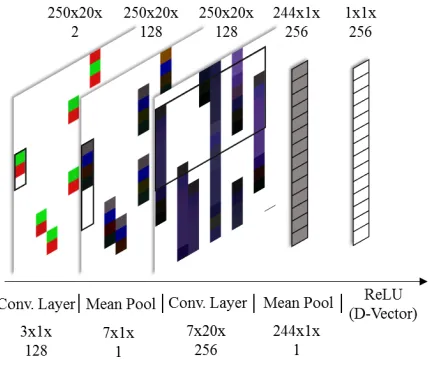
Figure 2: DNN architecture for keystroke; the boxes sent convolutional filters, top dimensions and images repre-sent layer input, and bottom dimensions reprerepre-sent the size of a filter.
Once the data has been converted to images, they are fed to the model for feature extraction. The first convolution layer in the model is designed to detect features from a sin-gle key press and release series of events. Users who type quickly or use various hot-keys often produce keys that are out of sequence, in that the press of one key is followed by the press of another, rather than the release of the first. In our analysis of keystroke data, we found that press and release events for a single key generally occur within three events of one another, so we use convolutional filters of size 3x1 and stride 1 to extract these features. This layer is followed by a mean pooling layer, which is performed across seven rows – determined through empirical evaluation – in each column. This operation stretches the events over multiple rows in-creasing the overlap of events between keys.
The second convolution layer extracts features across multiple keys, while still locally in time. We use convolu-tional filters of size 7x20 and stride 1 to discover features that describe how subjects type certain sequences of keys. This layer also reduces the dimensionality of the image by not using padding, which reduces the number of columns to one and produces six fewer rows than the input image. The last layer of the CNN is a second mean pool; function-ally, it removes dependence on location (within the image) of the sequence of keys that activated the filter. It then feeds into a final Rectified Linear Unit (ReLU) activated layer that serves as the D-Vector Layer. Dropout is applied aggres-sively, 75%, to this last layer to prevent over-fitting.
Our keystroke verification approach drew inspiration from traditional handcrafted features, as seen in the con-struction of the convolutional layers, while greatly simpli-fying the data processing and outlier detection performed. This approach shows how any verification domain can take advantage of the D-Vectors framework and the benefits that it provides by drawing inspiration from and simplifying tra-ditional processing methods.
Mobile Gait Verification
We also apply our D-Vector framework to mobile gait ver-ification. Visual gait verification examines video for fea-tures, whereas the features for mobile gait verification are extracted from accelerometer or gyroscopic sensors placed directly on the subject. Our analysis seeks to determine if there are regular, unique patterns in how an individual walks that can be reliably detected by an inertial sensor and used to verify or identify a subject. SOA approaches to this problem employ standard signal processing to extract features based upon frequency and power of the signals (Lu et al. 2014; Kumar, Phoha, and Serwadda 2016). In this section, we de-scribe a novel DNN model that extracts a more discrimina-tive latent feature space for verification.
Preprocessing For this domain, data is obtained in thex, y, andz axes from both the accelerometer (ms2) and
gyro-scope (rads ) of a mobile phone placed in the subject’s hip pocket. For both sensors, readings are sampled at regular in-tervals, typically in the range of 50 to 100Hz. Unfortunately, the values for each sensor reading are heavily dependent on the orientation and manufacturer of the device. If the issues
they present are not mitigated, these dependencies can lead to misleading results (i.e., the learning algorithms pickup on the orientation of a device in an individual’s pocket). To eliminate orientation dependencies, we only use the mag-nitude of the accelerometer and gyroscope data. Following this procedure, leaving just the two magnitude signals as the input source. These signals are further processed by apply-ing a median filter to remove individual noise spikes and a moving average filter to remove environmental noise.
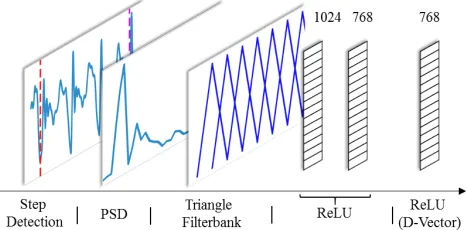
Figure 3: Pre-processing and DNN architecture for mobile gait feature extraction.
Following those initial transformations and noise reduc-tion steps, the data can be processed by our mobile gait model shown in Figure 3. As with the keystroke model, our goal with this model is to extract features for user verifica-tion and identificaverifica-tion using minimal data. Rather than using fixed-time windows for our samples, which may or may not contain enough relevant step data, we perform step detection to isolate samples of data with six steps. Our assumption is that six sequential steps provide a sufficient window to ex-hibit identifiable features in walking data.
As a first step in isolating sample frames with six steps, we search for local minima in the accelerometer readings. Once the minima are detected, the values between the local minima are considered to be a part of aStep Pair, both a left and right step. The detected minima correspond only to either left or right steps based on which pocket the mobile phone is in. The minima for the opposite leg is significantly less pronounced and, thus, more difficult to detect, so the two are combined into one step pair (first graph in Figure 3). Step detection is performed only on the accelerometer data; however, as the gyroscope and accelerometer readings are synchronized, we are able to frame the data in identical locations. The left-most graph in Figure 3 shows typical ac-celerometer data with a six-step sample identified between the red and purple dashed lines.
Cepstrum Coefficient (MFCC) method used in speech pro-cessing to summarize the strength of the signal in each fre-quency. Filter coefficients are multiplied with the spectral density at each frequency and aggregated to calculate each filter value. These filters produce 20 values (10 each for ac-celerometer and gyroscope) and serve as the input for the DNN model.
Automatic Feature Extraction The DNN in our model consists of three fully-connected ReLU activated layers. During the training process, only the parameters in these layers are updated, whereas all parameters in the previous processing steps are fixed. The DNN provides the D-Vectors framework with a model for extracting latent space features from the signal features. The size of each layer is shown in Figure 3. Finally, dropout is applied to each DNN layer, 50% on the first layer and 75% on the remaining two layers, to prevent over-fitting.
Our neural network archeticture design and data process-ing drew from the original D-Vectors approach (Variani et al. 2014) because gait data is very similar in format to voice data: time series data sampled at a constant rate. Al-though every domain is different, data from different modal-ities with similar structure can use some of the same pro-cessing techniques for the D-Vector approach.
Empirical Study
In this section, we describe a series of experiments that demonstrate that our D-Vector framework can be applied to two distinctly different biometric verification problems and that it also surpasses the performance of prior SOA ap-proaches in both domains. The two algorithms that we com-pare our approach against are the keystroke G&P verifica-tion algorithm (Gunetti and Picardi 2005) and the mobile gait verification algorithm by Lu et. al (Lu et al. 2014) (In-tel). We compare these algorithms with our approach (D-Vector) by accuracy, EER, robustness, and data efficiency.
Datasets
We use three datasets in our experiments to evaluate the ro-bustness of the approaches and how their performance gen-eralizes. The first dataset (MultiMod) is one we collected; it contains both keystroke and gait data, which we describe in detail below1. Additionally, we use two publicly
avail-able datasets as benchmarks — one for keystroke (Clarkson) (Murphy et al. 2017) and gait (UCI) (Anguita et al. 2013).
For our MultiMod dataset, we employed a multi-phase experiment designed to replicate real-world activities to en-sure that our model accuracy remained high in practice. 104 subjects performed a series of tasks on a desktop, smart-phone, and tablet to produce fixed-text keystrokes, free-text keystrokes, and movement data. For fixed-text, the subjects transcribed three sentences that included the most common key pairs to ensure sufficient pairs for comparison both between users and devices. Free-text keystroke data was produced from online shopping and survey questions and
1
This dataset was collected with IRB approval. Approval docu-ments can be provided upon request
movement data was collected by smartphones while sub-jects walked a track. The dataset contains approximately 1,200,000 desktop key-events, representing 4,242 samples, where a sample is 250 sequential key events, (Mean per user 41.588, Min. 15, Std. Dev. 7.959) and approximately 1,900,000 mobile (smartphone and tablet) key events, rep-resenting 4,645 samples (Mean per user 44.663, Min. 25, Std. Dev. 10.486). Accelerometer and gyroscope data was collected at 100 Hz. Our dataset contains approximately 147,200,000 movement events, of which 19,806,744 are walking motion events, divided evenly between accelerom-eter and gyroscope, representing 28,300 samples, where a sample is six steps of walking data (Mean per user 272.115, Min. 123, Std. Dev. 49.82).
The Clarkson benchmark keystroke dataset (Murphy et al. 2017) consists of 103 users collected over 2.5 years from subjects’ personal machines during normal interactions, rep-resenting a realistic use case. The dataset consists of 87 users with sufficient data. There are 40,380 total samples, with a mean of 484 samples per user (Std. Dev. 587). The number of samples per user varied significantly from the MultiMod dataset, as subjects could enable or disable the keylogger at any time.
Finally, we use the UCI (Anguita et al. 2013) dataset as our benchmark for mobile gait. Unlike the MultiMod dataset, it was collected at a sampling rate of 50Hz. As with MultiMod, only the walking data from this dataset is used. There are 1,769 total extracted samples from 30 users in the dataset, with a mean of 59 samples per user (Std. Dev. 14).
Keystroke Verification Results
We compare our D-Vector keystroke verification approach with the SOA G&P approach. The G&P approach is based upon the traditional handcrafted key-pair features, described in the Background section, and provides a good contrast with the our automatic feature extraction based method.
To train the D-Vectors models, the subjects are randomly partitioned into 70% for training and 30% for testing. In do-ing so, all testdo-ing is performed on users that the framework has never seen to demonstrate that the extracted D-Vector features can discriminate universally.
During testing, five randomly selected samples are used as enrollment samples for each user. Unlike D-Vectors, G&P does not require a separate training phase. Instead, it per-forms a pair-wise comparison of all enrolled subjects with a sample from an unlabeled subject (assumed to be an enrolled subject). For a fair comparison, we take five random samples (without replacement) for each subject to create enrollment signatures. When testing, samples from the same 30% split of subjects used with D-Vectors are used with G&P to ensure fairness.
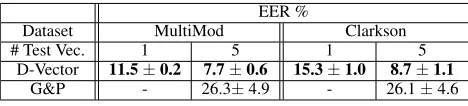
Table 1: Keystroke verification results. It compares the D-Vector approach with the SOA G&P algorithm using one (1) and five (5) samples as test vectors. Standard deviation of the results are provided. Bold results are significantly better. Dashed results (-) indicate the approach failed.
EER %
Dataset MultiMod Clarkson
# Test Vec. 1 5 1 5
D-Vector 11.5±0.2 7.7±0.6 15.3±1.0 8.7±1.1
G&P - 26.3±4.9 - 26.1±4.6
Table 1 provides the results of these experiments. On the MultiMod dataset, D-Vectors greatly exceeds the perfor-mance of G&P, achieving an EER of just 11.5% using one (1) sample for a test vector and 7.7% when five (5) samples are used. Whereas, G&P manages just 26.3% EER using five samples of data as a test sample and fails entirely when only one sample is used. The reason for the failure is that there are not consistently enough matching bi-grams in enrollments and test samples of that size for G&P to compute its simi-larity measures accurately. Our approach is not burdened by this constraint. Results are similar on the Clarkson dataset, where D-Vectors achieves 15.3% and 8.7% respectively and G&P achieves just 26.1%. The slight drop in D-Vector’s per-formance on the Clarkson dataset is not unexpected, as the data is from unstructured activities and, as such, those results are more indicative of real-world performance.
The performance of the G&P approach on the Clarkson dataset is much worse than the 10.4% reported in (Murphy et al. 2017) because 10,000 keystroke events were used for enrollments and 1,000 keystroke events were used as sam-ples for test vectors in that study. This and G&P’s inability to use small data samples demonstrates the data efficiency of D-Vectors, in that it can achieve similar or greater perfor-mance using far less data for enrollment and testing. Further, D-Vectors scales more effectively as the number of enrolled subjects increases. Calculating the similarity measures using D-Vectors is a linear time operation requiring justO(d+m)
operations per verification test, whereas G&P is anO(d2m) operation wherem is the number of enrolled subjects and dis the number of samples per enrollment. This difference translated to dramatic differences in run times. On a mod-ern dual-CPU machine with GPU acceleration the D-Vectors method took a few hours to train and a few minutes to per-form all the tests. Whereas, our G&P implementation took more than three days to compute these results.
Mobile Gait Verification Results
In our second set of experiments, we compare our D-Vectors mobile gait verification approach to the SOA Intel ap-proach (Lu et al. 2014). These results emphasize the signifi-cance of the D-Vectors approach as a framework for extract-ing discriminative features rather than simply improvements to the model. Whereas the G&P and D-Vectors keystroke approaches use completely different models, our D-Vectors method uses a similar data processing model as the Intel model. The main distinctions are the manner in which the
models are trained and that the D-Vector approach performs additional feature extraction with the DNN layers (beyond the signal processing steps), whereas Intel uses a Gaussian Mixture Model. Also, MFCC features are extracted using the full speech method in the Intel approach, which includes the higher frequency space and log scaling.
For fair comparison, we frame the data using the same step detection technique described earlier for preprocessing mobile gait data. A training-test split of 70/30% of the sub-ject data is performed on the Multimod dataset, similar to what was done in the prior experiments. In this case, both methods have training and execution phases and use the same data split. The UCI dataset does not contain enough data to effectively train and test our methods. As such, all UCI data was used in verification tests using models pre-trained on the MultiMod dataset. Again, enrollment signa-tures were comprised of 5 samples and all experiments were run 10 times using different random seeds for selection.
Table 2: Mobile gait verification results. It compares the D-Vector approach with the SOA Intel algorithm using one (1) and five (5) samples as test vectors. Standard deviation of the results are provided. Bold results are significantly better.
EER %
Dataset MultiMod UCI
# Test Vec. 1 5 1 5
D-Vector 17.5±0.5 7.0±1.5 15.3±1.4 11.4±2.3
Intel 27.0±0.7 24.2±1.4 28.2±0.2 24.0±1.3
Table 2 provides the results of the comparison experi-ments. D-Vectors surpasses the Intel method by 10% on both datasets using just 1 sample to produce test vectors. If 5 sam-ples are used the difference in performance becomes much more pronounced. The D-Vector approach benefits greatly from the additional data, reducing EER by 10% on the Mul-tiMod dataset and 4% on UCI, whereas the Intel method does not benefit nearly as much.
Finally, the models for the UCI experiments had to be trained on the MultiMod dataset due to its small number of subjects. Despite being trained on a different dataset, the models from each approach generalized and transferred well. This supports our hypothesis that the D-Vectors au-tomatically extracts and learns discriminative features that generalize well.
Multiple Similarity Scores
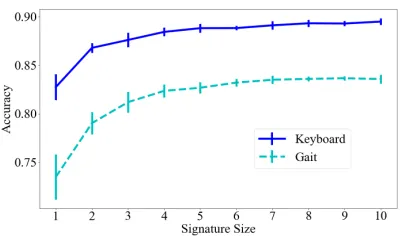
Figure 4: D-Vector verification accuracy for one sample test vector while varying the signature size for both modalities. Accuracy here is the inverse of EER.
In combination, the three measures do generally improve the overall accuracy while never significantly increasing the ERR beyond what the single best measure achieves. To un-derstand why, we measured the correlation, shown in Table 3, of the various scoring measures on the MultiMod dataset for both keystroke and mobile gate data. The results show that while the scores can be quite correlated, they each of-fer some additional information. Further, the results in Table 4 clearly show that all three measures can be used together with no significant loss and increased robustness over indi-vidual measures.
Table 3: Correlation coefficients between the three similarity measures on the MultiMod dataset.
Keystroke Mobile Gait
Score z L2 cos z L2 cos
z 1 0.726 0.693 1 0.606 0.196 L2 0.726 1 0.770 0.606 1 0.261 cos 0.693 0.770 1 0.196 0.261 1
Table 4: EER of using similarity measures individually and combined.
EER %
Dataset/Modality cosine L2 z-score Combined
MultiMod/Keystroke 11.8±0.3 14.4±0.6 13.3±0.8 11.5±0.2 Clarkson/Keystroke 16.1±0.9 27.6±3.7 23.0±1.9 15.3±1.0 MultiMod/Gait 18.0±0.5 30.8±0.7 31.6±1.4 17.5±0.5 UCI/Gait 19.3±2.0 15.0±1.4 21.1±1.1 15.3±1.4
D-Vector Performance Considerations
In the next series of experiments, we examine multiple as-pects of the D-Vectors approach that impact performance. The first of these factors is the amount of data used to pro-duce an enrollment signature. Ideally, an enrollment signa-ture requires minimal data to increase the practicality of the approach. Figure 4 shows the effect of increasing the number
Figure 5: D-Vector verification accuracy for five sample en-rollment signatures while varying the test vector sample size for both modalities. Accuracy is the inverse of EER.
of samples in an enrollment signature on verification accu-racy in both domains using the MultiMod dataset. Accuaccu-racy of the approach increases significantly until the signature is about five samples. Afterwards, there appears to be marginal returns for increasing the size of the signatures. Even signa-tures composed of a single sample are accurate and further demonstrate the data efficiency of the approach.
Next, we examine the effect of increasing the number of samples used as test vectors for performing verification. As with enrollment signatures, we seek to minimize the data. Figure 5 illustrates the performance of D-Vectors for both domains in the MultiMod dataset with enrollment signa-tures comprised of five samples. Increasing the number of samples used as test vectors can significantly improve accu-racy, especially for gait verification. Improvements become marginal beyond five samples.
Finally, it is worth noting the performance increases that can be achieved by fusing results from different modalities. If multiple biometric modalities are available, such as in MultiMod, we can combine the predictions to improve over-all accuracy. Using Bayes’ theorem with a uniform prior we can fuse the predictions as an ensemble. In our MultiMod dataset this ensemble achieves significantly greater perfor-mance, 2.5% EER, than either single modality test.
Conclusion
Acknowledgments
This research was sponsored by the Air Force Research Lab-oratory and DARPA under contract FA8750-17-C-0014. The authors would also like to thank Vir Phoha of Syracuse Uni-versity and Stephanie Schuckers of Clarkson UniUni-versity for providing invaluable data for this research.
References
Anguita, D.; Ghio, A.; Oneto, L.; Parra, X.; and Reyes-Ortiz, J. L. 2013. A public domain dataset for human activity recognition using smartphones. In Artificial Neural Net-works, Computational Intelligence and Machine Learning (ESANN), 2013 European Symposium on, 437–442. Banerjee, S. P., and Woodard, D. L. 2012. Biometric au-thentication and identification using keystroke dynamics: a survey. Journal of Pattern Recognition Research116–139. Cowley, S. 2018. Banks and retailers are tracking how you type, swipe and tap.The New York Times.
Dora, R. A.; Schalk, P. D.; McCarthy, J. E.; and Young, S. A. 2013. Remote suspect identification and the impact of demo-graphic features on keystroke dynamics. InSPIE Defense, Security, and Sensing: Cyber Sensing.
Graves, A.; Mohamed, A.-r.; and Hinton, G. 2013. Speech recognition with deep recurrent neural networks. In 2013 IEEE International Conference on Acoustics, Speech and Signal Processing (ICASSP), 6645–6649. IEEE.
Gunetti, D., and Picardi, C. 2005. Keystroke analysis of free text.ACM Transactions on Information and System Security
8(3):312–347.
Heigold, G.; Moreno, I.; Bengio, S.; and Shazeer, N. 2016. End-to-end text-dependent speaker verification. In Acous-tics, Speech and Signal Processing (ICASSP), 2016 IEEE International Conference on, 5115–5119. IEEE.
Killourhy, K. S., and Maxion, R. A. 2009. Comparing anomaly-detection algorithms for keystroke dynamics. In
2009 IEEE/IFIP International Conference on Dependable Systems & Networks, 125–134. IEEE/IFIP.
Krizhevsky, A.; Sutskever, I.; and Hinton, G. E. 2012. Imagenet classification with deep convolutional neural net-works. InAdvances in neural information processing sys-tems, 1097–1105.
Kumar, R.; Phoha, V. V.; and Serwadda, A. 2016. Contin-uous authentication of smartphone users by fusing typing, swiping, and phone movement patterns. InBiometrics The-ory, Applications and Systems (BTAS), 2016 IEEE 8th Inter-national Conference on, 1–8. IEEE.
LeCun, Y.; Bengio, Y.; and Hinton, G. 2015. Deep learning.
Nature521(7553):436–444.
Lu, H.; Huang, J.; Saha, T.; and Nachman, L. 2014. Unob-trusive gait verification for mobile phones. InProceedings of the 2014 ACM international symposium on wearable com-puters, 91–98. ACM.
Murphy, C.; Huang, J.; Hou, D.; and Schuckers, S. 2017. Shared dataset on natural human-computer interaction to support continuous authentication research. InInternational Joint Conference on Biometrics (ICBJ).
Silver, D., and Hassabis, D. 2016. Alphago: Mastering the ancient game of go with machine learning. Research Blog. Smith, M. 2018. The chaos of unlocking your phone in 2018.Engadget.
Snyder, D.; Garcia-Romero, D.; Povey, D.; and Khudan-pur, S. 2017. Deep neural network embeddings for text-independent speaker verification. InProc. Interspeech, 999– 1003.
Taigman, Y.; Yang, M.; Ranzato, M.; and Wolf, L. 2014. Deepface: Closing the gap to human-level performance in face verification. InProceedings of the IEEE conference on computer vision and pattern recognition, 1701–1708. Variani, E.; Lei, X.; McDermott, E.; Moreno, I. L.; and Gonzalez-Dominguez, J. 2014. Deep neural networks for small footprint text-dependent speaker verification. In