O R I G I N A L R E S E A R C H
Open Access
Estimation of input functions from dynamic
[
18
F]FLT PET studies of the head and neck with
correction for partial volume effects
Sara L Hackett
1*, Dan Liu
1, Anastasia Chalkidou
2, Paul Marsden
2, David Landau
3and John D Fenwick
1Abstract
Background: We present a method for extracting arterial input functions from dynamic [18F]FLT PET images of the head and neck, directly accounting for the partial volume effect. The method uses two blood samples, for which the optimum collection times are assessed.
Methods: Six datasets comprising dynamic PET images, co-registered computed tomography (CT) scans and
blood-sampled input functions were collected from four patients with head and neck tumours. In each PET image set, a region was identified that comprised the carotid artery (outlined on CT images) and surrounding tissue within the voxels containing the artery. The time course of activity in the region was modelled as the sum of the blood-sampled input function and a compartmental model of tracer uptake in the surrounding tissue.
The time course of arterial activity was described by a mathematical function with seven parameters. The parameters of the function and the compartmental model were simultaneously estimated, aiming to achieve the best match between the modelled and imaged time course of regional activity and the best match of the estimated blood activity to between 0 and 3 samples. The normalised root-mean-square (RMSnorm) differences and errors in areas under the curves (AUCs) between the measured and estimated input functions were assessed.
Results: A one-compartment model of tracer movement to and from the artery best described uptake in the tissue surrounding the artery, so the final model of the input function and tissue kinetics has nine parameters to be estimated. The estimated and blood-sampled input functions agreed well when two blood samples, obtained at times between 2 and 8 min and between 8 and 60 min, were used in the estimation process (RMSnormvalues of 1.1± 0.5 and AUC errors for the peak and tail region of the curves of 15%±9% and 10%±8%, respectively). A third blood sample did not significantly improve the accuracy of the estimated input functions.
Conclusions: Input functions for FLT-PET studies of the head and neck can be estimated well using a
one-compartment model of tracer movement and TWO blood samples obtained after the peak in arterial activity.
Keywords: Input function; Partial volume effect; Simultaneous estimation
Background
The role of positron emission tomography (PET) in cancer staging and assessment of treatment response contin-ues to grow [1]. The radiotracer 3-deoxy-3-[18 F]fluoro-thymidine (FLT) is a marker for cell proliferation as it is phosphorylated by thymidine kinase-1, which is selec-tively expressed in the S, G2 and M phases of the cell
*Correspondence: [email protected]
1Gray Institute for Radiation Oncology and Biology, Department of Oncology, University of Oxford, Oxford OX3 7DQ, UK
Full list of author information is available at the end of the article
cycle [2-4]. Numbers of proliferating cells are more closely related to particular aspects of FLT uptake kinetics than to tracer uptake at a fixed time point, and quantita-tive information about tumour uptake kinetics can be extracted from dynamic FLT-PET images via compart-ment modelling, a process that requires the time course (‘time-activity curve’ (TAC)) of tracer concentration in arterial blood to be used as an input function.
The gold standard method used to determine blood TACs is continuous arterial sampling, which is invasive, requires expensive equipment and carries a small risk
to patients [5]. Consequently, other sources of arterial input functions have been explored, such as TACs taken from the vicinity of large blood vessels in dynamic PET images [6,7]. However, accurate determination of input functions from PET images is hindered by the ‘partial vol-ume effect’ (PVE), a term that refers to two distinct but related phenomena: spillover and the tissue-fraction effect [8]. Spillover is caused by the finite spatial resolution of the imaging system and manifests as a blurring of the imaged distribution of activity. The tissue-fraction effect arises because the activity reported in each PET voxel is an aver-age of the corresponding volume, which usually comprises tissues of different types and activity concentrations.
The diameter of the largest blood vessels in the head and neck is around 5 mm [9], which is comparable to the resolution of PET scanners and the dimensions of PET voxels. Some methods used to extract input func-tions from PET images attempt to explicitly correct the PVE using anatomical information taken from computed tomography (CT) or magnetic resonance scans [10-12]. Other approaches, most commonly used in brain imaging, assume that the activity measured in a region represents a mixture of blood and surrounding tissue activities and implicitly correct the PVE by modelling the relative con-tributions of blood and tissue to the total imaged regional activity [13-16].
Models of both the input function and tracer move-ment between the blood vessel and the surrounding tissue can be simultaneously fitted to a total regional TAC taken from the vicinity of the blood vessel in the dynamic PET images. This technique has shown promise for the radio-tracer 2-deoxy-2-[18F]fluoro-D-glucose (FDG) in human
[13] and animal [15] studies, and for the radiotracers FLT [16] and18F-fluoromisonidazole (Fmiso) [17] in human
studies. In this approach, the input function is represented as a mathematical formula, and activity in the surround-ing tissue is linked to it via a compartment model. The parameters of the input formula and compartment model are estimated simultaneously so that the combined mod-elled activity best matches the regional TAC obtained from the dynamic PET images. A challenge for simulta-neous estimation is that the number of parameters may be large and a unique solution not identifiable. Further, the previous studies have used a variety of compartmen-tal (and empirical) models to describe tracer movement between a vessel and the surrounding tissue. An optimal model, which best balances accurate description of the tis-sue TAC and parsimony of parameters, has not yet been established.
This work identifies an appropriate model of tracer movement, then uses the model to simultaneously esti-mate arterial input functions for bolus injections of FLT from TACs of carotid artery regions drawn on dynamic FLT-PET images. We also explore the use of
small numbers of arterial concentration measurements obtained from blood samples to refine possible solutions and thus improve the precision of the resulting arterial TAC estimates. Optimal times for blood sampling have been assessed.
Methods
Written informed consent was obtained from all partici-pants, and the study was approved by the local Research Ethics Committee and UK Administrat0ion of Radioactive Substances Advisory Committee.
Patient details and image acquisition
Six datasets were collected for four patients diagnosed with stage II-III head and neck squamous cell carcinoma. Patients were scanned at the PET imaging centre of St Thomas’ Hospital, London using a GE Healthcare Discov-ery VCT PET-CT scanner (Waukesha, WI, USA). After CT scanning of the head and neck region, patients were injected with 2.59 MBq/kg of [18F]FLT (up to a maximum
of 185 MBq), and PET imaging begun. List-mode PET data were binned into 24 frames (8×15 s, 4×30 s, 6× 60 s, 2×300 s and 4×600 s) for four of the dynamic image sets, while for two image sets, data were binned into 103 frames (30×2 s, 12×10 s, 6×20 s and 55×60 s).
Images were reconstructed using Fourier rebinning, and a two-dimensional filtered back projection algorithm to ensure quantitative accuracy [18]. Corrections for atten-uation, scatter and dead time were performed during sinogram histogramming and reconstruction.
An image array of 128 × 128 × 47 voxels per frame
was used, with dimensions of 5.47 × 5.47× 3.27 mm3. The transaxial full-width half-maximum (FWHM) and full-width tenth-maximum (FWTM) values of the scan-ner at 1 cm along the transaxial axis were 4.9 and 9.5 mm, respectively, and the axial FWHM and FWTM were 4.8 and 10.6 mm, respectively. The voxel spacing of the co-registered CT images was 0.98×0.98×3.27 mm3.
Blood samples were collected through a cannula placed in the radial artery, and18F activity was measured using an Allogg Arterial Blood Sampling System (Allogg AB, Mariefred, Sweden). For the first 24 min, samples were taken at a rate of 1/s. A further two samples were taken at 38 and 56 min post-injection. Blood-sampled input func-tions,b(t), were constructed from18F concentrations in the samples.
Modelling the imaged TAC of the arterial region using the blood-sampled input function
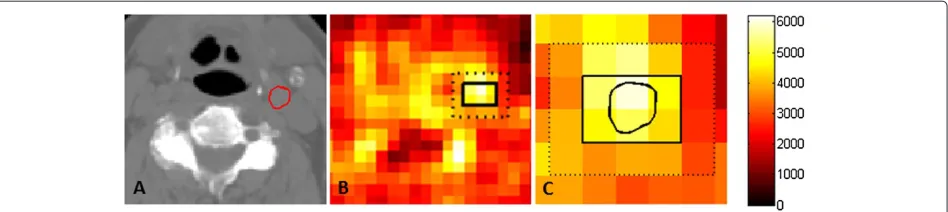
Figure 1Regions of interest in a PET image.(A)A CT slice on which the carotid artery, outlined in red, was delineated.(B)The arterial voxels and external voxels on the corresponding PET image recorded at 2 min. The blood-sampled activity at this time was 12.3 kBq. The arterial voxels containing the carotid artery and surrounding tissue are delineated by the solid black line, and the carotid artery is outlined on the PET voxels in(C). The external tissue, comprising the next layer of voxels out, is delineated by the dashed line.
artery also comprised a significant fractional volume of extravascular tissue. The arterial voxels were identified on each of the eight slices, and the fractional volumes of artery and surrounding tissue,vaandvtis, respectively, were determined. The carotid artery typically constituted 30% to 50% of the arterial voxel volume in the images used in this study. The total activity of the arterial voxels,mtot,
can be modelled as
mtot(t)=vaCa(t)+vtisCtis(t)
=vaCa(t)+(1−va)×f[Ca(t)]
whereCa andCtis are models of the input function and
the TAC of the surrounding tissue, respectively, andf is a compartmental (or empirical) model of the tissue TAC with input functionCa.
However, the total regional activity recorded in the delineated PET voxels also comprises spill-in from the tis-sue in the next layer of voxels out, less the spill-out from the arterial voxels. Thus, the total activity also needs to be modified to correct for spillover, as described in the ‘Modelling of spillover’ section:
mtot(t)=
vaCa(t)+(1−va)×f[Ca(t)]
spillover. (1)
We have tested four different compartmental models: (a) irreversible uptake of tracer in a single non-vascular compartment, (b) reversible tissue uptake, (c) reversible uptake of tracer in the first non-vascular compartment from which tracer was irreversibly taken up in a second non-vascular compartment and (d) reversible uptake of tracer in the first and second non-vascular compartments. These models have one, two, four and five parameters, respectively. We have also tested a two-parameter, phe-nomenological model of tracer movement used by Backes et al. [16]. For each dataset, the five mtot models were
fitted to the mean activity, PETtot, recorded in the
arte-rial voxels using the corresponding blood-sampled data as the input function for the compartmental model. The
MATLAB function ‘lsqnonlin’ (The MathWorks, Natick, MA, USA) was used to fit mtot to PETtot by minimizing
the objective function
O= N
i=1
wi(mtot(ti)−PETtot(ti))2 (2)
where ti is the time at the midpoint of the ith of N measurement intervals, and each weight wi is inversely proportional to the variance of the imaged tracer concen-tration averaged over theith measurement interval.
The optimal model was identified as that with the lowest Akaike information criterion corrected for small sam-ple size (AICc) [19]. The AICc values for all datasets are
shown in Table 1. For all datasets, model B had the lowest AICc value, indicating that a compartmental model that
accounted for tracer movement to and from the vessel was necessary and sufficiently complex to describe the data. The equation of state for model B is
dCtis
dt =K1Ca(t)−k2Ctis(t) (3)
where K1 andk2 are kinetics parameters describing the
rate of tracer movement to and from the tissue, respec-tively.
Simultaneous estimation of the input function and tissue TAC from PETtot
Having found the model mtot which provides the best
estimate of the activity recorded in the arterial voxels, we again fitted this model to PETtot in order to extract
Table 1 AICcvalues of models
Dataset Model AICcvalue
A B C D Backes
P1_1 19.1 5.7 9.7 11.7 12.9
P1_2 19.8 13.0 17.0 19.0 13.2
P2_1 33.1 31.9 35.8 37.8 40.5
P2_2 27.6 21.8 25.7 27.7 22.8
P3_1 7,386 1,966 1,969 1,971 4,929
P4_1 1,676 427 431 433 1,277
AICcvalues, calculated with simulation of spillover, are fitted to theItot(t)data using the blood-sampled input functionb(t).
and accurately be represented by the seven-parameter function [20]:
Ca(t)=
⎧ ⎨ ⎩
0 ift< τ
(A1(t−τ )−A2−A3)exp(L1(t−τ )) . . .
+A2exp(L2(t−τ ))+A3exp(L3(t−τ )) ift≥τ
(4)
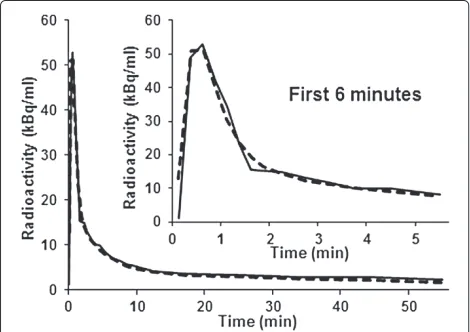
An example of a blood-sampled input curve is shown in Figure 2, together with a fit of Equation 4. Simpler mono- and bi-exponential models of the input function (both with a time-delay parameter for tracer delivery) were also tested but could not adequately describe the blood-sampled input functions. Thus, the final model of the total activity of the arterial pixels has nine parameters to be estimated: two kinetic parameters and seven input function parameters.
Blood samples obtained at a single time point were incorporated into the process of fittingmtotto PETtot by
Figure 2Seven-parameter function fitted to blood-sampled input function.A blood-sampled input function (solid line), measured for the corresponding PET dataset shown in Figure 1, and the fitted function (dashed line).
modifying the objective function to
O= N
i
wi(mtot(ti)−PETtot(ti))2+α.w¯(b(tk)−Ca(tk))2
(5)
whereb(tk)is the measured arterial concentration at time tk andw¯ is the mean value of the weighting factors wi. The constantαis a ratio by which the squared difference between the estimated and measured blood concentra-tions has more influence on the fitting process than the average of the squared residual errors of the modelled mtot(t)values. A range ofαvalues from 2 to 11 was
con-sidered and changes in the accuracy of the Ca models as a function of α were assessed using analysis of vari-ance (ANOVA). The nine independent parameters of the fullmtot model are reduced to eight if the model is
con-strained to match a blood sample value at a particular time point. Thus, in order to avoid under- or over-emphasizing the fit at that time point, a reasonableα value would be around N × 1/8 (that is, 3 or 13 for N = 24 or 103), so that the weight given to the fit of the blood-sample point is one eighth that of the total weight of the fit of the model to PETtot(t). For additional blood samples,
fit-ting was achieved by adding further terms to Equation 5, so that for three samples taken at timestk,tlandtm, the objective function
O=N
i wi(mtot(ti)−PETtot(ti))
2+α.w(b¯ (t k)
−Ca(tk))2+. . .
α.w¯(b(tl)−Ca(tl))2+α.w¯(b(tm)−Ca(tm))2
was used. For two and three blood samples, reasonable
α values would be 2N/ (2×7)and 3N/ (3×6)(3 and 4 respectively forN = 24, and 14 and 17 respectively for N=103).
Initial values of model parameters used for simultaneous estimation
The initial values of the kinetics parameters K1 and k2
input function. The initial values used for the input func-tion parameters were the medians of those obtained by fitting Equation 4 to the PETtot(t) data and are termed
InitPET. We also studied the use of the median values
InitBSIF, obtained from directly fitting Equation 4 to the
blood-sampled input function, as initial values for the estimated input function.
Metrics used for evaluation of results
To evaluate agreement between a blood-sampled input functionb(t)and a simultaneously estimated input func-tionCa(t) we used a scale-independent measure of the root-mean-square (RMS) error
RMSnorm=
1 N
N
i=1(Ca(ti)−b(ti))2 N
i=1(bdirect(ti)−b(ti))2 1
2
wherebdirect(t)is the direct fit of Equation 4 to the
blood-sampled input function b(t). The RMSnorm parameter
therefore represents the goodness-of-fit of the estimated input function to the blood-sampled data relative to the goodness-of-fit of a direct fit of Equation 4 to the blood-sampled data.
Errors on areas under the curve (AUC) of the estimated input functions were also calculated. The input functions were divided into an early region, characterized by a sharp peak in activity, and a tail during which tracer concen-trations in the blood and tissue gradually equilibrated. The boundary between the two regions was defined by the maximum value of the second derivative ofb(t), typ-ically around 6 min. The AUC error for each region was expressed as the modulus of the difference between the areas under the estimated and blood-sampled input func-tions, calculated as a percentage of the area under the blood-sampled input function.
Modelling of spillover
Spillover was incorporated into the models of the total regional activity using the geometric transfer matrix (GTM) method [10]. This approach assumes that the activity is distributed over a number of regions, each with homogeneous concentration of activity. The GTM relates a vector of the true concentrations in the regions at time pointtk,Ctrue(tk), to a vector of measured concentrations
Cmeas(tk), via
GCtrue(tk)=Cmeas(tk) (6)
where the elementsgijof the matrixGrepresent the con-tribution of the true activity in region i to the activity recorded in region j. The GTM is usually inverted to recover the true concentrations in the regions of interest:
Ctrue(tk)=G−1Cmeas(tk) (7)
The activity recorded in the layer of voxels surround-ing the arterial voxels, termed the external voxels, was significantly lower than the activity of the non-vascular tissue within the arterial voxels, termed the surround-ing tissue, particularly around the peak in arterial activity concentration, as illustrated by Additional file 1: Figure S1. Thus, three regions of interest were considered for the GTM method: the artery, the surrounding tissue and the external voxels. Anatomical information from the CT images was used to construct a high-resolution geomet-ric model of each region of interest. The activity in each specific region was sequentially set to 1, and all other regions were set to 0. For each regioni, this model was then convolved with a model of the point-spread function (PSF) of the PET scanner, and the intersection fraction of regioniwith each regionjwas calculated to generate the elementsgij.
The simultaneous estimation process aims to estimate the input function by fitting the model of Equation 1 to the total activity recorded in the delineated arterial vox-els, which is affected by spillover. Equation 6 was therefore used to simulate the effects of spillover on the ‘true’ esti-mated concentrations of the artery and surrounding tissue concentrations before matching the total activity of these regions,mtot(tk), to that of the imaged region, PETtot(tk). As the activity recorded in the arterial voxels also includes spill-out from the external voxels, the true concentration of activity in these voxels, Cext(tk), is required to calculate mtot(tk). Cext(tk) was estimated using Equation 7 to correct the activity measured in these voxels for spill-out from the arterial voxels. For this pur-pose, the activity in both the artery and surrounding tissue was set as the mean of the total activity in the arterial voxels. A vector of the estimated values of the arterial activity, surrounding tissue activity and the true activity in the external voxels was then multiplied byGto obtain a model ofmtot(tk)with simulation of spillover. Models ofmtot(tk)without simulation of spillover were also gen-erated to examine the importance of explicitly simulating the effects of spillover on the accuracy of the estimated input functions.
The effects of the reconstruction algorithm and associ-ated filters were modelled as a composite of two Gaussian functions fitted to the PSF of the PET scanner. This kernel was assumed to be stationary as all regions of interest lay within 5 cm of the centre of the transaxial field of view.
Statistical analysis
ANOVA was used to study the influence ofαon RMSnorm
Table 2 Metrics for agreement of simultaneously estimated and blood-sampled input functions with simulation of spillover
InitBSIF InitPET
Number of samples Number of samples
0 1 2 3 0 1 2 3
RMSnorm 3.9 2.0 (0.7) 1.1 (0.5) 1.2 2.9 2.0 (0.3) 1.1 (0.4) 1.1
Peak AUC (%) 40 27 (8) 16 (7) 11 41 25 (9) 17 (9) 13
Tail AUC (%) 87 34 (15) 19 (11) 12 108 32 (9) 21 (15) 15
Median (median interquartile range) of RMSnormvalues and errors of the area under the peak and tail of the estimated input function, as the moduli of the
percentages of the areas under the blood-sampled input function (calculated with simulation of spillover). Samples were taken at late times (one sample only), combinations of intermediate and late times (two samples), and an early, intermediate and late time (three samples).
splitting the sampling times into ‘early’ (0< t ≤ 2 min), ‘intermediate’ (2< t ≤ 8 min) and ‘late’ (8< t ≤60 min) intervals. The interquartile range describes the change in a metric with sampling time tk throughout an interval and also reflects the variability introduced by noise on the measured arterial tracer concentration.
TheFtest was used to compare residual errors for input functions generated using one versus two and two ver-sus three blood samples. The appropriate (combination of ) sampling times were identified as those times that resulted in the lowest median RMSnormvalues for all six
datasets. When two blood samples were used, median and interquartile ranges of RMSnormand AUC errors were
tab-ulated for the six possible combinations of early, interme-diate and late blood-sampling intervals, and ANOVA was used to assess differences in these metrics between dif-ferent combinations of sampling intervals. RMSnorm
dis-tributions of input functions generated with and without simulating spillover were also compared using ANOVA.
Results and discussion
Results
Simultaneous estimation of the arterial input function and surrounding tissue TAC
Table 2 summarises the metrics of agreement between the blood-sampled and estimated input functions when blood samples were taken at (combinations of ) times found to minimise RMSnormvalues. Good agreement was achieved
for all datasets (RMSnormvalues of 1.0 to 1.5, median value
1.1) when arterial concentrations measured at two time points were used in the estimation process, but inclusion of a third sample did not significantly improve agreement for five of the six datasets (onepvalue of 0.002, all other pvalues>0.35). However, the input functions estimated without using any arterial concentration measurements showed notably worse agreement with the blood-sampled input functions (median RMSnorm 2.9) and the use of
one measurement was not sufficient to achieve reasonable
agreement (median RMSnorm 2.0). The F tests showed
that inclusion of a second sample significantly improved the accuracy of five of the six estimated input functions
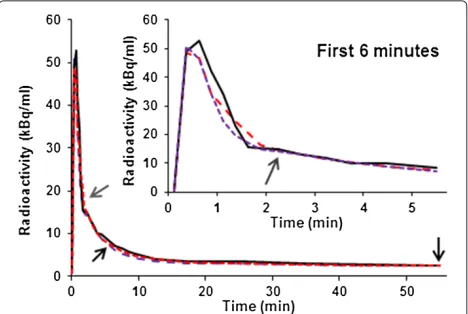
datasets (pvalues< 0.007). Figure 3 shows an example of input functions simultaneously estimated for one of the datasets using two and three concentration measure-ments and defaultαvalues ofN×1/8, 2/(2×7), 3/(3×6)
respectively (initial results showed no significant depen-dence of RMSnormonα; allpvalues≥0.35).
The accuracy of the input functions simultaneously estimated using zero or one arterial concentration mea-surements depends on the initial estimates of the model parameters; more accurate estimates were obtained by starting from InitBSIFthan InitPET. When only one arterial
concentration measurement was used in the simultane-ous estimation process, more accurate estimates of the input function were generally obtained using a measure-ment made in the late time interval (8< t ≤ 60 min). However, the use of one concentration measurement often improved the accuracy of the estimated input func-tion only in the vicinity of the time point for which the measurement was obtained, whilst the accuracy over other intervals was unchanged or even worsened.
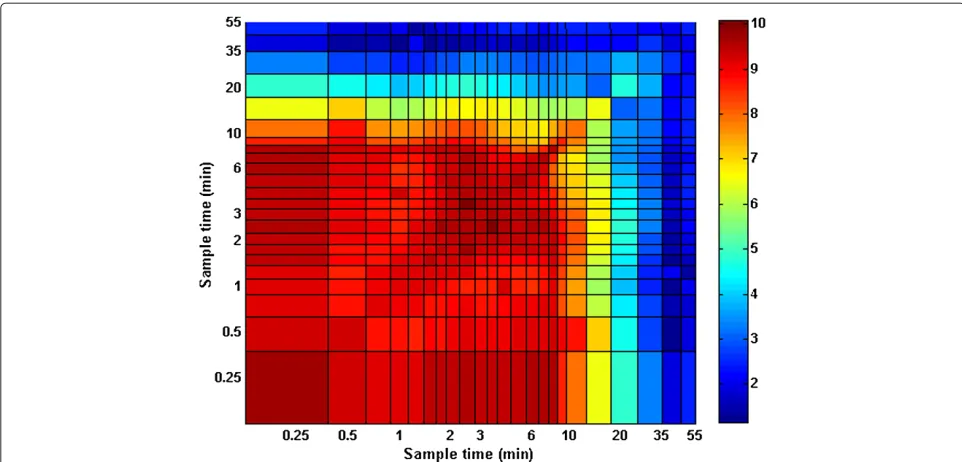
Figure 4Residual error of model as a function of sampling time.RMSnormvalue versus sampling timestkandtl. The InitPETvalues were used as
initial values for the estimation process (with simulation of spillover).
In contrast, the accuracy of input functions estimated using two or three arterial concentration measurements was independent of initial parameter values. The low-est RMSnorm values were obtained using combinations
of intermediate and late times of concentration mea-surement, as shown in Figure 4. Inclusion of the second concentration measurement taken in the intermediate interval improved the agreement between the blood-sampled and estimated input functions in the peak region without reducing the agreement in the tail region.
Spillover
For one, dataset, explicitly simulating spillover improved the agreement between input functions estimated with two blood samples (p value = 0.03), but distributions of RMSnorm values were not significantly different for
input functions estimated with and without spillover for the other five datasets. Metrics for agreement between
blood-sampled and simultaneously estimated input func-tions obtained without simulation of spillover are summa-rized in Table 3. The (combinations of ) sampling times are those used to generate the results presented in Table 2.
Discussion
It is clearly advantageous to generate input functions through non-invasive means, but the partial volume effect prevents direct extraction of accurate input functions from PET images. There is often a substantial tracer uptake in the tissue surrounding the arterial wall, and so any correction strategy for the PVE that ignores tracer uptake in the surrounding tissue is unlikely to accu-rately determine the input function. The method devel-oped here enables accurate and robust estimation of input functions using image data and two blood sam-ples. A one-compartment model that accounts for move-ment of the tracer to and from the artery is complex
Table 3 Metrics for agreement of simultaneously estimated and blood-sampled input functions without simulation of spillover
InitBSIF InitPET
Number of samples Number of samples
0 1 2 3 0 1 2 3
RMSnorm 3.5 2.0 (0.4) 1.3 (0.9) 1.1 4.2 2.4 (0.4) 1.1 (0.4) 1.2
Peak AUC (%) 31 40 (11) 16 (11) 11 43 37 (6) 26 (9) 14
Tail AUC (%) 58 38 (9) 11 (24) 14 104 54 (15) 18 (14) 15
Median (median interquartile range) of RMSnormvalues and errors of the area under the peak and tail of the estimated input function, as the moduli of the
enough to describe the tracer kinetics but does not include unnecessary parameters that might hinder the estima-tion process. The complete model of the input funcestima-tion and tissue kinetics has nine parameters, seven for the input function model and two for the kinetics param-eters, to be simultaneously estimated from the TAC of voxels that include the artery and two tracer concentra-tions obtained from blood samples taken at different time points.
When two arterial tracer concentration measurements, obtained at suitable times, are used in the simultane-ous estimation process, the accuracy of the estimated input function is independent of the initial values cho-sen for the model parameters. If only one blood sample is used, the accuracy of the estimated input function depends on the choice of initial values, and the blood sam-ple usually improves the accuracy of the estimated input function only around the time point at which the sam-ple was taken. A combination of blood samsam-ples taken at intermediate and late times reduces the median RMSnorm
values of the estimated input functions to only 10% greater than those obtained by directly fitting the input func-tion model (Equafunc-tion 4) to the arterial TACs obtained by continual blood sampling. Explicitly modelling the effects of spillover does not generally improve the accu-racy of the input functions estimated using the proposed method.
The model described here works well for FLT PET head-and-neck images, from which TACs can be obtained for regions containing the carotid artery. However, it may not be appropriate for other tracers and/or imaged regions [12,21] for which the kinetics of tracer transport may dif-fer. The process of model validation and selection, and exploration of the influence of direct measurements of blood concentrations on the accuracy of the estimated input functions, should be repeated for other radiotracers and imaging sites.
Conclusions
Accurate descriptions of arterial input functions, deliv-ered by bolus injection, can be obtained for FLT-PET through simultaneous estimation using a one-compartment model of tracer movement to and from the artery and two blood samples, taken at intermediate (2< t≤8 min) and late (8<t≤60 min) times.
Additional file
Additional file 1: Figure S1: Imaged activity of surrounding tissue
and external voxels.The activity in the surrounding tissue (solid black
line) was determined at each time point by subtracting the blood-sampled input function, weighted by the fractional volume of the carotid artery in the arterial voxels, from the average imaged activity of these voxels (dashed black line). The average activity of the external voxels at each time
point (solid blue line) was also measured from the images. The ‘true’ activity of the external voxels was estimated by substituting the averaged imaged activity of the arterial voxels as the activity of both the artery and surrounding tissue.
Abbreviations
AICc: Akaike information criterion (corrected for small sample size); ANOVA: Analysis of variance; AUC: Area under the curve; CT: Computed tomography; FDG:18F-fluoro-deoxy-D-glucose; FLT: 3-deoxy-3-[18F]fluoro-thymidine; FWHM: Full-width half-maximum; FWTM: Full-width tenth-maximum; GTM: Geometric transfer matrix; PET: Positron emission tomography; PSF: Point-spread function; PVE: Partial volume effect; RMS: Root mean square; TAC: Time-activity curve.
Competing interests
The authors declare that they have no competing interests.
Authors’ contributions
JDF, DLa and PM conceived the study design. SLH and DLi performed the data analysis. PM and AC collected and processed imaging and blood sample data. SLH and JDF drafted the manuscript. All authors read and approved the final manuscript.
Acknowledgements
JDF is supported by Cancer Research UK Career Development Fellowship C17203.
Author details
1Gray Institute for Radiation Oncology and Biology, Department of Oncology, University of Oxford, Oxford OX3 7DQ, UK.2PET Imaging Centre, Guys and St Thomas’ Hospital, King’s College London, London SE1 7EH, UK.3Department of Oncology, Guys and St Thomas’ Hospital, King’s College London, London SE1 7EH, UK.
Received: 26 September 2013 Accepted: 16 December 2013 Published: 27 December 2013
References
1. Weber WA:Use of PET for monitoring cancer therapy and for
predicting outcome.J Nucl Med2005,46(6):983–995.
2. Shields AF, Grierson JR, Dohmen BM, Machulla HJ, Stayanoff JC, Lawhorn-Crews JM, Obradovich JE, Muzik O, Mangner TJ:Imaging proliferation in vivo with [F-18]FLT and positron emission
tomography.Nat Med1998,4(11):1334–1336.
3. Barthel H, Cleij MC, Collingridge DR, Hutchinson OC, Osman S, He Q, Luthra SK, Brady F, Price PM, Aboagye EO:
3-deoxy-3-[18F]fluorothymidine as a new marker for monitoring
tumor response to antiproliferative therapy in vivo with positron
emission tomography.Cancer Res2003,63(13):3791–3798.
4. Jacobs AH, Thomas A, Kracht LW, Li H, Dittmar C, Garlip G, Galldiks N, Klein JC, Sobesky J, Hilker R, Vollmar S, Herholz K, Wienhard K, Heiss WD:
18F-fluoro-L-thymidine and 11C-methylmethionine as markers of
increased transport and proliferation in brain tumors.J Nucl Med
2005,46(12):1948–1958.
5. Hall R:Vascular injuries resulting from arterial puncture of
catheterization.Br J Surg1971,58(7):513–516.
6. Wahl LM, Asselin MC, Nahmias C:Regions of interest in the venous
sinuses as input functions for quantitative PET.J Nucl Med1999,
40(10):1666–1675.
7. van der Weerdt AP, Klein LJ, Boellaard R, Visser CA, Visser FC, Lammertsma
AA:Image-derived input functions for determination of MRGlu in
cardiac (18)F-FDG PET scans.J Nucl Med2001,42(11):1622–1629.
8. Soret M, Bacharach SL, Buvat I:Partial-volume effect in PET tumor
imaging.J Nucl Med2007,48(6):932–945.
9. Krejza J, Arkuszewski M, Kasner SE, Weigele J, Ustymowicz A, Hurst RW, Cucchiara BL, Messe SR:Carotid artery diameter in men and women
and the relation to body and neck size.Stroke2006,37(4):1103–1105.
10. Rousset OG, Ma Y, Evans AC:Correction for partial volume effects in
11. Chen CH, Muzic RJr, Nelson AD, Adler LP:Simultaneous recovery of size and radioactivity concentration of small spheroids with PET data. J Nucl Med1999,40:118–130.
12. Mourik JEM, Lubberink M, Klumpers UMH, Comans EF, Lammertsma AA, Boellaard R:Partial volume corrected image derived input functions for dynamic PET brain studies: methodology and validation for
[11C]flumazenil.Neuroimage2008,39(3):1041–1050.
13. Wong KP, Feng D, Meikle SR, Fulham MJ:Simultaneous estimation of
physiological parameters and the input function—in vivoPET data.
IEEE Trans Inf Technol Biomed2001,5:67–76.
14. Naganawa M, Kimura Y, Ishii K, Oda K, Ishiwata K, Matani A:Extraction of a plasma time-activity curve from dynamic brain PET images based
on independent component analysis.IEEE Trans Biomed Eng2005,
52(2):201–210.
15. Fang YHD, Muzic RFJr:Spillover and partial-volume correction for image-derived input functions for small-animal 18F-FDG PET
studies.J Nucl Med2008,49(4):606–614.
16. Backes H, Ullrich R, Neumaier B, Kracht L, Wienhard K, Jacobs AH: Noninvasive quantification of 18F-FLT human brain PET for the assessment of tumour proliferation in patients with high-grade
glioma.Eur J Nucl Med Mol Imaging2009,36(12):1960–1967.
17. Thorwarth D, Eschmann SM, Scheiderbauer J, Paulsen F, Alber M:Kinetic analysis of dynamic 18F-fluoromisonidazole PET correlates with
radiation treatment outcome in head-and-neck cancer.BMC Cancer
2005,5:152.
18. Boellaard R, van Lingen A, Lammertsma AA:Experimental and clinical evaluation of iterative reconstruction (OSEM) in dynamic PET:
quantitative characteristics and effects on kinetic modeling.J Nucl
Med2001,42(5):808–817.
19. Liu D, Chalkidou A, Landau DB, Marsden PK, Fenwick JD:18F-FLT uptake kinetic in head and neck squamous cell carcinoma: a PET imaging
study.Med Phys2013, in press.
20. Feng D, Huang SC, Wang X:Models for computer simulation studies of input functions for tracer kinetic modeling with positron
emission tomography.Int J Biomed Comput1993,32(2):95–110.
21. Zanotti-Fregonara P, Liow JS, Fujita M, Dusch E, Zoghbi SS, Luong E, Boellaard R, Pike VW, Comtat C, Innis RB:Image-derived input function for human brain using high resolution PET imaging with
[C](R)-rolipram and [C]PBR28.PLoS One2011,6(2):e17056.
doi:10.1186/2191-219X-3-84
Cite this article as:Hackett et al.: Estimation of input functions from dynamic [18F]FLT PET studies of the head and neck with correction for
partial volume effects.EJNMMI Research20133:84.
Submit your manuscript to a
journal and benefi t from:
7Convenient online submission
7Rigorous peer review
7Immediate publication on acceptance
7Open access: articles freely available online
7High visibility within the fi eld
7Retaining the copyright to your article