Can bottom-up processes of attention be a source of "interference" in situations where top-down control of attention is crucial?
Dritan Nikolla1, Graham Edgar1, Dianne Catherwood1 and Tristan Matthews2
1University of Gloucestershire 2Queen Mary’s, University of London
Abstract
1. Introduction
Few studies have looked into this interference directly. Wilson, de Joux, Finkbeiner, Russell, & Helton (2016) assessed the impact of anxiety-provoking stimuli on the Sustained Attention to Response Task (SART; Robertson, Manly, Andrade, Baddeley, & Yiend, 1997). Using task-irrelevant negative and positive images which were interleaved with SART they found that negative images had a slowing effect on performance. Similarly, Ossowski, Malinen, & Helton (2011) found that irrelevant negative images, but not neutral images, reduced performance in a vigilance task; a finding also replicated by Helton & Russell (2011). Hartikainen, Ogawa, Soltani, & Knight (2007) used a visual-discrimination task and found that unpleasant task-irrelevant stimuli interfered more with the left visual field attention capacity.
Other studies, however, have reported conflicting results. Robinson, Krimsky, & Grillon (2013) found that the threat of shock significantly reduces errors of commission on the no-go SART trials relative to the safe condition, suggesting that the negative emotional condition facilitated by threat can actually improve performance, especially when that performance relies on inhibition. This finding was replicated by Wilson, Russell, & Helton (2015), who also suggested that anxiety provoking stimuli can have positive effects on some aspects of cognition, such us inhibition.
Furthermore, the top-down and bottom-up attentional systems have been associated with the activity of specific neuronal structures in the visual cortex, with area V1 only responding to bottom-up, saliency information, area V2 responding to top-down modulations and area hv4 facilitating the convergence between the two attentional systems (Melloni, Van Leeuwen, Alink, & Müller, 2012). Other areas of the brain, such as the fronto-parietal network, have also been identified as essential in facilitating the activity of both types of attentional processes (Katsuki & Constantinidis, 2014). The involvement of the early visual cortex (areas V1, V2 and hv4) and fronto-parietal networks in the integration between bottom-up and top-down attentional controls suggests that both systems are active and interact with each other from early on in the processing of sensory information.
To summarise, research evidence suggests that the presence of task-irrelevant negative emotional stimuli can interfere with the activity of top-down attentional processes. While negative emotional stimuli can engage bottom-up attentional processes, it is not clear whether positive emotional stimuli have the same effect. If they do, it is not clear whether the process of interference will be similar to that of negative emotional stimuli, or of similar intensity.
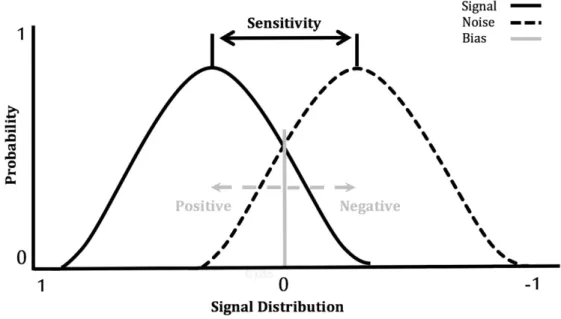
Figure 1.Theoretical overlapping distributions of the internal representational strengths for true (signal;
shown as a solid curve) and false (noise; shown as a broken curve) items of information. The Bias is
represented by the grey vertical line with arrows showing that Bias can move left and become more
positive or right and become more negative. If Bias moves in the positive direction, less of the true
information will filter through, but also less false information. Conversely, if Bias moves in the negative
direction, more of the true information will filter through, but also more false information.
effect from bottom-up attentional systems. In this case we expect the Bias to move towards the negative end of the scale.
The task we developed for this study is loosely based on that used by Edgar, Edgar, & Curry (2003). It consists of a scripted war-fighting scenario with the participant viewing the scene from the vantage point of one of the combatants. Participants respond with either true or false to 48 statements presented about the war-fighting scenario. Separating true from false statements accurately is the Sensitivity part and the tendency to report true or false independent of the actual truth or falseness of the item is Bias. The emotional stimuli consist of negative and positive emotional images selected from the International Affective Picture System (Lang, Bradley, & Cuthbert, 2005).
2. Methods 2.1 Participants.
30 participants were randomly selected (opportunity sampling) from psychology undergraduate students at the University of Gloucestershire. Participants were randomly allocated into two groups of 15 participants, and each group participated in one emotional condition: positive (mean age = 24.60 SD = 3.48, 4 female); negative (mean age = 23.33, SD = 3.62, 3 female).
2.2 Materials 2.2.1 IAPS Images.
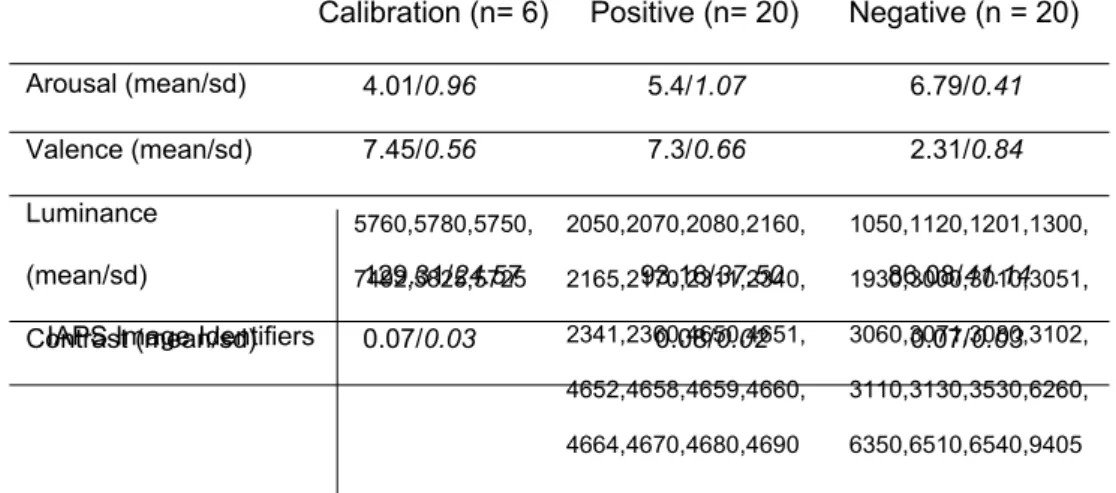
Forty colour pictures were selected from the IAPS dataset (Center for the Study of Emotion and Attention, 1999), consisting of twenty positive and twenty negative pictures based on valence (a bipolar continuum with negative and positive poles measured as hedonic distance from neutral) and arousal (a continuous axis increasing from low to highly arousing). Both sets were selected to be the most polarised exemplars in their respective subcategories. A further six images were selected which were used to standardise picture processing for all participants prior to starting the main task (emotional calibration set) and depicted various landscapes (Table 1). The size of stimuli is 768 x 1024 pixels for all images.
All images were processed for luminance and contrast information using MATLAB script (rgb2gray function for extracting luminance values (rgb2gray, 2016) and mean2 function for extracting contrast values (mean2, 2016)). Two independent-samples t-tests were conducted to compare mean luminance and contrast values in positive and negative image sets. There was no significant difference in the luminance values for Positive (M=93.16, SD=37.5), and Negative (M=86.08, SD=41.14), t(38) = 0.57, p = 0.57 image sets; and no significant differences in contrast value for Positive (M=0.08, SD=0.02) and Negative (M=0.07, SD=0.03), t(38) = 0.77, p = 0.45 image sets.
in the IAPS image sets are over-represented in the high arousal/positive and high arousal/negative areas of affective space as compared to inanimate pictures. Therefore, only images with human or animal content were selected. The images in the positive set were selected from the following categories: Babies, Father, Mother, Family, Children and Erotic Couples. The images in the negative set were selected from the following categories: Snake, Spider, PitBull, Shark, Mutilations, Burn Victim, Attack, Aimed Gun, Sliced Hand. As expected, the valences of the image sets are significantly different, measured on the IAPS scale from 1 (highly unpleasant) to 9 (highly pleasant). An independent-samples t-test was conducted to compare normative arousal scores for negative and positive emotional conditions. There was a significant difference in the scores for positive (M = 5.44, SD = 1.07) and negative (M = 6.79, SD=0.41) conditions; t (38) = -5.26, p < 0.05. These results suggest that arousal overall was higher for negative images.
Table 1. Details of the image sets used. Mean and standard deviation (sd) for arousal, valence, luminance and
contrast are given for Calibration, Positive and Negative sets. Luminance can take values in the range [0,255].
Contrast is calculated as Root Mean Square. Finally, identifier numbers for each IAPS image are given in the bottom
row.
Calibration (n= 6) Positive (n= 20) Negative (n = 20)
Arousal (mean/sd) 4.01/0.96 5.4/1.07 6.79/0.41
Valence (mean/sd) 7.45/0.56 7.3/0.66 2.31/0.84
Luminance
(mean/sd) 129.31/24.57 93.16/37.50 86.08/41.14
Contrast (mean/sd)IAPS Image Identifiers 0.07/0.03 0.08/0.02 0.07/0.03 5760,5780,5750,
7492,5825,5725
2050,2070,2080,2160,
2165,2170,2311,2340,
2341,2360,4650,4651,
4652,4658,4659,4660,
4664,4670,4680,4690
1050,1120,1201,1300,
1930,3000,3010,3051,
3060,3071,3080,3102,
3110,3130,3530,6260,
2.2.2 State Anxiety Inventory
To directly gauge the arousal effect that the emotional stimuli had on participants, we used the State Anxiety Inventory (SAI) subset of the Spielberger’s State/Trait Anxiety Inventory (Spielberger, 1989). SAI was administered before and after the completion of the task.
2.2.3. Quantitative Analysis of Situation Awareness (QASA).
Due to the issues with d' and ß, QASA applies signal detection measures widely-used in studies of recognition memory (e.g. Donaldson, 1996); namely A' (Pollack & Norman, 1964) as a measure of sensitivity and B'' as a measure of bias. A' makes fewer assumptions concerning the sampling distribution than d', tends to be relatively more robust when sample sizes are small (Verde et al., 2006).
A' and B'' were calculated using formulae described by Stanislaw and Todorov (1999):
A'=0.5+
(
sign(H−F) (H−F)2
+
|
H−F|4max(H , F)−4HF
)
,B' '=sign(H−F)H(1−H)−F(1−F)
H(1−H)+F(1−F) ,
where H = ‘Hit’ rate; F = ‘False alarm’ rate and max(H,F) = Either H or F, whichever is greater.
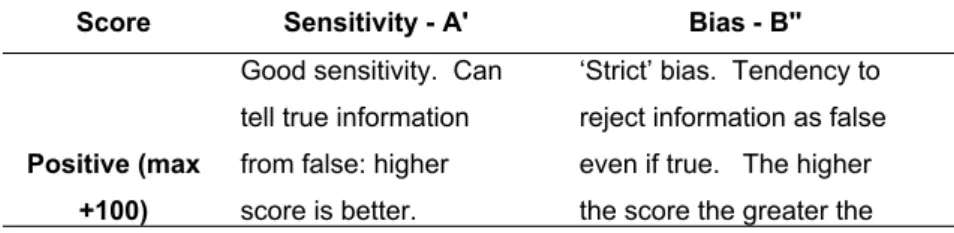
A' will be in the range 0 to 1 (with 0.5 indicating an inability to tell true from false information) and B'' will be in the range -1 to +1. For ease of plotting and interpretation the QASA tool rescales both measures to a scale running from -100 to +-100. Following rescaling, the zero points correspond to an A' of 0.5 and a B'' of zero. The resultant scores and interpretations are given in Table 2.
Table 2. Interpretations of the sensitivity and bias scores provided by the QASA tool.
Score Sensitivity - A' Bias - B''
Positive (max +100)
Good sensitivity. Can tell true information from false: higher score is better.
tendency to reject information as false.
Zero No SA – guessing?
No bias towards accepting or rejecting information. A ‘neutral’ attitude.
Negative (max -100)
Misguided. Believes false information is true and vice versa.
More negative is worse.
‘Lax’ bias. Tendency to accept information as true even if false. The more negative the score the greater the tendency to accept information.
One feature of signal detection theory generally, and the QASA approach particularly, is that it is possible to have a negative sensitivity score. This suggests that either the participant has completely misunderstood the
instructions for the task, or that their awareness of the situation they are in is wrong. That is, it is not that they have no awareness of the situation – they have an incorrect awareness and this may, in turn, underpin serious performance errors such as friendly fire (Edgar & Edgar, 2007).
position of the criterion point with respect to the underlying distributions. If either the criterion point or the underlying distributions change, the amount of information accepted/rejected will also change. In a simulation of a real-world task, such as that assessed in this study, we believe that it is of greater utility to know how much information is accepted/rejected (bias), rather than the position of the criterion point.
There is one caveat: when the hit rate (HR) equals the false alarm(FA) rate (chance performance), the calculated criterion (c) for different hit/false alarm pairs will scale but B’’ will not. That is, apparent changes in B’’ may reflect changes in sensitivity rather than bias. To control for this eventuality, we will use a dual approach: 1) screen the data for participants that have equal HR and FA scores and 2) for any reported significant difference of B’’ across conditions, the difference in the criterion point, which is independent from sensitivity, will also be considered. If the criterion values are also statistically different, then the difference in bias between the groups is unlikely to be an artefact of a difference in sensitivity between the groups.
2.2.4 The Task
were interleaved with the scenario at pseudo-random intervals of 8-13 slides. Each image stayed on screen for 1s, presented at 100ms intervals.
2.2.5 Computer Equipment.
The task was administered through a computer screen using e-prime software (e-prime version 2.0, running on a Dell PC, using Microsoft Windows XP with Service Pack 2).
2.3 Procedure
2.3.1 Emotional Inducing Procedure
All participants completed their group-specific task in the following order:
1) Before starting the task, participants were given a full verbal description and asked to sign a consent form. They then completed a computerised version of SAI.
2) Participants were then presented with the six Calibration images for 10s each at 500ms intervals. This was the same for negative and positive emotional conditions. After this, participants were presented with twenty images – negative and positive according to the assigned group. Each image stayed on screen for 2s, presented at 500ms intervals.
2.3.2 Main experimental task
fighting. The images coming from the battlefield are jumpy and blurred because of a bad connection. The enemy is trying to interfere with, or break, the connection, which is why sometimes you might see images that are not from the original camera. Your task is to monitor the camera images from the soldier and gather as much information about the situation as you can. Military Headquarters will at times ask you to confirm or deny information. “
4) The task started and participants were required to monitor the scenario. 5) At six points the scenario was interrupted and eight QASA probes were presented to participants – 48 probes in total. 24 of the 48 probes were false (signal absent) and the ratio of false to true probes was 50/50. In each of the six blocks of statements there were 4 statements that were true and the remaining 4 that were false. Each QASA probe showed a content relevant photo followed by a true or false statement presented on the screen. Example statements are: ‘There is a burnt tank behind you’, ‘One of your team has been killed’. Participants were required to verify the veracity of the statements by surveying the developing ‘scenario’. A typical false statement would be “One of your team mates was wounded or killed” when no such event had happened.
Participants responded by pressing true or false via the keyboard: left arrow key for False, right arrow key for True – there was no time limit for responding. Participants were not informed about the likelihood of encountering true versus false statements but they were made aware that the information they were required to report to the Military Headquarters could be denied (see the last sentence on the text to frame the scenario – point 3 above).
3. Results 3.1 Control Measures
A mixed-groups factorial ANOVA with pre- and post-test state anxiety scores as the within subject factor and positive and negative conditions as the between subjects factor (alpha = 0.05) was performed to examine the effects of positive and negative image sets in participants’ state anxiety. Space spaces space There was an interaction between pre- and post-test scores and positive and negative emotional conditions F(24.96)= 576, MSE= 23.1, p < 0.001. Table 3 shows the means and variance for positive and negative conditions for pre- and post-test anxiety scores. As expected, the negative images set led to an increase in state anxiety from pre- to post-test and the reverse was observed for the positive images.
Table 3.Means for anxiety scores. Mean normative and standard deviation (sd) scores are given for
positive and negative conditions, before and after the task completion. The scores show that emotional
stimuli increased anxiety for the negative condition (by around 9 points) and decreasing it for the
positive condition (by about 4 points). Also, it can be seen that participants’ anxiety scores are close to
even before the task starts.
Anxiety
Pre-Test Post- Test Average
Condition Positive (mean/sd) 50.2/6.92 46.8/7.32 48.4
Negative (mean/sd) 51.13/9.36 60.13/8.45 55.63
Average 50.67 53.47
The mean Sensitivity and Bias scores for the two affect-conditions are shown in Figure 2. Using Boxplots, one outlier was detected in the negative condition. The outlier was replaced with the value closest to the outlier, which is a method known as “Winsorizing” (Tukey, 1962). An independent-samples t-test was conducted to compare Sensitivity for negative and positive emotional conditions. There was a significant effect of emotional condition on Sensitivity scores for positive (M = 48.75, SD = 21.23) and negative emotional conditions (M = 11.59, SD = 28.40) conditions; t(28) = 4.06, p < 0.001. These results suggest that emotional condition does have an effect on Sensitivity. Specifically, our results suggest that positive emotional condition leads to significant improvements on Sensitivity scores when compared to negative emotional condition.
Sensitivity Bias -30 -20 -10 0 10 20 30 40 50 60 48.75 -20.27 11.59 10.33 R e sc a le d S D T S co re s
Positive Affect Negative Affect
Fig
ure 2. The mean Sensitivity and Bias scores for the two emotional conditions. Error bars set at 95%
confidence interval. Scores are rescaled from standard SDT scores so that they run from -100 to +100.
For Sensitivity, -100 means participants consistently classify information incorrectly, 0 means they
perform at chance, and +100 means they consistently classify information correctly. For Bias, -100
means participants accept all information as true (whether it is actually true or not), 0 means they have
no bias towards accepting or rejecting information, and +100 means they reject all information as false.
Mean differences on the measures of Sensitivity are significantly different between positive and negative
emotional conditions. Mean differences on the measures of Bias are also significantly different between
positive and negative emotional conditions.
To examine the relationship between Bias and Sensitivity, the Sensitivity scores were plotted against the Bias scores for each affect condition (Figure 3). A least-squares procedure was used to fit curves to the data, with a quadratic function providing the best fit. The model was a significant fit of the data in the negative (R2 = 0.48; F(2,12) = 5.60, p = 0.02) and positive (R2 = 0.78; F(2,12) = 21.23, p =
Figure 3.Emotional Conditions and Correlation of Sensitivity and Bias. Sensitivity scores plotted against
Bias scores for the positive and negative emotional conditions. Linear (solid line) and quadratic (broken
line) least-squares line fits are shown. Mean 95% confidence intervals are shown for the quadratic fits.
4. Discussion
The self-reported scores of anxiety using the SAI inventory were elevated after the negative condition, whereas they were reduced after the positive condition. High arousal in itself, however, cannot explain the reduced performance in the negative condition. On the contrary, increased arousal has often been linked with an increase in resource capacity (Matthews et al., 2010) and is positively correlated with performance (Helton et al., 2009). A recent study found support for the view that arousal quality of picture stimuli matters more for performance than valence, concluding that increased arousal may result in improved performance regardless of their increased disruptive effect (Flood, Näswall & Helton 20015). Hence, looking at the arousal scores alone, we would expect improved performance in the negative and decreased performance in the positive condition. We argue, therefore, that the reduced performance effects found here in the negative condition are due to its effects on the bottom-up processes of attention and the interference with the top-down attentional processes, rather than emotionally-induced arousal levels.
exploratory behaviour. In a wide ranging review Isen (2001) concludes that in “most circumstances, positive affect enhances problem solving and decision making, leading to cognitive processing that is not only flexible, innovative, and creative, but also thorough and efficient”. The improved performance in the positive condition suggest that the top-down control of attention by a distributed fronto-parietal network that acts upon early representations in sensory cortex may actually benefit from modulation by task-irrelevant positive emotional stimuli.
A further finding in this study has been the differing relationship between Bias and Sensitivity in different emotional states. The plot of the negative emotional condition displays a pronounced C-shaped relationship (Figure 3), indicating that high positive Bias is associated with very good or very poor Sensitivity. This suggests that a positive Bias could lead to good Sensitivity if the right information is focused on, but focusing on the wrong information would produce very poor Sensitivity.
The present study also has practical implications. In some jobs people are required to synthesise information while simultaneously being exposed to irrelevant negative emotional stimuli, for example during search and rescue operations in war zones or during humanitarian interventions in natural disasters. Our findings suggest that their performance may suffer because of exposure to highly negative emotional stimuli. As such, the logical conclusion that our study leads to is that people who are less sensitive to exposure to emotionally negative stimuli will perform better in such situations. A future study taking into account individual differences to emotional sensitivity may look more directly into this possibility. Finally, there are recent reports that neurofeedback training can help mitigate some of the negative effects of negative emotional stimuli (Bruhl et al., 2014). Such training methods could be considered when the deployment of people in risky situations is warranted. Such training may help mitigate some of the unwanted effects of negative emotional stimuli. Other researchers have made similar suggestions for mindfulness training (Ossowski et al., 2011).
This project was part-funded by the UK Ministry of Defense, ‘Competition of Ideas’ (Project number B1353).
Bruhl, A. B., Scherpiet, S., Sulzer, J., Stampfli, P., Seifritz, E., & Herwig, U. (2014). Real-time neurofeedback using functional MRI could improve down-regulation of amygdala activity during emotional stimulation: A proof-of-concept study. Brain Topography, 27(1), 138–148.
http://doi.org/10.1007/s10548-013-0331-9
Carrasco, M. (2011). Visual attention: the past 25 years. Vision Research, 51(13), 1484–525. http://doi.org/10.1016/j.visres.2011.04.012
Colden, A., Bruder, M., & Manstead, A. S. R. (2008). Human content in affect-inducing stimuli: A secondary analysis of the international affective picture system. Motivation and Emotion, 32(4), 260–269.
http://doi.org/10.1007/s11031-008-9107-z
Corbetta, M., & Shulman, G. L. (2002). Control of goal-directed and stimulus-driven attention in the brain. Nature Reviews Neuroscience, 3, 201–215. http://doi.org/10.1038/nrn755
Desimone, R., & Duncan, J. (1995). Neural mechanisms of selective visual attention. Annual Review of Neuroscience, 18, 193–222.
http://doi.org/10.1146/annurev.ne.18.030195.001205
Edgar, G. K., & Edgar, H. E. (2007). Using signal detection theory to measure situation awareness: the technique, the tool (QUASA), the test, the way forward. Ashgate.
Edgar, G. K., Edgar, H. E., & Curry, M. B. (2003). Using Signal Detection Theory to Measure Situation Awareness in Command and Control. In Proceedings of the Human Factors and Ergonomics Society 47th Annual Meeting2003 (pp. 2019–2023).
Flood, G., Naswall, K., & Helton, W. S. (2015). The effects of emotional stimuli on visuo- spatial vigilance. Psychological Research, 79, 861–871.
doi:10.1007/s00426-014-0609-x.
Green, D. G., & Swets, J. (1966). Signal detection theory and psychophysics. Society, 1, 521. http://doi.org/10.1901/jeab.1969.12-475
Grier, J.B (1971). Nonparametric indexes for sensitivity and bias: computing formulas. Psychol Bull., 75, 424–429.
Hartikainen, K. M., Ogawa, K. H., Soltani, M., & Knight, R. T. (2007). Emotionally arousing stimuli compete for attention with left hemispace. Neuroreport, 18(18), 1929–1933. http://doi.org/10.1097/WNR.0b013e3282f1ca18 Helton, W. S., Kern, R. P., & Walker, D. R. (2009). Conscious thought and the
sustained attention to response task. Consciousness and Cognition, 18(3), 600–607. http://doi.org/10.1016/j.concog.2009.06.002
Helton, W. S., & Russell, P. N. (2011). The Effects of Arousing Negative and Neutral Picture Stimuli on Target Detection in a Vigilance Task. Human Factors: The Journal of the Human Factors and Ergonomics Society, 53(2), 132–141. http://doi.org/10.1177/0018720811401385
Isen, A. M. (2001). An Influence of Positive Affect on Decision Making in Complex Situations: Theoretical Issues With Practical Implications. Journal of
Consumer Psychology, 11(2), 75–85.
http://doi.org/10.1207/S15327663JCP1102_01
Kastner, S., & Ungerleider, L. G. (2000). Mechanisms of visual attention in the human cortex. Annual Reviews in Neuroscience, 23, 315–341. http://doi.org/ 10.1146/annurev.neuro.23.1.315
Different Processes and Overlapping Neural Systems. The Neuroscientist, 20(5), 509–521. http://doi.org/10.1177/1073858413514136
Kern, R. P., Libkuman, T. M., Otani, H., & Holmes, K. (2005). Emotional stimuli, divided attention, and memory. Emotion (Washington, D.C.), 5(4), 408–417. http://doi.org/10.1037/1528-3542.5.4.408
Lang, P., Bradley, M., & Cuthbert, B. (2005). International Affective Picture System (IAPS): Digitized Photographs, Instruction Manual and Affective Ratings. Technical Report A-6. 2005.
Matthews, G., Warm, J. S., Reinerman-Jones, L. E., Langheim, L. K., Washburn, D., & Tripp, L. (2010). Task engagement, cerebral blood flow velocity, and
diagnostic monitoring for sustained attention. Journal of Experimental Psychology. Applied, 16(2), 187–203. http://doi.org/10.1037/a0019572 Maunsell, J. H. R., & Treue, S. (2006). Feature-based attention in visual cortex.
Trends in Neurosciences, 29(6), 317–322. http://doi.org/10.1016/j.tins.2006.04.001
McMains, S., & Kastner, S. (2011). Interactions of top-down and bottom-up mechanisms in human visual cortex. Journal of Neuroscience, 31(2), 587– 597. http://doi.org/10.1523/JNEUROSCI.3766-10.2011
Melloni, L., Van Leeuwen, S., Alink, A., & Müller, N. G. (2012). Interaction between bottom-up saliency and top-down control: How saliency maps are created in the human brain. Cerebral Cortex, 22(12), 2943–2952.
http://doi.org/10.1093/cercor/bhr384
Öhman, A., Flynkt, A., & Lyndqvist, D. (2000). Unconscious emotion: Evolutionary perspectives, psychophysiological data and neuropsychological
mechanisms. The Cognitive Neuroscience of Emotion, 1, 296–327.
Ohman, A., & Mineka, S. (2001). Fears, phobias, and preparedness: toward an evolved module of fear and fear learning. Psychological Review, 108(3), 483– 522. http://doi.org/10.1037/0033-295X.108.3.483
Ossowski, U., Malinen, S., & Helton, W. S. (2011). The effects of emotional stimuli on target detection: Indirect and direct resource costs. Consciousness and Cognition, 20(4), 1649–1658. http://doi.org/10.1016/j.concog.2011.08.015 Patton, D. (2014). How real is good enough? Assessing realism of presence in
simulations and its effects on decision making. In Lecture Notes in Computer Science (including subseries Lecture Notes in Artificial Intelligence and
Lecture Notes in Bioinformatics) (Vol. 8534 LNAI, pp. 245–256). http://doi.org/10.1007/978-3-319-07527-3_23
Pinto, Y., van der Leij, A. R., Sligte, I. G., Lamme, V. A. F., Scholte, H. S., J., B. B., … Y., Y. (2013). Bottom-up and top-down attention are independent. Journal of Vision, 13(3), 16–16. http://doi.org/10.1167/13.3.16
Robertson, I. H., Manly, T., Andrade, J., Baddeley, B. T., & Yiend, J. (1997). ‘Oops!’: Performance correlates of everyday attentional failures in traumatic brain injured and normal subjects. Neuropsychologia, 35(6), 747–758.
http://doi.org/10.1016/S0028-3932(97)00015-8
Robinson, O. J., Krimsky, M., & Grillon, C. (2013). The impact of induced anxiety on response inhibition. Frontiers in Human Neuroscience, 7, 69.
http://doi.org/10.3389/fnhum.2013.00069
439. http://doi.org/10.1111/j.0956-7976.2005.01553.x
Stanislaw, H., & Todorov, N. (1999). Calculation of signal detection theory measures. Behavior Research Methods, Instruments, & Computers, 31, 137– 149. doi:10.3758/BF03207704
Szameitat, A. J., Vanloo, A., & Müller, H. J. (2016). Central as well as Peripheral Attentional Bottlenecks in Dual-Task Performance Activate Lateral Prefrontal Cortices. Frontiers in Human Neuroscience, 10, 119. http://doi.org/10.3389/fnhum.2016.00119
Tukey, J. W. (1962). The Future of Data Analysis. Annals of Mathematical Statistics. 33 (1): 1–67, p. 18., JSTOR 2237638
Wilson, K. M., de Joux, N. R., Finkbeiner, K. M., Russell, P. N., & Helton, W. S. (2016). The effect of task-relevant and irrelevant anxiety-provoking stimuli on response inhibition. Consciousness and Cognition, 42, 358–365.
http://doi.org/10.1016/j.concog.2016.04.011