Evaluation of droplet deposition and effect of variable-rate application by
a manned helicopter with AG-NAV Guí
a system
Weixiang Yao
1,2,
Yubin Lan
1,2*,
Sheng Wen
2,
Huihui Zhang
3,
Yali Zhang
1,2,
Juan Wang
1,2,4,
Chunchun Xie
5(1. College of Engineering, South China Agricultural University, Guangzhou 510642, China; 2. National Center for International Collaboration Research on Precision Agricultural Aviation Pesticides Spraying Technology (NPAAC), Guangzhou 510642, China; 3. USDA-Agricultural Research Service, Fort Collins, CO 80526, USA; 4. Mechanical and Electrical Engineering College, Hainan
University, Haikou 570228, China; 5. Shandong Ruida Pest Prerention & Control Co., Ltd, Jinan 250101, China)
Abstract: The variable-rate application is an important aspect of precision agriculture. In order to determine the regular patterns of droplet deposition and compare the actual variable-rate spraying effect of the AS350B3e helicopter with the AG-NAV Guía system, spray tests were conducted with different operating parameters and operating methods. In this study, the deposition distribution of droplets in the effective swath area was evaluated for six single-pass applications at four different flight velocities. The effects of adding adjuvant on droplet deposition, drift and droplet size were compared, and the actual variable effect of the forth-back application was verified. The analysis results showed that the position of the effective swath area was affected by natural wind velocity and wind direction, and would shift to the downwind direction area from the helicopter route of a different degree. The effective swath width increased slowly and then decreased sharply with the increase of flight velocity. It was found that flight velocity of 100 km/h was the peak inflection point of effective spray width variation. Moreover, the effect of flight velocity on the distribution uniformity of droplet deposition in the effective swath area was not significant. In the single-pass application of 90 km/h, adding adjuvant could increase droplet size in the effective swath area. The deposition increased by 8.98%, and the total drift decreased by 28.65%, of which the upwind drift decreased by 28.31% and the downwind drift decreased by 29.06%. In the forth-back application of 90 km/h, the error between actual application volume and system setting dose was 12%. The results of this study can provide valuable references for future research and practices on variable-rate aerial applications by manned helicopters.
Keywords: manned helicopter, precision agriculture, variable-rate aerial application, spray test, adjuvant, droplet deposition
DOI: 10.25165/j.ijabe.20191201.4039
Citation: Yao W X, Lan Y B, Wen S, Zhang H H, Zhang Y L, Wang J, et al. Evaluation of droplet deposition and effect of variable-rate application by a manned helicopter with AG-NAV Guía system. Int J Agric & Biol Eng, 2019; 12(1): 172–178.
1 Introduction
In the 1990s, an aerial variable-rate application system was first used in the United States and then gradually developed[1]. An aerial variable-rate application system includes navigation system and variable flow control system that allows variable spray of pesticides, herbicides, soil amendments and fertilizers for specific areas. The research on aerial variable-rate application system started earlier in developed countries and there have been some commercial aerial variable-rate application control systems for manned agricultural
Received date: 2018-03-05 Accepted date: 2018-12-18
Biographies: Weixiang Yao, PhD candidate, research interests: precision agriculture technology and equipment, Email: [email protected]; Sheng Wen, PhD, Associate Professor, research interests: precision agricultural aviation application, Email: [email protected]; Huihui Zhang, PhD, Research Agricultural Engineer, research interests: airborne and ground-based remote sensing, Email: [email protected]; Yali Zhang, PhD, Associate Professor, research interests: precision agricultural aviation application, Email: [email protected]; Juan Wang, PhD candidate, research interests: precision agriculture technology and equipment, Email: [email protected]; Chunchun Xie, Senior engineer, research interests: application of pesticides in agriculture aerial, Email: [email protected].
*Corresponding author:Yubin Lan, PhD, Distinguished Professor, research interests: precision agricultural aviation application. College of Engineering, South China Agricultural University, Guangzhou 510642, China. Tel: +86-20-85281421, Email: [email protected].
aircraft. The common feature of these systems is to provide precision navigation guidance for pilots, and automatically adjust spray flow rate according to the flight parameters during flight[2,3].
GPS real-time positioning error was from 0.01% to 0.11% while the aircraft was flying in a range of 176 km/h to 238 km/h. Koch et al.[8] compared the economic costs of nitrogen fertilizer spray based on variable-rate and common constant application in specific areas, and indicated that the application of variable-rate technology could reduce the amount of 6%-46% of nitrogen fertilizer and increase the economic incomes of $18.21-$29.57 per hectare. Mcleod et al.[9] gave a detailed introduction to the application of aerial variable spraying systems in forest pest control and found that actual droplet deposition area shifted with the direction of natural wind. They also demonstrated how to use the variable spray system to achieve offset compensation for deposition. Priddel et al.[10] installed an AG-NAV Guía (AG-NAV Inc., Barrie, Canada) system on AS350B3 manned helicopter (Eurocopter SA, Marseille, France) to carry out variable-rate aerial baiting for eradication exotic mammals such as mice and rabbits on the southern island of Australia. The system was set at 30 m, 70 m and 80 m effective swath widths for different sizes of the trapping baits. They sampled every three months after spraying, and finally verified that the effect of variable-rate application was significant.
At present, there is a big gap in aviation spray equipment and core technology research between China and other developed countries[11,12]. In China, few scholars are engaged in research on aerial variable-rate technology with agricultural manned helicopter, and most of them concentrate in the field of agricultural unmanned aerial vehicle (UAV)[13-17]. Up to now the main spraying application with manned agricultural helicopter in China is still constant rate, in addition, related studies usually focused on pesticides efficacy analysis[18-20]. It usually lacks practical assessment of actual application parameters for various helicopters and ancillary equipment after their introduction from foreign countries[21], let alone droplet deposition of variable spraying. Only Zhang et al.[22] designed a control system of variable pesticide application for manned helicopter in China. The results of actual effect comparison showed that when the speed of the helicopter was less than 160 km/h, the error between the actual application pesticide volume and pesticide application volume set did not exceed 10%. However, this study only verified the effect of the system from the perspective of application volume; droplet deposition and drift situation of variable-rate application by the helicopter were not analyzed.
The objectives of this study were to evaluate the performance parameters of AG-NAV Guía system on an AS350B3e helicopter and provide effective theoretical guidance for the promotion of the variable-rate application system in China.
2 Materials and methods
2.1 Manned helicopter and carrying equipment
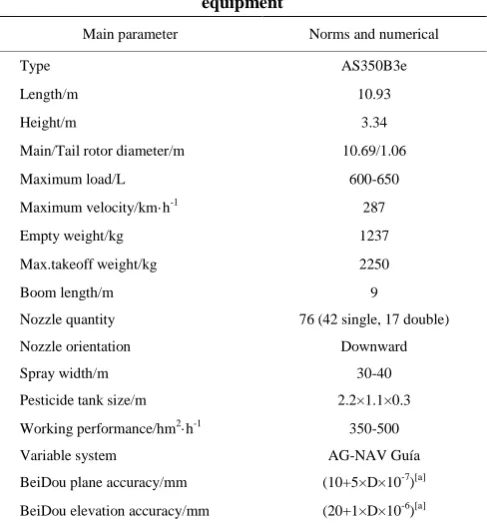
Spray application tests used TR-3 conical nozzles (Lechler Gmbh, Metzingen, Germany). All tests were made using an AS350B3e helicopter, equipped with the AG-NAV Guía system for precision variable-rate spraying control. Simultaneously, an aerial BeiDou positioning UB351 system developed by South China Agricultural University with the function of RTK differential positioning was also equipped[23]. The data acquisition interval was 0.1 s to record flight parameters in real time and draw actual operation trajectory as references for variable-rate spraying effect analyze. The specifications of the helicopter and carrying equipment are listed in Table 1.
Table 1 Specifications of AS350B3e and carrying equipment
Main parameter Norms and numerical
Type AS350B3e
Length/m 10.93
Height/m 3.34
Main/Tail rotor diameter/m 10.69/1.06
Maximum load/L 600-650
Maximum velocity/km·h-1 287
Empty weight/kg 1237
Max.takeoff weight/kg 2250
Boom length/m 9
Nozzle quantity 76 (42 single, 17 double)
Nozzle orientation Downward
Spray width/m 30-40
Pesticide tank size/m 2.2×1.1×0.3
Working performance/hm2·h-1 350-500
Variable system AG-NAV Guía
BeiDou plane accuracy/mm (10+5×D×10-7)[a]
BeiDou elevation accuracy/mm (20+1×D×10-6)[a] Note: [a] D in parentheses represents actual distance measured by BeiDou, unit,
km.
2.2 Spray reagent and sample collection card
The experiment used the mass fraction of 1.25‰ urea aqueous solution 400 L instead of liquid pesticide for spraying, with flying adjuvant Feibao (Shandong Ruida Pest Prerention & Control Co., Ltd, Jinan, China). The adjuvant volume fraction was 3‰, and the main ingredient was vegetable oil and function for anti-evaporation, promoting sedimentation, reducing drift. The sample collection card, 76 mm×26 mm, was water-sensitive paper (WSP) (Syngenta Crop Protection LLC, Basel, Switzerland).
2.3 Experimental site and layout
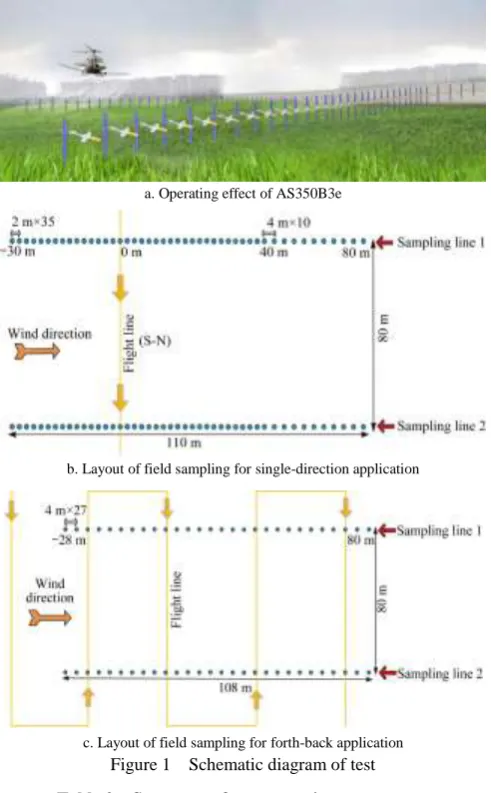
The experiment was implemented at Shashi Airport (112°17′E, 30°19′N) of Jingzhou City, Hubei Province, China. The experiment site was 2000 m long and 400 m wide without shelters, and the main spraying area was grassland with a grass height of 15-25 cm. Figure 1 shows how the sample collection cards and application patterns arranged at the spray area. According to the wind direction, the spray area was determined for two sampling lines from east to west (E-W) with 110 m long and 80 m spacing. The sampling lines were paralleled to the prevailing wind, and each collection was marked in steps from –30 m to 80 m (E-W). The helicopter flew south to north (S-N) at the direction perpendicular to the wind direction. The entire test included six single-pass applications (S-N) (1#-6#) and two forth-back applications (7#, 8#), and the specific test parameters are shown in Table 2. For the single-pass application, the sample collection at the centerline was set as 0 m, and the interval of WSPs was 2 m in –30 m to 40 m area and 4 m in 40 m to 80 m area. For the forth-back application test, the swath width was set as 30 m, and the interval of WSPs was 4 m through entire sampling lines.
a. Operating effect of AS350B3e
b. Layout of field sampling for single-direction application
c. Layout of field sampling for forth-back application Figure 1 Schematic diagram of test
Table 2 Summary of test operation parameters
Test Setting flight velocity/km·h-1
Setting flight height/m
Add aviation adjuvant
Setting spray /L·hm-2
# 90 5 N 12
2# 70 5 Y 12
3# 90 5 Y 12
4# 90 5 Y 12
5# 100 5 Y 12
6# 120 5 Y 12
7# 90 5 Y 12
8# 90 5 Y 6
2.4 Data analysis
After each spray application test, the WSPs were immediately gathered and put into marked envelopes with disposable gloves and placed in a cool place to be brought back to the laboratory later. Then WSPs were analyzed by using image processing software DepositScan (USDA. Wooster, USA). The deposition, DV0.1, DV0.5, DV0.9, and deposition density of drops per card were determined. Meanwhile, mean deposition, mean deposition density and coefficient of variation (CV) were also calculated.
The DVa values are the droplet diameters (µm) where (a × 100) % of the spray volume is accumulated in droplets smaller than this value. The coefficient of variation is used to characterize the uniformity of deposition distribution. The smaller coefficient of variation, the more uniform of droplet deposition distribution is.
2.5 Statistical analyses
All the statistical analyses were performed using the Origin Pro
8.5 software (OriginLab, Hampton, USA). Flight velocity was divided into four levels, the mean value were tested in effective swath area for deposition, DV0.5, deposition density, and the effective swath width measured by the WSP was separated by Least-Significant Difference (LSD) multiple test (α = 0.05).
3 Results and discussion
3.1 Meteorological data
The meteorological data for each test are presented in Table 3. Mean temperature, humidity and wind velocity were consistent across all tests. The wind angles varied between 6.1° and 25.7° and were well within the ±30° recommended by the Industrial Standard MH/T 1050-2012 (2012)[24].
Table 3 Meteorological data measured and calculated for each test
Test Time
Mean temperature
/°C
Mean humidity
/%
Wind velocity
/m·s-1
Wind description
Wind angle deviation[a]
/(°) 1# 10:14-10:15 22.4 72.6 1.5 Northeast 25.7 2# 10:26-10:27 21.5 73.1 1.3 Northeast 16.1 3# 10:32-10:33 22.1 71.1 1.6 Northeast 14.9 4# 10:37-10:38 22.0 72.5 2.3 Southeast 8.6 5# 10:42-10:43 21.9 71.3 1.2 Southeast 15.5 6# 10:47-10:48 21.8 72.8 1.1 Northeast 6.1 7# 10:52-10:55 21.9 70.2 1.7 Southeast 17.4 8# 11:06-11:09 22.0 71.1 1.5 Southeast 9.2 Note: [a] Wind angle deviation corresponds to angle of wind relative to sampling line.
3.2 Analysis of single-pass application
3.2.1 Operating parameters and track processing
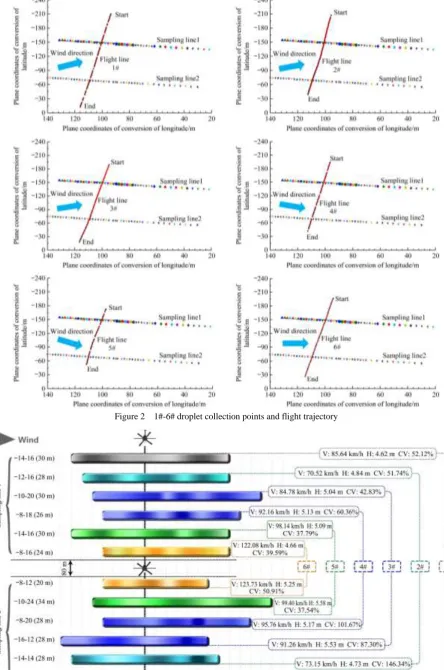
After accurate measurements by aerial BeiDou positioning UB351 system, six single-pass application operations and tracks were in accordance with the set trajectory (Figure 2). The error between actual flight velocity and setting velocity was within 6 km/h, and the mean actual flight height was 5.03 m with the CV of 6.58%. It can be confirmed that the actual operating parameters met the requirements of the test design.
3.2.2 Effective swath and corresponding deposition effect To determine the effective swath, the research methods of M-18B and Thrush 510G[25] and Industrial Standard MH/T 1040-2011 (2011)[26] were referred. We took the half deposition of the maximum peak of a single-pass distribution as a judging standard, and the calculated droplet deposition, distribution uniformity, and corresponding sampling points of the effective swath start and end positions of each test were recorded, as showed in Figure 3.
Figure 2 1#-6# droplet collection points and flight trajectory
caused by the differences of natural wind velocity and wind direction in each test by comparing with the meteorological data. At the meantime, the flight velocity also impacted on the difference of effective swath width, the effective swath width of 2# (70 km/h), 3# (90 km/h), 4# (90 km/h), 5# (100 km/h), 6# (120 km/h) were 28 m, 29 m, 27 m, 32 m, and 22 m, respectively. With the increase of flight velocity, the effective swath width increased slowly but then decreased sharply. The flight velocity of 100 km/h was the peak inflection point of effective spray width variation. When the operating height was 5 m, the operating velocity of 90-100 km/h should be selected because the effective swath width is relatively large and stable under these circumstances.
In sampling line 2, the CV of 2#, 3# and 4# was 146.34%, 87.30% and 101.67%, respectively, which was the worst of uniformity. The main reason for this phenomenon was that the helicopter had a rotor vortex and lower wind field was unevenly distributed[27]. The droplet deposition was susceptible to turbulence resulting in depositions at 8 m (2#), 10 m (3#), –8 m (4#) and 10 m (4#) were unusually large, thus CV was affected. It can be seen that the study of relationship between wind field and distribution of droplet deposition should be strengthened so that the optimal operating parameters can be selected reasonably for different operating environments.
The results of LSD’s multiple range tests in each effective swath for deposition, DV0.5, deposition density and effective swath are given in Table 4.
Table 4 LSD’s multiple range test in each effective swath for deposition, DV0.5, deposition density and effective swath
Treatment Deposition[a] DV0.5 Deposition density Effective swath
70 km/h a a d a
90 km/h ab a b a
100 km/h b ab c a
120 km/h c b a b
Note: [a] Column means with the same letter are not significantly different. 3.2.3 Effect of adding adjuvant
Among the six single-pass application tests, only 1# was set with the flying velocity of 90 km/h and without adding adjuvant. Referring to the actual weather conditions and flight parameters, 3# and 1# were most similar expect for adding adjuvant, so the two were chosen to compare the effect of adding adjuvant.
It can been seen from Figure 3 that the effective swath width of 1# for each sampling line was 30 m and 28 m, and the effective swath width of 3# for each sampling line was 30 m and 28 m, too, which indicates that the effect of adding adjuvant on effective swath width is not obvious. As shown in Figure 4, the mean deposition and uniformity of 1# was 0.167 μL/cm2 and 88.43%, while the mean deposition and uniformity of 3# was 0.182 μL/cm2 and 65.07%, respectively, in the effective swath area. The deposition after adding adjuvant increased by 8.98%, which demonstrates that adjuvant was helpful for increasing deposition and producing deposition more uniformly. As shown in Figure 5, the mean DV0.1, DV0.5, DV0.9 and deposition density of 1# were 237.56 μm, 397.35 μm, 607.17 μm, and 14.91 /cm2, respectively; while the mean DV0.1, DV0.5, DV0.9 and deposition density of 3# were 247.93 μm, 424.42 μm , 628.89 μm, and 13.23 /cm2, respectively in the effective swath area. The difference in deposition density was not much, but the droplet size of 3# was greater than the droplet size of 1#. Therefore, the droplet size increased after adding adjuvant, but the influence of adding adjuvant for deposition
density was small.
The total drift of 3# decreased by 28.65% after adding adjuvant compared with 1#, of which the upwind drift decreased by 28.31%, and the downwind drift decreased by 29.06% (Figure 6). This approved that the use of adjuvant was useful for mitigating drift.
Figure 4 Comparison of mean deposition and mean distribution uniformity for the use of adjuvant
Figure 5 Comparison of mean droplet size and mean deposition density for the use of adjuvant
Note: m#-n indicates the sampling line n of m#.
Figure 6 Statistical analysis of the 1# and 3# droplet drift situation
3.3 Analysis of forth-back application
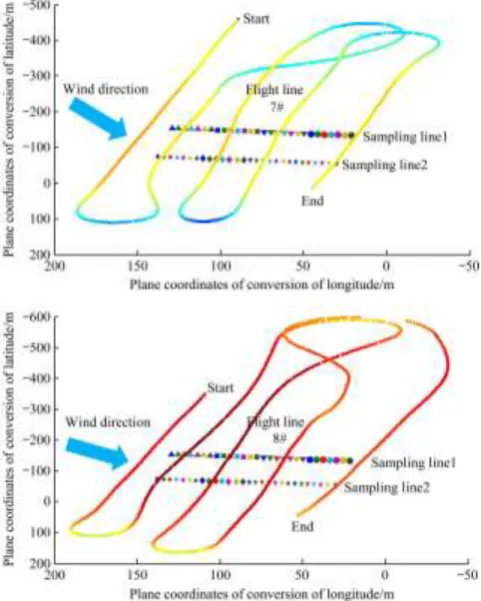
3.3.1 Operating parameters and trajectory processing
Figure 7 7#-8# Droplet collection point and flight trajectory
Table 5 Summary of flight operation parameters in research area
Flight data Flight velocity/km·h-1 Flight height/m
7#
Pass 2 90 5.67
Pass 3 92 3.83
Pass 4 89 6.50
8#
Pass 2 110 4.69
Pass 3 105 5.65
Pass 4 93 6.56
3.3.2 Effect of total spray volume
In forth-back applications, a total spray volume of 12 L/hm2 and 6 L/hm2 were set for 7# and 8#, respectively. Figure 8 shows that: the mean DV0.1, DV0.5, DV0.9 and deposition density of 7# were 237.77 μm, 427.03 μm, 656.42 μm, and 19.09 /cm2, respectively, while the mean DV0.1, DV0.5 and DV0.9 and deposition density of 7# were 210.06 μm, 366.85 μm, 558.53 μm, and 15.07 /cm2, respectively. Clearly, the droplet size and deposition density of 7# were greater than the droplet size and deposition density of 8#.
Figure 8 7#-8# Comparison of mean droplet size and mean deposition density in research area
As shown in Figure 9, deposition of 7# and 8# were significantly different. The mean deposition amount of droplet measured of 7# was 0.237 μL/cm2, and the mean droplet deposition measured of 8# was 0.135 μL/cm2. The former was 1.76 times of the latter, namely the error between actual application volume and system setting dose was 12%, but the trends of two deposition curves were different. The reasons for this situation are:
1) As shown in Table 5, the overall flight velocities of 7# were stable, but the flight heights of pass 3 and pass 4 changed in a large degree. The pass 2 and pass 3 flight height of 8# were stable, but the pass 4 changed greatly. The flight velocity of pass 2, and pass 3 also changed in a large degree for setting parameters. Flight velocity and height are the main factors that affect spray deposition, so difference between the velocity and height of each flight pass during forth-back application was the main reason that caused different spray effects.
2) Furthermore, natural wind velocity and direction were constantly changing in actual application (Table 3). 7# was southeast wind with the mean wind velocity of 1.7 m/s and wind angle of 17.4°; while 8# was southeast wind with the mean wind velocity of 1.5 m/s and wind angle of 9.2°. The effect of spraying in flying applications is particularly affected by natural wind.
Figure 9 7#-8# Comparison of deposition in the research area
4 Conclusions
In this research, the regular patterns of droplet deposition and actual variable-rate spraying effect applied by the AS350B3e helicopter with the AG-NAV Guía system were evaluated when the helicopter was operated in different operating parameters and methods. The results illustrated that the position of effective swath area was affected by natural wind velocity and wind direction, and the width of effective swath was affected by flight velocity. When the helicopter was operated at the height of 5 m and the flight velocity increased from 70 km/h to 120 km/h, the effective swath width increased slowly and then decreased sharply. Due to the presence of rotor vortex, the droplet distribution uniformity was susceptible; it was easy to form a larger deposition on 8-10 m both sides of the centerline. Adding adjuvant could increase droplet size and uniformity in the effective swath area, while increase 8.98% of the deposition and reduce 28.65% of the drift. In addition, in the analysis of total spray volume changing by the AG-NAV Guía system, the variable effect was significant, and the error between actual application volume and system setting dose was just 12%. The results and data of this study will be valuable references for future variable-rate aerial applications by manned helicopters in China.
Acknowledgments
Guangdong Leading Talent Project (2016LJ06G689), National Key
Technologies Research and Development Program
(2016YFD0200700), 111 Project (D18019), Guangdong Leading Talent Project (2016LJ06G689), Educational Commission of Guangdong Province of China for Platform Construction and (2015KGJHZ007), Science and Technology Planning Project of Guangdong (2017B010117010). Thanks the National Center for International Collaboration Research on Precision Agricultural Aviation Pesticides Spraying Technology for the full participation persons of the experiment (Yue Changquan, Wang Guobin, Huang Cong). Thanks to Shandong Ruida Pest Prerention & Control Co., Ltd for strong support.
[References]
[1] Lan Y B, Thomson S J, Huang Y B, Hoffmann W C, Zhang H H. Current status and future directions of precision aerial application for site-specific crop management in the USA. Computers & Electronics in Agriculture, 2010; 74(1): 34–38.
[2] Stevenj T, Huang Y B, Jamese H, Daniele M, Lowreya S. Improving flow response of a variable-rate aerial application system by interactive refinement. Computers & Electronics in Agriculture, 2010; 73(1): 99–104.
[3] Xue X Y, Lan Y B. Agricultural aviation applications in USA. Transactions of the CSAM, 2013; 44(5): 194–201. (in Chinese)
[4] Kirk I W, Tom H H. Precision GPS flow control for aerial spray applications. Precision Agriculture, 1996; 3: 815–817.
[5] Smith L A. Automatic flow control for aerial application. Applied Engineering in Agriculture, 2000; 17(4): 449–455.
[6] Thomson S J, Smith L A, Hanks J E. Evaluation of application accuracy and performance of a hydraulically operated variable-rate aerial application system. Transactions of the ASABE, 2009; 52(3): 715–722.
[7] Smith L A, Thomson S J. GPS position latency determination and ground speed calibration for the SATLOC Airstar M3. Applied Engineering in Agriculture, 2005; 21(5): 769–776.
[8] Koch B, Khosla R, Frasier W M, Westfall D G, Inman D. Economic feasibility of variable-rate nitrogen application utilizing site-specific management zones. Agronomy Journal, 2004; 96(6): 1572–1580. [9] McLeod I M, Lucarotti C J, Hennigar C R, MacLean D A, Holloway A G
L, Cormier G A, et al. Advances in aerial application technologies and decision support for integrated pest management. Integrated Pest Management and Pest Control-Current and Future Tactics, 2012; pp.651–668.
[10] Priddel D, Carlile N, Wilkinson I, Wheeler R. Eradication of exotic mammals from offshore islands in New South Wales, Australia. IUCN, 2011; pp.107–114.
[11] Zhou Z Y, Zang Y, Luo X W, Lan Y B, Xue X Y. Technology innovation development strategy on agricultural aviation industry for plant
protection in China. Transactions of the CSAE, 2013; 29(24): 1–10. (in Chinese)
[12] Lan Y B. Agricultural applications of unmanned aerial vehicle. Zi Guangge, 2017; 1: 86.
[13] Liu Y, Gu C Y. The airborne aeronautical chart assisting navigation system based on component GIS. Geomatics & Spatial Information Technology, 2009; 6: 87–89, 92. (in Chinese)
[14] Lu Z H, Shen M X, Ji C Y. Channel planning and border algorithm in agricultural aircraft operating based on embedded and GPS technology. Journal of Anhui Agricultural, 2009; 8: 3819–3820, 3823. (in Chinese) [15] Xu X, Xu S, Liu Y X, Chen J S, Cai Z X, Yu Z S. Variable pesticide
spraying system design based on small UAV. Guangdong Agricultural Sciences, 2014; 9: 207–210. (in Chinese)
[16] Wang L, Lan Y B, Hoffmann W C, Bradley K F, Chen D, Wang S M. Design of variable spraying system and influencing factors on droplets deposition of small UAV. Transactions of the CSAM, 2016; 1: 15–22. (in Chinese)
[17] Xue X Y, Lan Y B, Sun Z, Chang C, Hoffmann W C. Develop an unmanned aerial vehicle based automatic aerial spraying system. Computers & Electronics in Agriculture, 2016; 128: 58–66.
[18] Huang W Z, Lin X A, Cao Q, Qin Y Y. Preliminary report on the experiment of spraying biological agents to control locust locus. Journal of Henan Forestry Science and Technology, 2006; 4: 16–18.
[19] Zhong L, Qiu G H, Song J H, Shi J M, Xu F F, Zhu Q Q, et al. The effect of droplet deposition on the control of rice sheath blight. China Plant Protection, 2014; 8: 64–66. (in Chinese)
[20] Yan R K, Wu N, Hu W J, Wang H E. Experimental report on the control of chromaphis juglandicola kaltenbach by R44Raven-Ⅱ type of helicopter. Journal of Green Science and Technology, 2016; 3: 4–6. (in Chinese) [21] Zhang D Y, Lan Y B, Chen L P, Wang X, Liang D. Current status and
future trends of agricultural aerial spraying technology in China. Transactions of the CSAM, 2014; 45(10): 53–59. (in Chinese)
[22] Zhang R R, Li Y, Yi T C, Chen L P. Design and experiments of control system of variable pesticide application for manned helicopter. Journal of Agricultural Mechanization Research, 2017; 10: 124–127. (in Chinese) [23] Lan Y B, Chen S D, Li J Y, Zhang Y L, Huang C, Yao W X, et al.
Evaluation system of flying flight quality based on BeiDou locating system. Chinese Patent, CN205563277U.
[24] MH/T Standards. 1050-2012: Field measurement methods for Aircraft spray drift, Beijing: MHT, 2012. (in Chinese)
[25] Zhang D Y, Chen L P, Zhang R R, Xu G, Lan Y B, Wesley C H, et al. Evaluating effective swath width and droplet distribution of aerial spraying systems on M-18B and Thrush 510 G airplanes. Int J Agric & Biol Eng, 2015; 8(2): 21–30.
[26] MH/T Standards. 1040-2011: Determining application rates and distribution patterns from aerial application equipment, Beijing: MHT, 2011. (in Chinese)