flume experiments and the analysis of
remotely-sensed data
Grecia Alejandra Garcia Lugo
A thesis submitted for the degree of Doctor of Philosophy
School of Geography, Queen Mary University of London
my own work or that where it has been carried out in collaboration with, or supported
by others, that this is duly acknowledged below and my contribution indicated.
Previously published material is also acknowledged below.
I attest that I have exercised reasonable care to ensure that the work is original, and does
not to the best of my knowledge break any UK law, infringe any third party’s copyright
or other Intellectual Property Right, or contain any confidential material.
I accept that the College has the right to use plagiarism detection software to check the
electronic version of the thesis.
I confirm that this thesis has not been previously submitted for the award of a degree by
this or any other university.
The copyright of this thesis rests with the author and no quotation from it or information
derived from it may be published without the prior written consent of the author.
Signature:
Date: 11th of September, 2014
Research for this thesis was conducted within the framework of SMART (Science for
MAnagement of Rivers and their Tidal systems), which is an Erasmus Mundus Joint
Doctoral Programme (EMJD).
EMJDs aim to foster cooperation between higher education institutions and academic
staff in Europe and third countries with a view to creating centres of excellence and
providing a highly skilled 21st century workforce enabled to lead social, cultural and
economic developments. All EMJDs involve mandatory mobility between the
universities in the consortia and lead to the award of recognised joint, double or
multiple degrees.
The SMART programme represents a collaboration among The University of Trento,
Queen Mary University of London, and Frei University Berlin. Each doctoral student
within the SMART programme has conformed to the following during their 3 years of
study:
(i) Supervision by a minimum of two supervisors in two institutions (their
primary and secondary institutions).
(ii) Study for a minimum period of 6 months at their secondary institution.
(iii) Successful completion of a minimum of 30 ecus of taught courses.
(iv) Collaboration with an associate partner to develop a particular
component / application of their research that is of mutual interest.
(v) Submission of a thesis within 3 years of commencing the programme.
Abstract
Braided rivers exhibit extremely complex and dynamic morphologies as their multiple
channels are constantly re-worked. The research reported in this thesis explored a
number of properties of braided river form and dynamics and some controlling factors
through three individual but complementary research elements.
The first research element was concerned with some of the controls on the transition
between single thread and multi-thread channel patterns. Twenty-seven different flume
experiments were conducted, supported by fourteen replicates. In these experiments,
channel confinement (maximum possible channel width) and formative discharge were
varied in a 25 x 2.9 m flume of constant slope (1%) and bed material (D50 = 1mm) with
sediment supply constrained to match sediment output. As the maximum potential
channel width increased, the channel pattern changed from a single channel with
alternate bars, to the formation of mid-channel bars, and finally to a multi-thread
braided pattern. Bed elevation frequency distributions showed distinct changes in their
median, standard deviation, skewness and kurtosis as channel width and discharge
increased, indicating the consequences of confining braided channels and regulating
discharge on their bed elevation and morphology.
The second and third parts of the research use remotely sensed data sets to explored (i)
the degree to which a real river shows similar characteristics to those generated in the
flume experiments and (ii) the variety in braiding patterns that are found in association
with different boundary conditions of slope, width, discharge, and riparian vegetation.
For the second research element, a Lidar survey of a 36 km reach of the lower
Tagliamento river, Italy, was investigated. Within this reach, the river shows only small
variations in slope and bed material size and is subject to the same flood flows. Analysis
focused on thirty-six 1 km sub-reaches and demonstrated clear associations among the
median, standard deviation, kurtosis and skewness of the bed and also clear downstream
trends. Measures of vegetation cover showed statistically-significant associations with
the median, standard deviation, kurtosis and skewness of the bed, particularly when
only the 32 truly braided reaches were analysed. The measures of vegetation cover also
Overall, variations in bed morphology showed similar characteristics to those observed
in the laboratory flume, but also they showed correspondence with riparian vegetation
cover, indicating a topographic signature of vegetation on the bed morphology. The
downstream trends appear to be associated with the changing vigour of the riparian
vegetation and possibly variations in river baseflow characteristics associated with
varying groundwater levels in the alluvial aquifer. The most mature patches of
vegetation within the braid plain of the most downstream part of the 36 km reach appear
to occur on remnants of braid plain isolated by river bed incision.
The third and final research element considered the morphology of six European
braided rivers of different slope, width, discharge and riparian vegetation type.
Information extracted from Google Earth and other aerial imagery, and gauged river
flow data supported an analysis of changes in braided river characteristics through time,
and among the six European river sites. Four traditional planform indices were used to
characterise the braiding pattern (Bi – braiding index, Ai and Ai2 –anastomosing
indices; Si – main channel sinuosity) were combined with measures of stream power
and its component variables (width, Q10, and slope). Robust data for bed material
calibre was not available. Statistical analysis of the entire data set revealed a potential
influence of riparian vegetation type on the relationship between unit stream power and
braid channel width; and a trend of increasing Bi, Ai, Ai2, and Si with decreasing unit
stream power. However, a larger and more complete data set is needed to confirm these
general trends and to fully explore transitional rivers.
This research has illustrated the morphological consequences of confining braided rivers
and the dependence of the braiding pattern on stream power. It has also illustrated the
role of vegetation in contributing to the morphological complexity of braided rivers and
the potential role of riparian vegetation in constraining the relationship between stream
Acknowledgements
First, thanks must go to my supervisor Professor Angela Gurnell, without whom this
thesis wouldn’t have been possible. I’ve learned so much from you and it has been a
privilege to work with you. To my second supervisors, Dr. Alex Henshaw, and Dr.
Walter Bertoldi, without your comments, tutoring, endless discussions, corrections and
suggestions in each of these chapters, this simply couldn’t have been done.
Thanks to the European Union, through the Erasmus Mundus fellowships and the
SMART consortium, for the opportunity to better myself through learning and research
in a multi-cultural and interdisciplinary environment.
To the laboratory staff at University of Trento who helped with the intensive laboratory
work of my project, especially Martino Salvaro, Lorenzo Forti, Andrea Bampi, and
Matilde Welber.
My work has included a wide variety of data collection in a range of forms,
management, display, analysis techniques and visualization. I am very grateful to Judy
England and Lucy Shuker from the Environment Agency in the UK for the provided
data, suggestions, as well as the opportunity to have done my associate partnership with
them. For guidance in processing data: Simone Zen, Francesca Pilotto, Bob Grabowski,
Alex Henshaw, and Walter Bertoldi, thank you for helping me solve the mysteries of
ArcGIS, R, Excel, MatLab, and Fusion.
To my family your support, cheering, hours of long distance conversations, I wouldn’t
be who I am today without you.
Fellow SMART and postgraduate students in London, Italy and Berlin who have been
there to support me and offer help and advice when most needed. You all have been my
adopted traveling family for the last three years. Thank you.
Special thanks to Isabel Ávalos, Wen Penderson and PG for their invaluable help
To the secretaries –past and present- of the SMART programme: Marina Rogato, Marta
Timoncini, Laura Martuscelli, and Claudia Fraizingher, without you this programme
wouldn’t be the same.
Table of Contents
Abstract ... 4
Acknowledgements ... 6
Table of Contents ... 8
List of Figures ... 12
List of Tables ... 19
Chapter 1 Introduction ... 22
Chapter 2 Developing a Process-based Understanding of Alluvial River Channel Styles: A Brief Introduction to the Braid-meander Transition ... 24
2.1 INTRODUCTION ... 24
2.2 THE DESCRIPTIVE ERA ... 24
2.3 INCORPORATING PROCESS UNDERSTANDING: DISCHARGE, SEDIMENT AND GRADIENT CONTROLS ... 25
2.4 THE ROLE OF RIPARIAN VEGETATION ... 38
2.5 CONCLUSIONS ... 41
2.6 RESEARCH QUESTIONS ... 42
Chapter 3 Flume Experiments to Investigate Braided Channel Development Under Controlled Conditions ... 44
3.1 INTRODUCTION ... 44
3.1.1 Definitions of “Braiding”... 45
3.1.2 Quantifying Properties of Braided Channel Form ... 45
3.1.3 Controls on Braiding and Braided Channel Morphology ... 47
3.1.4 Research Questions ... 51
3.2 METHODS ... 52
3.2.1 Flume Experiments ... 52
3.2.2 Data Analysis ... 56
i) Data preparation for DEM construction and description ... 56
ii) DEM construction ... 57
iii) Estimation of dimensionless stream power ... 58
3.3.1 Descriptive Statistics ... 59
3.3.2 Digital Elevation Models ... 63
3.3.3 Elevation Frequency Distributions ... 69
3.3.4 Associations Among Processes and Channel Size and Form ... 71
i) Dynamic equilibrium in sediment transport ... 71
ii) Wetted and active widths ... 72
iii) Changes in channel form in response to changes in stream power and flume width ... 75
iv) Channel morphology and the emergence of mid-channel bars... 78
v) Repetition runs ... 79
3.4 DISCUSSION AND CONCLUSIONS ... 83
3.4.1 Research Question 1: To what extent does bed morphology vary between experiments conducted with the same formative discharge and fixed maximum channel width? ... 83
3.4.2 Research Question 2: To what extent does bed morphology change in response to different fixed formative discharges / stream powers within the constraints of a fixed maximum channel width?... 83
3.4.3 Research Question 3: To what extent does bed morphology change in response to a fixed formative discharge / discharge within the constraints of different fixed maximum channel widths? ... 83
3.4.4 Research Question 4: To what extent does bed morphology change in response to different fixed, formative discharges within the constraints of different fixed maximum channel widths? ... 84
3.4.5 Comparison of the Experimental Results with Observations and Predictions From Previous Work ... 85
3.4.6 Concluding Remarks ... 87
Chapter 4 Interactions Between Vegetation and Channel Morphology on a Braided River: The Lower Tagliamento River, Italy ... 89
4.1 INTRODUCTION ... 89
4.3 METHODS ... 92
4.3.1 Extraction and Analysis of a Digital Elevation Model of the River Bed ... 92
4.3.2 Extraction and Analysis of a Vegetation Canopy Surface Model ... 94
4.4 RESULTS ... 96
4.4.1 Description of the Detrended DEM Data for the 36 1km Reaches ... 96
4.4.2 Relationships Among Bed Morphological Properties Across the 1 km Reaches ... 107
4.4.3 Relationships Between Vegetation and Bed Morphological Properties Across the 1 km Reaches ... 109
4.5 DISCUSSION AND CONCLUSIONS ... 123
4.5.1 River Bed Topography ... 123
4.5.2 Associations Between Bed Topography and Vegetation... 125
4.5.3 Outlier Reaches ... 127
Chapter 5 Braiding, Anastomosing and Sinuosity Indices: a Comparison Among Reaches of Six European Braided Rivers ... 128
5.1 INTRODUCTION ... 128
5.2 MATERIALS AND METHODS ... 129
5.2.1 Selection of Rivers and Images ... 129
5.2.2 Extraction of Information From Images ... 130
5.2.3 Discharge, Bed Material and Stream Power ... 136
5.2.4 Data Analysis ... 141
5.3 RESULTS ... 141
5.3.1 Options 1 and 2 ... 141
5.3.2 Selecting Informative Variables ... 142
5.3.3 Associations Among Variables within a Single River ... 144
5.3.4 Associations Among Planform, Channel Dimension and Stream Power Variables Across Six European Braided Rivers ... 147
5.4 DISCUSSION AND CONCLUSIONS ... 154
Chapter 6 Summary, Implications, Future Research, and Conclusions ... 159
6.2 SUMMARY OF RESEARCH FINDINGS ... 159
6.2.1 Research Question 1: What are the influences of variations in discharge and river confinement on river style and bed morphology? ... 159
6.2.2 Research Question 2: What is the influence of vegetation on braided and transitional river morphology? ... 162
6.2.3 Research Question 3: Does the type and extent of vegetation influence / co-vary with braided river planform? ... 166
6.3 FUTURE RESEARCH ... 168
6.4 RELEVANCE OF RESEARCH TO RIVER MANAGEMENT ... 170
List of Figures
Figure 2.1 Combinations of slope and bankfull discharge observed for
natural channels, and a line separating braiding and
meandering channels (from Leopold and Wolman, 1957)... 27
Figure 2.2 Association between river planform style, discharge and slope
showing the threshold between meandering and braiding
defined by Leopold and Wolman, 1957 (data sources: Leopold
and Wolman, 1957, Ferguson, 1987, Knighton and Nanson,
1993, Beechie et al., 2006). (from Gurnell et al., 2009). ... 28
Figure 2.3 Association between river planform style, discharge, slope and
bed sediment calibre (data sources as for Fig. 2.2, thresholds
between styles from Church 2002). (from Gurnell et al., 2009). .... 29
Figure 2.4 Channel styles associated with different modes and calibres of
sediment transport, stream power, sediment calibre and
sediment load (after Schumm, 1985) ... 33
Figure 2.5 Channel styles differentiated according to stream power,
amount and size of bedload, width-depth ratio and channel
instability (after Ferguson 1987 in Kleinhans, 2010). ... 33
Figure 2.6 Association of alluvial river channel form with the principal
governing factors (from Church 2006, after Church 1992,
based on the concept of Mollard 1973 and Schumm 1985).
Shading indicates sediment character and vegetation cover. ... 34
Figure 2.7 Approximate distribution of specific stream power, bed and
bank sediment calibre, lateral migration rate, vertical accretion
rate, channel sinuosity and island length/channel width ratio for
eight types / subtypes of anabranching river (from Nanson and
Knighton, 1996). ... 35
Figure 2.8 Q-S plot locating six types of anabranching river in relation to
the meander-braid threshold of Leopold & Wolman (1957)
(from Nanson and Knighton, 1996). ... 35
Figure 2.9 Patterns of equilibrium alluvial rivers. (A) Data subdivided by
Figure 2.10 Channel pattern discriminant functions expressed as a function
of slope, discharge and relative bank strength (from Eaton et
al., 2010)... 38
Figure 2.11 Conceptual model of associations between tree growth
performance, flood magnitude/frequency and channel style.
Sediment supply is assumed to be sufficient to support the
different channel styles. Three trajectories of riparian tree
growth (solid lines) from seedling / sapling, through shrub,
young and mature tree stages (dashed lines) according to
different growing conditions are compared with the range in
the maximum time period between floods capable of uprooting
trees across the three trajectories (thin grey arrows) to prevent
transitions between the given river planform styles (italic text)
(from Gurnell et al., 2009). ... 40
Figure 3.1 The flume used in the experiments. A) Volumetric sand feeder,
parallel camera to the flume bed, carriage and lap top
controller. B) Example of an experimental configuration
showing the plastic cover used in all the runs, configured to a
width of 0.30 m at “low flow”. C) Laser profiler, D) Chute and
submerged sediment tank. ... 53
Figure 3.2 Transporting, non-transporting and dry areas of the flume bed.
Measures of a) Dry, b) Wetted, and c) Active widths where
obtained by measuring along 20 transects, spaced 0.50 m apart.
These measurements were made (“by hand”) while running an
experiment and also from photographic record ... 56
Figure 3.3 Relationship between wetted widths (in m) measured from
photographs (horizontal axis) and by hand (vertical axis). ... 59
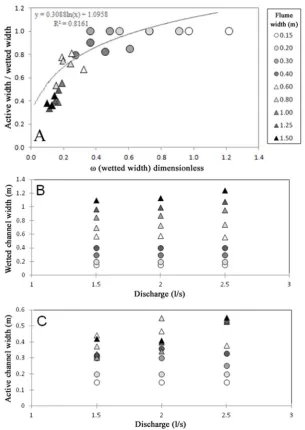
Figure 3.4 Wetted and active channel widths observed at different flume
widths (the three discharges are shown for each width using the
same symbol). ... 60
Figure 3.5 Relationship between (calculated for flume, wetted and
active width for three formative discharges) and flume width. ... 62
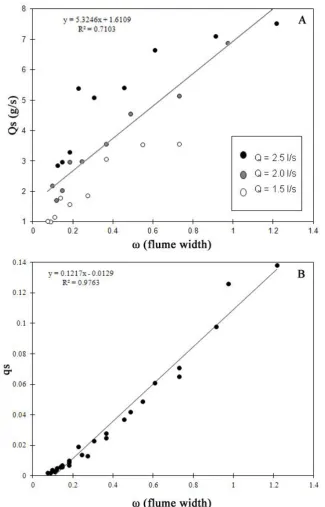
Figure 3.6 Mean sediment transport rate (left) and dimensionless sediment
transport rate (right) in relation to discharge across all flume
Figure 3.7 DTMs produced by a discharge of 1.5 l/s applied to different
flume widths. ... 65
Figure 3.8 DTMs produced by a discharge of 2.0 l/s applied to different
flume widths. ... 66
Figure 3.9 DTMs produced by a discharge of 2.5 l/s applied to different
flume widths. ... 67
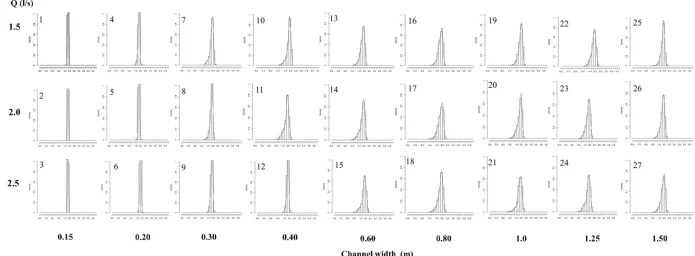
Figure 3.10 Bed elevation frequency distributions generated by different
combinations of discharge (vertical) and channel width
(horizontal). Each frequency distribution is labelled by run
number (1 to 27) and employs an equal bin size of 0.5 on the
horizontal axis with values ranging from -9 to +9. The vertical
axis expresses density with a minimum value of 0 and a
maximum of 1 for all of the runs. ... 68
Figure 3.11 Conceptual sketches of the impact of different bed elevation
kurtosis and skewness on the appearance of the cross profile of
a braided river. ... 69
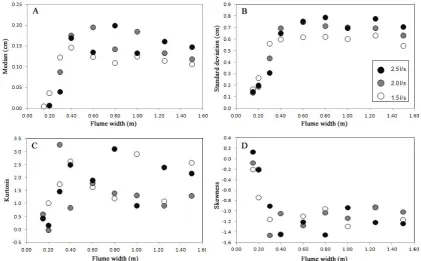
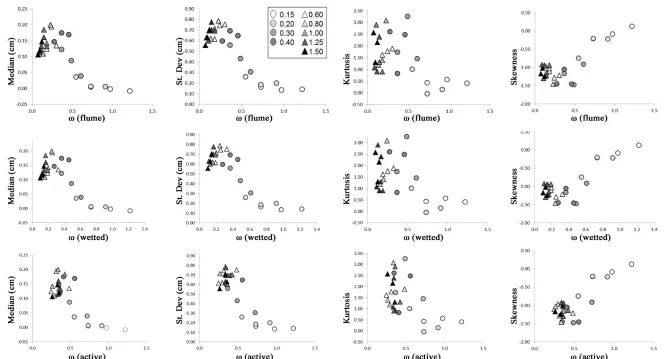
Figure 3.12 Variations in the A. median; B. standard deviation; C. kurtosis;
D. skewness of the bed elevation with flume width and
formative discharge... 70
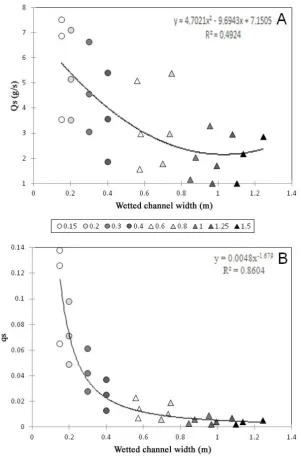
Figure 3.13 Scatter plots with indicative regression trend lines illustrating a
decline in A. mean sediment transport rate (Qs in g/s) and B.
dimensionless sediment transport rate (qs) with increasing
wetted channel width. The different symbols indicate the
presence (triangular markers) or absence (circular markers) of
mid-channel bars, and the colours indicate different flume
widths. ... 72
Figure 3.14 Scatter plots with indicative trend lines illustrating
relationships between (flume width) and A. mean sediment
transport rate (Qs in g/s) and B. dimensionless sediment
transport rate (qs) defined across the 27 experimental runs. ... 73
Figure 3.15 Scatter plots illustrating A) Changes in the ratio of active to
wetted width as flume width with increasing (with trend
line). B) Changes in wetted channel width with increasing
discharge. C) Changes in active channel width with increasing
Figure 3.16 Scatter plots illustrating relationships between stream power (
related to flume, wetted and active widths) and properties of
the channel morphology (median, standard deviation, skewness
and kurtosis of the elevation frequency distribution). The key
explains the symbols used for runs with different flume
widths). ... 76
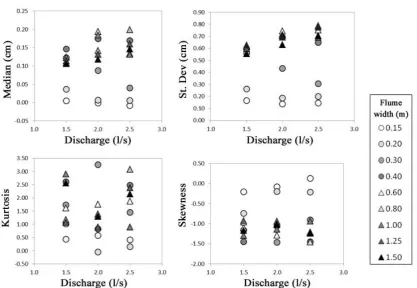
Figure 3.17 Variations in median, standard deviation, kurtosis and
skewness of the bed elevation frequency distribution with
changes in discharge. The key explains the symbols used for
the different widths. ... 78
Figure 3.18 Presence of mid-channel bars in relation to the four parameters
of the elevation frequency distribution (black dots are channels
without channel bars; white dots are channels with
mid-channel bars). ... 79
Figure 3.19 Frequency distributions of the differences in elevation between
the original runs (A) and their repetition (B) organized
vertically by discharge and horizontally by flume width. Each
of the distributions is labelled according to the original run
number with C to indicate the distribution relates to the
difference in elevation between runs A and B. The individual
horizontal axis for all of the figures is equally distributed in
bins with a 0.5 size, with a range value from -9 to +9, while the
vertical axis indicates density with a minimum value of 0 and a
maximum value of 1. ... 82
Figure 4.1 Detrended DEMs for 1 km reaches 1 to 19. Note that length
scales vary slightly between the three images. ... 97
Figure 4.2 Detrended DEMs for 1 km reaches 20 to 36. Note that length
scales vary slightly between the three images. ... 98
Figure 4.3 Relative elevation frequency distributions for 1 km reaches 1 to
9. ... 99
Figure 4.4 Relative elevation frequency distributions for 1 km reaches 10
to 18. ... 99
Figure 4.5 Relative elevation frequency distributions for 1 km reaches 19
Figure 4.6 Relative elevation frequency distributions for 1 km reaches 28
to 36. ... 100
Figure 4.7 Changes in a: standard deviation (m), b: elevation range (m), c:
skewness and d: kurtosis from reach 1 downstream to reach 36.
The dashed line denotes the downstream limit of the braided
reaches (reach 1 to reach 32). The arrows indicate reaches 23,
28, 29, 30, 31, 32, which are discussed later in section 4.4.2. ... 106
Figure 4.8 Scatter plots of skewness of the bed elevation frequency
distribution against the median (m), standard deviation (m),
and kurtosis. Left: scatter plots include all 1 km reaches; Right:
scatter plots for braided reaches only, with outlier reaches
indicated by their reach number. ... 108
Figure 4.9 Scatter plots of vegetation cover variables (unvegetated,
%vegetation > 1m, %vegetation > 5m, % vegetation > 10m)
against the standard deviation (a to d) and the median (e to h)
of the bed elevation frequency distribution for all 1 km reaches. ... 112
Figure 4.10 Scatter plots of vegetation cover variables (unvegetated,
%vegetation > 1m, %vegetation > 5m, % vegetation > 10m)
against the standard deviation (a to d) and the median (e to h)
of the bed elevation frequency distribution for braided reaches
only. ... 113
Figure 4.11 Scatter plots of vegetation cover variables (unvegetated,
%vegetation > 1m, %vegetation > 5m, % vegetation > 10m)
against the kurtosis (a to d) and the skewness (e to h) of the bed
elevation frequency distribution for all 1 km reaches. ... 114
Figure 4.12 Scatter plots of vegetation cover variables (% unvegetated,
%vegetation > 1m, %vegetation > 5m, % vegetation > 10m)
against the kurtosis (a to d) and skewness (e to h) of the bed
elevation frequency distribution for braided reaches only. ... 115
Figure 4.13 Changes in the cover of vegetation across the braid plain (a: %
unvegetated, b: % vegetated, c: % with vegetation taller than 5
m; d: % with vegetation taller than 10 m) from reach 1
downstream to reach 36. The dashed lines denotes the
downstream limit of the braided reaches (reach 1 to reach 32).
Figure 4.14 DTM and vegetation cover maps for nine of the 1 km reaches
upstream of reach 23. ... 118
Figure 4.15 DTM and vegetation cover maps for nine of the 1 km reaches
downstream of reach 22. ... 119
Figure 4.16 DTM and cross profiles for reaches 23, 28 and 29 (note
differences in the scales of the cross-sectional profiles). ... 121
Figure 4.17 DTM and cross profiles for reaches 30, 31 and 32 (note
differences in the scales of the cross-sectional profiles). ... 122
Figure 4.18 Scatter plots for the 36 Tagliamento reaches (left) and the 27
flume experiments (right) illustrating relationships between
skewness and the median, standard deviation and kurtosis of
the bed elevation frequency distribution. ... 124
Figure 5.1 Reach 2 of the Feshie River near Feshiebridge, a) shows a first
interpretation of the active channel, b) shows a second possible
interpretation of the active channel, referred to as “option 2”,
and c) shows the difference between the two interpretations of
the active channel. ... 131
Figure 5.2 In order to illustrate the process followed to determine
vegetated islands when measuring the Anabranching index (Ai)
the Tagliamento river section 9 is shown a) Island consist of a
closed canopy vegetation b) Islands consists of a combination
of closed canopy vegetation plus some adjacent discreet sparse
vegetation areas. ... 132
Figure 5.3 Four indices of planform (A. Bi; B. Si; C. Ai; D. Ai2) and unit
stream power for Q2 (E) and Q10 (F) plotted against active
channel width for the Tagliamento middle reaches. Each
symbol represents a different reach, with all image dates
marked using the same symbol for the reach. ... 145
Figure 5.4 Four indices of planform (A. Bi; B. Si; C. Ai; D. Ai2) plotted
against active channel width for the river Feshie reaches. Each
symbol represents a different reach, with all image dates
marked using the same symbol for the reach. ... 146
Figure 5.5 Time series plots of Bi, Si, Ai, Ai2 for one reach of the river
Figure 5.6 Scatter plots of A. unit stream power; B. Bi; C Si; D Ai; E Ai2
plotted against active channel width (the colours of the
symbols represent woodland vegetation with vigorous growth
(black), other woodland vegetation (grey), vegetation with few
trees (white)). ... 148
Figure 5.7 Scatter plots of A. Bi; B. Si; C. Ai; D. Ai2 plotted against
active channel width (the colours of the symbols represent
woodland vegetation with vigorous growth (black), other
woodland vegetation (grey), vegetation with few trees (white)). .... 150
Figure 5.8 (Left graphs) Scatter plots showing reach scores on the first
two PCs of three different PCAs. (Right graphs) Vectors
illustrating the loadings of the variables included in the PCA on
the first two PCs. ... 153
Figure 6.1 Schematic changes in the bed cross profile, associated with
shifts in skewness and kurtosis, as discharge and unit stream
power decrease and flume width increases. ... 162
Figure 6.2 Schematic downstream changes in the bed cross profile,
indicated by skewness and kurtosis of the bed elevation
frequency distribution, along the 36km length of the
Tagliamento River. ... 164
Figure 6.3 Distinct elevated areas (red polygons) within reaches 23, 28-32
that are represented as bumps and secondary peaks on the bed
elevation frequency distribution, support mature riparian
vegetation and may represent areas of the braid plain isolated
List of Tables
Table 2.1 Characteristics of suspended, mixed and bedload dominated
alluvial channels (after Schumm 1963). ... 30
Table 2.2 Characteristics of alluvial channels according to the mode of
sediment transport (developed from Schumm (1963a) by
Church (2006)). ... 31
Table 2.3 Role of vegetation in 7 of the 8 anabranching (sub)types
identified by Nanson and Knighton (from Gurnell et al., 2009). .... 39
Table 3.1 Channel width, slope and discharge utilised in each
experiment, the run time for the initial experiment (8T), and for
any repetition runs (RT). ... 54
Table 3.2 Summary information on wetted, dry and active channel widths
and related stream power, sediment transport rate and bed
elevation frequency distribution of the 27 experimental runs. ... 61
Table 3.3 Summary information on run length (hr), discharge (Q in l/s),
and the parameters (median, standard deviation, kurtosis,
skewness) of the bed elevation frequency distribution for runs
A and B and of the frequency distribution of the difference in
elevation between A and B, which is labelled C. ... 81
Table 3.4 1Observed BI, and estimated bar types, bar mode (m) and BI
based upon 2Colombini, Seminara and Tubino (1987) and
3
Crosato and Mosselman (2009) for values of their parameter b
of 10 (recommended for gravel bed rivers) and 5.
(M=meandering, T = transitional, B = braided). ... 86
Table 4.1 Description of the shape of the frequency histograms in Figures
4.3 to 4.6 according to five types (where specified, L and R
refer to the location of the ‘bump’ or secondary peak on the left
or right side of the histogram). ... 101
Table 4.2 Descriptive statistics of the bed morphology of thrity-six 1 km
reaches of the Tagliamento river based on the analysis of lidar
data from early spring 2001. ... 104
Table 4.3 Product moment correlations among channel width and
properties of the bed elevation frequency distribution (median
elevation, standard deviation, skewness, kurtosis, and elevation
range) across the 36 1km reaches and the 34 braided reaches
(emboldened correlations are statistically significant (p<0.05),
italicised correlations are not statistically significant). ... 107
Table 4.4 Product moment correlation coefficients between channel bed
morphological and vegetation variables for all reaches and only
braided reaches (emboldened correlations are statistically
significant (p<0.05), italicised correlations are not statistically
significant). ... 110
Table 5.1 The six rivers selected for study, their location, the number of
reaches selected and the number of years for which data were
available for analysis... 129
Table 5.2 Information extracted from satellite and aerial images for the
study rivers, river reaches and dates. ... 133
Table 5.2 Table 5.2 continued... 134
Table 5.2 Table 5.2 continued... 135
Table 5.3 Discharge, d50 and stream power estimates for the studied
reaches. ... 138
Table 5.3 Table 5.3 continued... 139
Table 5.3 Table 5.3 continued... 140
Table 5.4 Planform indices and active channel widths derived from
applying options 1 and 2 to five river reaches... 142
Table 5.5 Correlations among different stream power indices ( * is total
stream power, ** is unit stream power, and *** is
dimensionless stream power; Q2, Q5, and Q10 refer to the
discharges for which the three different stream power indices
are estimated)... 143
Table 5.6 Eigenvalues, variability explained and variable loadings on the
first four PCs of a PCA on Bi, Si, Ai, Ai2, slope, and channel
width (all loadings >0.7 are emboldened). ... 151
Table 5.7 Eigenvalues, variability explained and variable loadings on the
first four PCs of a PCA on Bi, Si, Ai, Ai2, slope, and channel
Table 5.8 Eigenvalues, variability explained and variable loadings on the
first four PCs of a PCA on Bi, Si, Ai, Ai2, slope, and channel
Chapter 1
Introduction
This thesis is concerned with braided rivers, the controls on their morphology and their
transition to single-thread forms. The research commences by investigating the
three-dimensional morphology of braided and transitional rivers and the degree to which this
is influenced by channel confinement and discharge. The association between riparian
vegetation and the three-dimensional morphology of braided and transitional reaches of
a single river are then investigated to develop understanding of the ‘topographic
signature of vegetation’. Finally, a sample of braided and transitional rivers with
different width, slope, discharge and riparian vegetation are investigated to assess the
degree to which the influence of vegetation can be identified as other factors controlling
river morphology also vary.
Chapter 2 provides a brief review of the literature on alluvial river channel styles and
the braid-meander transition. It sets the scene for proposing the three research questions
that are investigated in the thesis (section 2.5). Each of these three research questions is
investigated in a separate Chapter (Chapters 3, 4 and 5). Each of these Chapters is
written as a free-standing piece of research. As a result, the relevant detailed literature is
reviewed within each of Chapters 3, 4 and 5, and Chapter 2 serves as a broad and
relatively brief context for the research rather than an exhaustive review of the relevant
literature.
The thesis uses a combination of research methods to address the three research
questions. Experiments are conducted in a laboratory flume. Different remotely-sensed
data sets are then analysed to investigate the characteristics of real braided and
transitional rivers. Airborne lidar, colour and panchromatic air photographs, and
satellite images are all analysed using both image processing and GIS software. In
addition, statistical analyses are applied to several of the derived data sets. These
methods provide the focus for each of chapters 3, 4 and 5, with laboratory flume
research presented in Chapter 3; the analysis of airborne lidar data presented in Chapter
The research results combine to provide new scientific insights into several aspects of
braided and transitional rivers. These results are of both scientific and management
interest, but, as explained in Chapter 6, further research is needed to transform these
new insights into quantitative tools that can be directly applied in river restoration and
Chapter 2
Developing a Process-based Understanding of Alluvial River
Channel Styles: A Brief Introduction to the Braid-meander
Transition
2.1 INTRODUCTION
The research reported in this thesis focuses on braided rivers, including both their
characteristics and how these differ from narrower transitional river forms. Each of the
following three research chapters (Chapters 3, 4 and 5) reviews relevant literature and
so this chapter provides a brief overview of braided rivers in the context of the
continuum of river types that have been identified. In doing this, some of the key
controls on braided and transitional rivers are outlined, providing support for the
research questions that are posed at the end of the chapter (section 2.6).
To provide a brief context for the following research, this chapter outlines the historical
development of research concerning alluvial channel styles with a particular emphasis
on the transition between single thread (meandering) and multi-thread (braiding) styles,
and the apparent controls on this transition. Research on this theme has passed through
three main historical phases from early descriptive approaches to approaches that
incorporate controls and processes in an increasingly quantitative way. Here, these
phases are called: (i) the descriptive era (section 2.2); (ii) incorporating process
understanding: discharge, sediment and gradient controls (section 2.3); and (iii) the role
of riparian vegetation (section 2.4).
2.2 THE DESCRIPTIVE ERA
Until the 1950s, descriptive classifications of rivers were prevalent. The following three
pieces of work are influential in different ways.
In relation to terminology, Jackson (1834) provided one of the earliest examples of the
application of a classificatory approach to river planforms when he applied, for the first
a single channel at one point and re-joins further downstream (Carling et al., 2013),
formally discriminating between single-thread and multi-thread planforms.
Probably the best known early classification of rivers was proposed by Davies (1899),
who defined three adaptation stages in river style development (youthful, mature, old
age). These were linked to phases of landscape development or denudation and so were
inherently linked to land surface gradient and bed sediment calibre. When the stages
were applied as an upstream to downstream sequence, they were also linked inherently
to river discharge.
Alabayan and Chalov (1998) describe research that was published at about the same
time as Davies’ work but has received far less attention. Lokhtin (1897) anticipated the
more quantitative, process-based approaches that emerged in the 20th century. Well
ahead of other researchers, Lokhtin suggested that there were three main independent
factors that controlled river forms: the discharge regime, the slope or gradient
(influenced by the relief of the area crossed by the river), and the erodibility of the river
bed (which varies according to the sediment properties). He proposed a ‘channel
development criterion’, the ratio of stream power (discharge combined with gradient)
and bed erodibility represented by bed material grain size, where low values of the
criterion corresponded to stable meandering streams and high values to unstable braided
streams. These factors form the basis of developments during the period of increased
process understanding (section 2.3).
2.3 INCORPORATING PROCESS UNDERSTANDING: DISCHARGE, SEDIMENT AND GRADIENT CONTROLS
Although much of the early work suggested possible process controls on river style, the
first quantitative links between fluvial processes and forms were proposed in the mid
1950s. Two pieces of research by Lane (1957) and Leopold and Wolman (1957) were
particularly influential.
Lane (1957) suggested a qualitative relation that represented the governing conditions
responsible for the different morphologies of alluvial channels (braided, intermediate
and meandering):
where Q represents discharge of water, Qs represents discharge of sediment, D is
sediment calibre, and S is the slope. Thus the equation links river discharge, sediment
size and load (availability), and topographic gradient.
In a similar analysis, Leopold and Wolman (1957) provided a quantitative definition of
an apparent threshold between meandering and braided planforms. Although Leopold
and Wolman (1957) suggested that rivers should be conceptualized as a continuum of
different patterns, they subdivided rivers into three main planform styles (straight;
meandering; braided) and they quantified the transition between meandering and
braided patterns as a relationship between discharge (Q) and channel slope (S) (Figure
2.1):
S=0.012Q-0.44
In both of these examples, the selection of an appropriate value for Q is open to debate
but Leopold and Wolman (1957) selected the ‘bankfull discharge’ for the graph
depicted in Figure 2.1. They also suggested six variables as the main controls on
channel pattern in natural environments (i.e. discharge, slope, width, depth, velocity,
and roughness), later adding sediment load and sediment size to the list (Leopold et al.,
1964). Although subsequent research has shown that all of these variables are associated
with river channel style, they are not independent of one another.
Between 1960 and 2000, researchers built on the above work, progressively
incorporating greater detail concerning fluvial processes into the discrimination of
channel styles, and incorporating quantitative analyses based upon the aggregation of
field data from as many sites as possible. The properties of fluvial sediments (calibre,
Researchers working in different river environments further developed the relationship
proposed by Leopold and Wolman (1957, Figure 2.1) by estimating different
slope-discharge threshold conditions based on bankfull or mean annual flood slope-discharge to
represent Q and channel or valley slope to represent S. They showed that sediment size
was an additional crucial factor in discriminating meandering – braiding threshold
conditions (e.g. Osterkamp, 1978; Begin, 1981; Bray 1973, 1982; Carson, 1984a and b;
Ferguson, 1987; van den Berg, 1995), and developed these relationships using larger
data sets (e.g. Ferguson, 1987, Knighton and Nanson, 1993, Beechie et al., 2006) to
define new thresholds (e.g. Church 2002) within the data space shown in Figure 2.1.
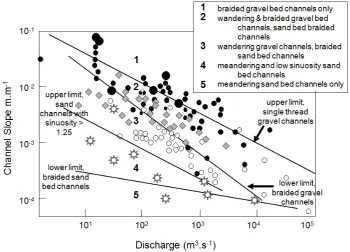
The addition of new data revealed that sites show a gradual transition across the plot
according to bed material calibre, with predominantly gravel bed, braided and
wandering streams plotting above the Leopold and Wolman (1957) transition line and
streams with predominantly sand and finer bed sediment plotting below the line (Figure
2.2). In this analysis, ‘wandering’ is defined as a transitional, gravel-bed channel style
described by Desloges and Church (1989, p360) as ‘irregularly sinuous channels,
sometimes split about channel islands and in some places braided’. Following a deeper
analysis, Church (2002) proposed different channel style thresholds depending on bed
sediment calibre (gravel or sand, Figure 2.3).
Figure 2.3 Association between river planform style, discharge, slope and bed sediment calibre (data sources as for Fig. 2.2, thresholds between styles from Church 2002). (from Gurnell et al., 2009).
Whilst this simple graphical approach incorporated bed sediment calibre, the
incorporation of sediment supply required a slightly different approach, which was
initiated by Schumm during the 1960s to 80s.
Schumm (1963) subdivided rivers according to their alluvial sediment calibre and thus
the predominant mode by which they transported sediment (suspended, mixed, bedload
channels), assigning ranges of channel gradient, width to depth ratio, and sinuosity to
each mode and describing the way in which channels associated with each transport
Table 2.1 Characteristics of suspended, mixed and bedload dominated alluvial channels (after Schumm 1963).
Stable Depositing Eroding Suspended
Load (%) Bedload (%) Suspended load channels
w/d < 7 sinuosity > 2.1 Gradient gentle
Major deposition on banks leads to
narrowing Dominant bed erosion Widening minor 85 15 Mixed load channels w/d 7-25 sinuosity 1.5-2.1 Gradient moderate Initial major deposition on banks followed by deposition on
bed Initial bed erosion followed by channel widening 65 35 Bedload channels
w/d > 25 sinuosity < 1.5 Gradient moderate
Bed deposition and bar and island formation Widening dominant Little bed esosion 30 70
Schumm’s subdivision of suspended, mixed and bedload alluvial channel types was
further subdivided and extended into boulder-bed and silt-clay channels by Church
(2002, 2006), providing a more detailed association between sediment transport mode
Table 2.2 Characteristics of alluvial channels according to the mode of sediment transport (developed from Schumm (1963a) by Church (2006)).
River Type / Characteristic
Shields number
Sediment
type Sediment transport regime Channel morphology Channel stability
Jammed channel 0.04+ Cobble or boulder-gravel
Bed load dominated; low total transport but subject to debris
flow.
Tep-pools or boulder cascades; width typically a low multiple of largest boulder
size; S > 3o.
Stable for long periods with throughput of bed load finer than structure-forming clasts; subject to
catastrophic destabilisation in debris flows.
Threshold channel
0.04+
Cobble-gravel
Bed load dominated; low totaltransport in partial transport
regime; bedload may actually be less than 10% total load.
Cobble-gravel channel bed; single thread or wandering; highly structured bed; relatively steep; w/d > 20 except in headwater boulder
channels.
Relatively stable for extended periods, but subject to major oods causing lateral channel instability
and avulsion; may exhibit serially reoccupied secondary channels
Threshold channel up to 0.15
Sandy-gravel to
cobble-gravel
Bed load dominated, but possibly high suspension load; partial transport to full mobility;
bed load typically 1%–10% of total load
Gravel to sandy-gravel; single thread to braided; limited, local bed structure; complex bar development by lateral accretion; moderately steep; low sinuosity;
w/d very high (>40)
Subject to avulsion and frequent channel shifting; braid-form channels may be highly unstable, both laterally and vertically; single-thread channels
subject to chute cutoffs at bends; deep scour possible at sharp bends
Transitional channel 0.15–1.0
Sand to ne-gravel
Mixed load; high proportion moves in suspension; full mobility with sandy bedforms
Mainly single-thread, irregularly sinuous to meandered; lateral/point bar development
by lateral and vertical accretion; levees present; moderate gradient; sinuosity <2;
w/d < 40
Single-thread channels, irregular lateral instability or progressive meanders; braided channels laterally unstable; degrading channels exhibit
both scour and channel widening
Labile channel >1.0 Sandy channel bed, ne-sand to silt banks
Suspension dominated with sandy bedforms, but possibly signi cant bedload moving in
the bedforms
Single thread, meandered with point bar development; signi cant levees; low
gradient; sinuosity >1.5; w/d < 20; serpentine meanders with cutoffs
Single-thread, highly sinuous channel; loop progression and extension with cutoffs; anastomosis possible, islands are defended by vegetation; vertical accretion in the oodplain;
vertical degradation in channel
Labile channel up to 10
Silt to sandy channel bed, silty to clay-silt banks
Suspension dominated; minor bedform development; minor
bed load
Single-thread or anastomosed channels; prominent levees; very low gradient; sinuosity > 1.5; w/d < 15 in individual
channels
Single-thread or anastomosed channels; common in deltas and inland basins; extensive wetlands
and oodplain lakes; vertical accretion in oodplain; slow or no lateral movement of
Schumm (1985) used the three modes of sediment transport from Table 2.1 to produce a
qualitative classification of river styles (Figure 2.4), which formed the basis of
subsequent, more complex classifications. For example, Ferguson (1987) produced the
modified diagram shown in Figure 2.5, concluding that at lower slopes and similar
discharge, sand-bed rivers braid more easily than gravel-bed ones, and that the bank
erosion needed for braiding requires a greater gradient than a meandering pattern at a
given discharge. The diagram also recognizes the potential importance of bank
vegetation for bank strength; identifying that inactively meandering (and anastomosing)
channels possess strong banks that are hard to erode (Figure 2.5).
Schumm’s (1985) diagram (Figure 2.4) was also revisited by Church (1992, 2006), who
incorporated channel descriptions from Mollard (1973) to introduce a wider range of
channel styles (Figure 2.6).
In Figure 2.6 only three commonly-recognised multi thread river styles are identified:
wandering, braiding and anastomosing. However, some researchers have given the
classification of multithread rivers particular attention. For example, Nanson &
Knighton’s (1996) identified eight (sub)types of anabranching (multi-thread) channel
systems according to stream power, sediment calibre, vertical and lateral stability and
morphological characteristics (sinuosity, island size and shape, Figure 2.7) and located
them on the Leopold and Wolman (1957) Q-S plot (Figure 2.8).
The classification proposed by Rosgen (1994), which is widely applied by stream
managers across the United States, is based heavily on the above work. Rosgen justifies
his approach by stating that:
‘Stream pattern morphology is directly influenced by eight major variables
including channel width, depth, velocity, discharge, channel slope, roughness of
channel materials, sediment load, and sediment size (Leopold et al., 1964). A
change in any one of these variables sets up a series of channel adjustments
which lead to a change in the others, resulting in channel pattern alteration.
Because stream morphology is the product of this integrative process, the
variables that are measurable should be used as stream classification criteria’
Figure 2.4 Channel styles associated with different modes and calibres of sediment transport, stream power, sediment calibre and sediment load (after Schumm, 1985).
Figure 2.7 Approximate distribution of specific stream power, bed and bank sediment calibre, lateral migration rate, vertical accretion rate, channel sinuosity and island length/channel width ratio for eight types / subtypes of anabranching river (from Nanson and Knighton, 1996).
Thus, Rosgen’s scheme, although based on a multi-level hierarchy of four inventories
(geomorphic characterisation, morphological description, condition, verification) and
developed from ‘field observation of hundreds of rivers of various sizes in all the
climatic regions of North America, experience in stream restoration, extensive teaching,
and practical applications of the classification system by many hydrologists,
geomorphologists, fisheries experts, and plant ecologists’ (Rosgen, 1994, p173),
essentially defines river type at level 1 (i.e. geomorphic characterisation) by slope, cross
section (entrenchment ratio, width : depth ratio), plan view (sinuosity /
single-/multi-thread) and dominant bed material.
In the last decade, considerable advances have been made in classifying channels based
on both empirical and physics-based theoretical analyses of bar development. Since
channel patterns (e.g. meandering, braided) and their subdivisions are closely related to
the nature of the bars that are present, the nature of bars provides a new addition to the
factors that can be used to distinguish channel types. Kleinhans and van den Berg
(2011) provide a recent review of this topic, in which they describeed the bar regimes /
bar modes developed theoretically by Parker (1976); Struiksma et al., 1985; Mosselman
et al., 2006, and Crosato and Mosselman (2009). They classified ‘natural’ channel
patterns from Google Earth images (available at: https://www.google.com/earth/) using
the active braiding index and the presence of scroll bars, chute bars and scrolled point
bars. Single-thread river patterns were subdivided into meandering with chute bars,
meandering with scroll bars, and stable straight or sinuous rivers. Braiding intensity was
quantified by the braiding index, de ned as the average cross sectional number of
active, unvegetated or barely vegetated braids. They illustrated a new empirical
prediction of these bar and channel patterns on a plot of ‘potential specific stream
power’ against median bed material grain size (D50) (Figure 2.9). ‘Potential specific
stream power’ is similar to specific stream power but it corresponds to a straight
channel (sinuosity=1) and thus incorporates valley slope rather than channel slope;
channel-forming discharge; a reference channel width which is independent of actual
(pattern-dependent) channel width and is estimated from bed material size and
channel-forming discharge. This development of classification based on bar properties is a very
active area of current research, which, nevertheless, has roots in the work of Leopold
and Wolman (1957) and will undoubtedly lead to further refinement of channel
Recently, Eaton et al. (2010) have also incorporated anabranching channels into the
Leopold and Wolman Q-S plot by adding a third axis describing bank strength (Figure
2.10). This, to some extent, reflects the role of riparian vegetation and so leads this
review to consider the specific role of riparian vegetation in controlling channel
planform.
Figure 2.10 Channel pattern discriminant functions expressed as a function of slope, discharge and relative bank strength (from Eaton et al., 2010).
2.4 THE ROLE OF RIPARIAN VEGETATION
At an early stage, Leopold and Wolman (1957) mentioned vegetation in association
with river style, but they did not recognise it as a control on style only as a passive
feature of areas where fluvial disturbance was relatively low.
Many researchers have indicated the potential importance of vegetation for river style
and dynamics. For example, through an empirical analysis of relationships among
bankfull discharge and channel dimensions of gravel-bed streams in the UK, Hey and
Thorne (1986) showed that bank vegetation provided an important explanatory variable,
providing an early indicator of a link between vegetation and channel form /
dimensions. Smith et al (1991) provided quantitative underpinning of the importance of
vegetation when they showed that river banks covered by short alpine vegetation had a
and Griffin and Smith (2004) observed ‘floodplain unravelling’ (river transformation
from a single to multi-thread channel pattern) as a result of extreme flood events
following heavy grazing of floodplain woody vegetation, which suggested a role of
woody vegetation in controlling the threshold between single thread and multi thread
channel patterns. Also Beechie et al (2006) inferred that tree rooting depth was an
important control on channel lateral migration from their analysis of channel style and
vegetation patch age and diversity across straight – meandering - island braided - bar
braided rivers. Moreover, Nanson and Knighton’s (1996) classification of anabranching
river systems, although explicitly discriminated using physical properties, implicitly
identified vegetation properties as discriminators of 7 of the 8 anabranching (sub)types
(Table 2.3). Finally, based on field observations of riparian tree growth performance,
Gurnell et al. (2009) conceptualised how the rate of riparian tree establishment and
growth might affect the threshold stream energy at which planform pattern might
change (Figure 2.11).
Table 2.3 Role of vegetation in 7 of the 8 anabranching (sub)types identified by Nanson and Knighton (from Gurnell et al., 2009).
Type Number Type Name Stated role of vegetation (page in Nanson and Knighton, 1996)) Low Energy Group
Type 1 subtype a
Organic Systems
‘aggradation of bedload and the concomitantgrowth of aquatic vegetation constricts channel flow inducing periodic avulsion‘ (224)
Type 1 subtype b
Organo-Clastic Systems
‘resistant, well-vegetated banksprotect swampy, levee-banked islands’ (224)
Type 2
Sand-Dominated, Island-Forming
‘requires the combination of stabilizing bank vegetation and low stream energy to prevent the channel from braiding or meandering’ (224-5)
Higher Energy Group
Type 4
Sand-Dominated Ridge-Forming
‘these ridges commonly form in wide sandy channels as the result of within-channel tree growth acting as an obstruction to flow’ (227)
Type 5
Gravel-Dominated, Laterally-Active
‘anabranching sections .. appear to be initiated by enhanced bed-sediment input … the periodic formation oflog or ice jams may augment this process’ (229), ‘Avulsion channels incise into existing floodplains, but in some cases islands grow vertically to floodplain height from large bars stabilized by vegetation within the channel’ (230)
Type 6
Gravel-Dominated,
Stable
Figure 2.11 Conceptual model of associations between tree growth performance, flood magnitude/frequency and channel style. Sediment supply is assumed to be sufficient to support the different channel styles. Three trajectories of riparian tree growth (solid lines) from seedling / sapling, through shrub, young and mature tree stages (dashed lines) according to different growing conditions are compared with the range in the maximum time period between floods capable of uprooting trees across the three trajectories (thin grey arrows) to prevent transitions between the given river planform styles (italic text) (from Gurnell et al., 2009).
The importance of vegetation growth and establishment for braided river morphology
has been demonstrated empirically by Bertoldi et al. (2011a), who through the analysis
of properties of the vegetation cover and the bed elevation distribution of 21 reaches of
the Tagliamento River, Italy, identified a ‘topographic signature of vegetation
development’.
Building on field observations, laboratory flume experiments have investigated many
aspects of the influence of vegetation on channel form and dynamics and have
confirmed relationships observed in the field (e.g. Gran and Paola, 2001, Tal and Paola,
focussed on bank stability. Particularly notable was the research by Millar (2000), who
developed an improved theoretical meandering-braiding transition criterion
incorporating the influence of riparian vegetation on bank stability. This has been
developed in subsequent research by Eaton et al. (2010), where it has been incorporated
into a number of useful graphics including the Leopold and Wolman (1957) Q-S plot
(Figure 2.9) mentioned previously.
An important aspect of the role of vegetation as a control on channel style is that
vegetation growth performance is itself dependent upon hydrological processes,
particularly the river flow regime, and in some cases also the water retentive
characteristics of riparian soils. This suggests that extremely complex interactions
between vegetation growth, river discharge / moisture availability and sediment
dynamics may govern variations in river channel style across space and time. This is a
topic that has received remarkably little research attention, although Gurnell (2014)
provides a recent review.
2.5 CONCLUSIONS
More than a century of research has revealed the importance of four main groups of
factors in influencing channel style: discharge, gradient, sediment and vegetation.
However, the precise nature of these controls is complex and includes many potential
interactions and feedbacks. As a result, there are numerous questions that remain
unanswered and thus many potentially-fruitful research paths to pursue. For example,
Kleinhans (2010) recently listed the following 9 questions relevant to channel styles that
require further research:
1. What is the role of flow strength and variation in flooding magnitude and
frequency on the pattern?
2. What is the effect of the nature, magnitude, and variation of upstream sediment
feed on patterns?
3. Is added bank strength due to sorting of fines and bed sediment a sufficient
condition for meandering, and is vegetation also a sufficient condition? What
extra interactions and feedbacks on channel pattern would arise if both occur?
4. What is the role of bar pattern and sorting at the bar scale? Is the emergence of
gravel-bed rivers? To what extent do small-scale sorting processes cause large
scale sorting patterns relevant for channel pattern?
5. In what parameter space of vegetation, fine sediment deposition (density, size,
thickness) and flooding (magnitude, and frequency) do transitions between river
patterns take place?
6. In what manner, to what extent and why do channel patterns and their causes in
small rivers (1 m width) differ from those in large rivers (10 km width)?
7. What are the necessary conditions and time-scales for transitions between river
patterns in response to changes in forcings?
8. How do channel patterns develop when the initial condition is another channel
pattern rather than a hypothetical plane valley?
9. Are there hard thresholds (rather than transitions) that the system can cross during
changing forcings due to extreme events? Can such threshold crossings lead to
hysteretic or irreversible change due to vegetation or inherited floodplain
structure?
2.6 RESEARCH QUESTIONS
The present research is concerned with braided rivers and their transition to
single-thread forms. Based on the above review, and particularly developing from section 2.4,
the research aims to investigate the impact of confinement imposed by unerodible
(valley width) or cohesive (sediment, vegetation) banks on braided and transitional
rivers through the following research questions:
1. What are the influences of variations in discharge and river confinement on river style and bed morphology? These two factors are explored experimentally in Chapter 3 where they allow consideration of the impact of natural (valley or
cohesive bank) or human-induced (embanking and bed reinforcement)
confinement on the transition from single-thread to braided channel patterns and
the degree to which these are influenced by variations in (fixed) formative
discharge.
2. What is the influence of vegetation on braided and transitional river morphology? This is explored in chapter 4 across 36 1km reaches of a natural river that are subject to similar peak discharges, slope and bed material but display
3. Does the type and extent of vegetation influence / co-vary with braided river planform? This question is explored in Chapter 5 across a selection of European braided rivers that display different amounts and types of vegetation but also
different discharge regimes, slope and bed material. Google Earth images from
different dates allow variations in river planform and vegetation extent to be
compared through time, whereas comparisons among a sample of different rivers
Chapter 3
Flume Experiments to Investigate Braided Channel
Development Under Controlled Conditions
3.1 INTRODUCTION
Although humans have long had an interest in different channel morphologies,
significant progress in understanding the variety of morphologies that may occur and
potential controlling processes commenced during the second half of the 20th century
(see Chapter 2). Over the last 70 years, much research has focused on quantifying the
properties of individual rivers, characterising the recurring properties of
geomorphological features such as pools, riffles, bars, islands and associated
bifurcations, and understanding the controls on the development of rivers of different
type and their specific geomorphological features.
This chapter aims to contribute to this field of study by manipulating several potential
controls on channel morphology and observing the morphological response to those
manipulations within a laboratory flume. The focus of these experiments is to
investigate the conditions under which multi-thread braided patterns develop as
discharge and channel width change under a constant slope and grain size and a
sediment supply that, through recirculation, matches the sediment transport rate. These
experiments form a first phase in the research reported in this thesis, which investigates
braided river morphologies in the laboratory and in field situations, gradually increasing
the range and complexity of the potential controlling factors.
To provide a context for the laboratory experiments, this introductory section defines
braided rivers (section 3.1.1); and briefly reviews how researchers have described and
quantified braided river morphology (3.1.2), and the controls on braiding that have been
identified (3.1.3). The section ends by listing the research questions that are investigated
3.1.1 Definitions of “Braiding”
Braided rivers develop in non-cohesive sediments composed predominantly of cobble,
gravel, and / or sand grain sizes and are characterised by flows of water and sediment in
multiple channels that diverge and converge at points that are called nodes (Lane, 1957,
Bertoldi et al., 2009b). The individual channel threads vary greatly in size through time
and space, and are separated by bars which may vary widely in their stability but are
mainly unvegetated (Ashmore, 2009, Bertoldi et al., 2009b). However, where bars
remain stable for a sufficient time, vegetated islands may form, giving rise to an
island-braided morphology. The multiple threads of island-braided rivers are highly dynamic and
complex (Brierley and Fryirs, 2008, Ashmore, 1990). Their planform and altimetry
change rapidly during flood flows as a result of widespread sediment erosion and
deposition, generating channel avulsions and inducing the formation and destruction of
bars (Ashmore, 1982, Charlton, 2007, Chew and Ashmore, 2001, Jerolmack and
Mohrig, 2007, Miall, 1977, Ashmore, 2013). These dynamics provide a wide diversity
of physical and hydraulic habitats, frequent habitat turnover and, particularly in the case
of island braided rivers, a very complex and rich habitat mosaic that supports extremely
high biodiversity (Tockner et al., 2003, 2006).
3.1.2 Quantifying Properties of Braided Channel Form
As braiding is highly complex and also dynamic, this river planform presents
considerable challenges to those attempting to quantify channel properties and their
variations between rivers and also through time on the same river. Quantification of
braiding properties has traditionally been based on three groups of measures:
(a) The average number of channels across the river cross section or braid plane
(Ashmore, 1990, Chew and Ashmore, 2001, Friend and Sinha, 1993, Howard et
al., 1970, L.B. and Davies, 1979),
(b) The total channel length within a given length of the river course or braid plane
(Ashmore, 1990, Hong and Davies, 1979, Mosley, 1982, Richards, 1982,
Robertson-Rintoul and Richards, 1993, Smith et al., 1996),
(c) Bar dimensions and frequencies (Brice, 1960, Brice, 1964, Germanoski and
Schumm, 1993, Rust, 1977).
All of these approaches represent means of counting and measuring the complexity of