Doctoral School in Materials Science and Engineering
Single Polymer Micro-‐ and Nano-‐ Composites
Thiago Medeiros Araujo
April 2013
XXV
c
y
c
S
INGLE
P
OLYMER
M
ICRO
-‐
AND
N
ANO
-‐
C
OMPOSITES
Thiago Medeiros Araujo
E-‐mail: [email protected]
Approved by:
Prof. Alessandro Pegoretti, Advisor Department of Industrial Engineering. University of Trento, Italy.
Ph.D. Commission: Prof. Paolo Scardi,
Department of Civil, Environmental and Mechanical Engineering.
University of Trento, Italy.
Prof. Siegfried Schmauder,
Institute of Materials Testing, Materials Science and Strength of Materials (IMWF).
University of Stuttgart, Germany.
Prof. Chia-‐Kuang (Frank) Tsung, Merkert Chemistry Center, Department of Chemistry
Boston College, USA.
University of Trento, Italy. Department of Industrial Engineering
University of Trento - Department of Industrial Engineering
Doctoral Thesis
Thiago Medeiros Araujo - 2013
Published in Trento (Italy) – by University of Trento
ISBN: 978-88-8443-476-0
This work is licensed under the Creative Commons Attribution-NonCommercial 3.0 Unported License. To view a copy of this
license, visit
A
BSTRACTDue to an increasing attention to environment preservation and the need to accomplish new regulations, a general interest to improve the recyclability of composite materials has recently emerged. In order to fulfill this new requirements, a possible strategy could be represented by the development of so-called "single polymer composites" (SPCs), i.e. composite materials in which both matrix and reinforcement have the same chemical composition. The main advantage of SPCs is that, unlike traditional heterogeneous composites (such as glass- or carbon reinforced polymer composites), they can be entirely melted down at the end of the product life for recycling.
After an optimization of the annealing treatment to improve the mechanical properties and thermal stability of the reinforcing phase, SPCs containing Vectran® micro- and nano- fibers as a reinforcement were prepared, and their thermo-mechanical properties and recyclability were investigated using a multidisciplinary approach.
Single polymer micro composites (SPMCs) containing up to 30 wt% of reinforcing microfibers showed a outstanding improvement of tensile modulus (up to 160 %) compared with the unfilled matrix. FESEM observations evidenced some pull-out phenomena, indicating a poor interfacial adhesion. After a surface treatment on the reinforcement, a composite containing up to 20 wt% showed a remarkable improvement of almost 180% in the tensile modulus compared with the unfilled matrix. FTIR and thermal analysis evidenced its recyclability.
Single polymer nano composites (SPNCs) containing up to 10 vol% of reinforcing nanofibers showed an increase by almost 20% of their tensile modulus and strength in comparison with the unfilled matrix. Optical observations revealed a consolidation problem in the unfilled matrix due to the adapted film-stacking process used. However, the addition of the nanofibers in the composite eliminated the problem. Thermal analysis was used to ensure the SPNCs recyclability.
T
ABLE OFC
ONTENTSABSTRACT ... V
TABLE OF CONTENTS ... VI
LIST OF FIGURES ... IX
LIST OF TABLES ... XII
LIST OF ABBREVIATION AND ACRONYMS ... XIII
CHAPTER I
INTRODUCTION ... 1
CHAPTER II
BACKGROUND ... 4
2.1
Micro-‐ and nano-‐ composites ... 4
2.1.1
Single Polymer Composites ... 4
2.2
Liquid crystalline polymers ... 6
2.2.1
Classification and physical structure of liquid crystalline polymers ... 7
2.2.2
Classification and chemical structure of liquid crystalline polymers ... 10
2.2.3
Liquid crystalline polymer fibers ... 12
2.2.3.1
Vectran® ... 13
2.3
Electrospinning ... 16
2.4
Predictive models ... 20
CHAPTER III
E
XPERIMENTAL... 24
3.1
Materials ... 24
3.2
Composites preparation and characterization
...
25
3.2.1
Single Polymer Micro Composites (SPMCs) ... 25
3.2.1.1
Sample preparation ... 25
3.2.1.2
Annealing treatment ... 25
3.2.1.3
Plasma treatment ... 26
3.2.1.4
Thermal analysis ... 26
3.2.1.6
Infrared spectroscopy ... 27
3.2.1.7
Observations ... 27
3.2.2
Single polymer nano composites (SPNCs) ... 27
3.2.2.1
Sample preparation ... 27
3.2.2.2
Vectran® nanofibers preparation ... 28
3.2.2.3
Heat treatment ... 28
3.2.2.4
Thermal analysis ... 28
3.2.2.5
Mechanical analysis ... 29
3.2.2.6
Microscopic observations ... 29
3.2.2.7
Selected area electron diffraction (SAED) .... 29
CHAPTER IV
RESULTS AND DISCUSSION ... 31
4.1
Single polymer micro composites (SPMCs) .... 31
4.1.1
Annealing treatment on Vectran® NT fibers ... 31
4.1.2
Optimization of processing conditions and compatibilization for SPMCs preparation. ... 37
4.1.3
SPMCs characterization ... 40
4.1.3.1
Microstructure ... 40
4.1.3.2
Thermal analysis ... 41
4.1.3.3
Infrared spectroscopy ... 43
4.1.3.4
Dynamic mechanical thermal analysis (DMTA) ...44
4.1.3.5
Mechanical properties ... 46
4.1.3.6
Modeling of mechanical response ... 50
4.2
Single polymer nano composites (SPNCs) ... 52
4.2.1
Preparation of Vectran® nanofibers ... 53
4.2.1.1
Optimization of electrospinning conditions . 53 4.2.1.2
Microstructure ... 54
4.2.1.3
Thermal analysis ... 57
4.2.1.4
Infrared spectroscopy ... 62
4.2.1.5
Selected area electron diffraction (SAED) .... 63
4.2.1.6
Mechanical properties ... 65
4.2.2
SPNCs characterization ... 66
4.2.2.1
Microstructure ... 67
REFERENCES ... 75
P
UBLICATIONS ANDC
ONGRESS PRESENTATIONS... 82
L
IST OFF
IGURESFigure 1 – The schematics of a) crystal state, b) liquid crystalline state and
c) liquid state [5]. ... 8
Figure 2 – The nematic phase [5]. ... 8
Figure 3 – The smectic A and C phases, respectively [5]. ... 9
Figure 4 – The cholesteric phase [5]. ... 10
Figure 5 – Examples of main-chain and side-chain liquid crystalline polymers [44]. ... 11
Figure 6 – Vectran® molecular structure, where n represents HBA and m HNA [3]. ... 14
Figure 7 - Schematic two-dimensional representation of the order in the solid state of HBA/HNA copolymers as described by (a) the PCL model and (b) the NPL model [50]. ... 15
Figure 8 – Schematic representation of a basic electrospinning set-up [60]. ... 17
Figure 9 – Poly(ethylene oxide) molecular structure. ... 24
Figure 10 – DSC traces on Vectran® fibers as a function of a) annealing temperature for 2 hours and b) annealing duration at 300 °C. ... 33
Figure 11 – Example of tensile stress-strain curves of Vectran® single fibers. ... 34
Figure 12 – Cumulative probability of failure for Vectran® NT, Vectran® HS and annealed fibers. ... 35
Figure 13 – FTIR spectra of Vectran® fibers before and after annealing. ... 37
Figure 14 – Thermogravimetric curve of D.E.R. – 669E. ... 39
Figure 15 – FESEM micrographs of fracture surfaces of SPMCs filled with 20 wt% of annealed fibers [a) and b)], and c) plasma treated annealed fibers d) annealed fibers and 0.5 phr of D.E.R. – 669E e) annealed fibers and 2.0 phr of D.E.R. – 669E. ... 41
Figure 16 – First scan DSC curves comparing SPMCs containing different types of reinforcement and the unfilled matrix. ... 42
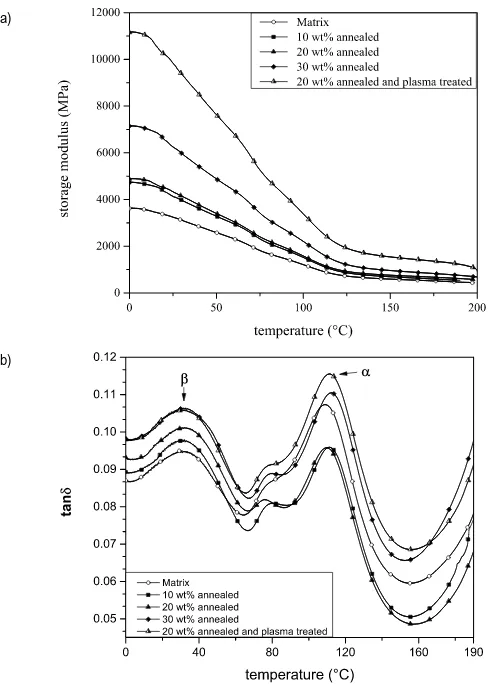
Figure 20 - Loss factor (𝑡𝑎𝑛𝛿) as a function of temperature for SPMCs containing diferent amounts of coupling agent. ... 46 Figure 21 – Representative stress-strain curves of unfilled matrix and SPMCs containing 10, 20 and 30 wt% of annealed fibers. ... 47 Figure 22 – Representative stress-strain curves of unfilled matrix and SPMCs containing 20 wt% of annealed fibers and various amounts of D.E.R – 669E (0.5, 1.0 and 2.0 phr). ... 49 Figure 23 – Representative stress-strain curves of unfilled matrix and SPMCs containing 20 wt% of annealed fibers and 20 wt% of plasma treated annealed fibers. ... 50 Figure 24 – Tensile modulus of SPMCs containing (p) annealed, () plasma treated annealed Vectran® fibers and (n) annealed fibers and 0.5 phr of D.E.R. – 669E. Lines refer to predictive models of equations 3 to 5 (a) and Christensen-Waals and Lavengood-Goettler models (b). ... 52 Figure 25 – FESEM images of electrospun Vectran® at different concentrations. ... 54 Figure 26 – SEM images. (a) Electrospun Vectran®/PEO mat. (b) Electrospun Vectran®/PEO mat after the immersion into water/ethanol bath to dissolve PEO. (c) Heat-treated electrospun Vectran®/PEO fibers. (d) Electrospun Vectran®/PEO mat after immersion into a water/ethanol bath and subsequent heat-treatment. (e) Electrospun Vectran®/PEO mat after heat treatment and subsequent immersion into a water/ethanol bath. ... 56 Figure 27 – Thermogravimetric curve of as-received PEO (Mw=600 kDa). . 57
L
IST OFT
ABLESL
IST OF ABBREVIATION AND ACRONYMSATR Attenuated total reflection
BP 4,4'-biphenol
CIR Crystallization induced reactions
DCM Dichloromethane
DMTA Dynamic mechanical thermal analysis
DSC Differential scanning calorimetry
EEW Epoxy equivalent weight
FESEM Field emission scanning electron microscopy
FTIR Fourier transform infrared
HBA 4-hydroxybenzoic acid
HDPE High density polyethylene
HNA 6-hydroxy-2-naphthoic acid
LCA Life cycle assessment
LCP Liquid crystalline polymer
LDPE Low density polyethylene
MPIA Poly-m-phenylene isophthalamide
NPL Non-periodic layer crystal (Model)
PA Polyamide
PBI Poly(2,2’-m-phenylene-5,5’-benzimidazole)
PBO Poly-p-phenylene benzobisoxazole
PBT Poly-p-phenylene benzobisthiazole
PCL Para-crystalline lattices (Model)
PDLA Poly-D-lactide
PE Polyethylene
PEO Poly(ethylene oxide)
PET Polyethylene-terephthalate
PFP Pentafluorophenol
PP Polypropylene
PPTA Poly-p-phenylene terephtalamide
PTFE Polytetrafluoroethylene
SAED Selected area electron diffraction
SPC Single polymer composite
SPMC Single polymer micro composite
SPNC Single polymer nano composite
TA Terephthalic acid
TCN Crystallization temperature
TEM Transmission electron microscopy
TGA Thermo-gravimetric analysis
TLCP Thermotropic liquid crystalline polymer
Chapter I
I
NTRODUCTIONFiber reinforced composites have been extensively studied since their creation in the beginning of the XX century. Fiber reinforced polymers have been widely used in several industries (e.g. automotive, aeronautical, aerospace) because of their particular mechanical and physical properties such as high specific strength and high specific stiffness.
Due to an increasing attention to environment preservation and the advent of the new regulations, a general interest to improve the recyclability of composite materials has recently emerged. In order to fulfill this new requirements, the development of so-called "single-polymer composites" (SPCs) is offered, in other words, composite materials in which both matrix and reinforcement have the same chemical composition. The main advantage of SPCs is that, unlike traditional heterogeneous composites (such as glass- or carbon reinforced polymer composites), they can be entirely melted down at the end of the product life for recycling. Besides recyclability, the interfacial bonding on SPCs should be improved based on the principle that matrix and fiber are made of the same polymer. A further driving force for SPCs is the possibility of manufacturing lightweight parts and structures because the density of SPCs is well below those of traditional filled polymers. The density of an equivalent composite is usually higher than that of an SPC because the former contain reinforcements such as glass (density: 2.5–2.9 g/cm3), carbon (density: 1.7–1.9 g/cm3), basalt
(density: 2.7–3.0 g/cm3), and fillers like talc (density: 2.7–2.8 g/cm3), chalk
(density: 1.1–2.5 g/cm3) and silica (density: 2.1–2.6 g/cm3). On the other
hand, one of the main challenges in the SPCs production is the small melting temperature difference generally existing between a fiber and a matrix having the same chemical nature [1,2].
and a crystalline solid, or amorphous glassy phase. Among the main uses of LCPs, the following applications should be mentioned: production of high precision moldings for use in the electronics industry, multi-way electrical connectors, components in printers and disk drives, transformer bobbins and encapsulation for surface-mounted silicon chips [4]. There are several commercial LCPs well known, that have been widely studied in the past decades between them Kevlar®, Twaron®, Zylon®, Ekonol®, Xydar® and Vectran® [3]. Vectran®, in particular, is superior to aramid fibers in several ways: it is highly resistant to creep, it resists flex or fold fatigue and abrasion, and it has better long-term resistance to UV degradation [4,5].
Previous investigations have shown that single-polymer composites can be successfully produced using commercially available continuous Vectran® fibers having different thermal transitions [6-8]. Also, heat treatments have been used to increase the mechanical properties and improve the thermal stability of LCP fibers [7,9-11].
When diameters of polymer fibers are reduced from micrometers to a few hundred nanometers, several attractive characteristics may be induced [12]. Some of the characteristics are a very large surface area to volume ratio (this ratio for nanofibers can be 103 times larger than that of
microfibers), flexibility in surface functionalities, change in crystalline structure [13], and superior mechanical performances (e.g. stiffness and tensile strength) [12]. All these characteristics with LCPs would open an avenue for applications in ultra-strong composites. There are several previous studies regarding nanofiber forming from LCPs [14-18]. On the other hand, to the best of our knowledge, there were no reports on forming Vectran® nanofibers.
The aim of this work is to develop single-polymer composites (SPCs) using Vectran® micro- and nano- fibers and investigate their thermo-mechanical properties. Vectran® SPCs would open an avenue to substitute traditional heterogeneous composites in the automotive and aeronautical field, improving the lightweight of the final products and attending the newest regulations concerning the environment.
Chapter II
B
ACKGROUND2.1 Micro- and nano- composites
Composite materials may be defined as materials made up of two or more components and consisting of two or more phases. Such materials must be heterogeneous at least on a microscopic scale. Fiber-reinforced composite materials consist of fibers of high strength and modulus, with dimensions on the order of microns, embedded in or bonded to a matrix with distinct interfaces between them. In this form, both fibers and matrix retain their physical and chemical identities, yet they produce a combination of properties that cannot be achieved with either of the constituents acting alone [22-25].
When at least one the reinforcement dimension is in the nanometer range (10 – 200 nm) the composite can be classified as nanocomposite. These composites show great promise not only in terms of superior mechanical properties, but also in terms of superior thermal, electrical, optical, and other properties. These characteristics are manifested, in general, at relatively low-reinforcement volume fractions. The principal reasons for such highly improved properties are; the properties of nano-reinforcements are considerably higher than the reinforcing fibers in use; and the ratio of their surface area to volume is very high, which provides a greater interfacial interaction with the matrix [22-25].
2.1.1 Single Polymer Composites
introduced as reinforcement, even if they are a renewable resource and can be thermally recycled, it is difficult to recycle then mechanically due to their poor thermal stability. This led to a search for alternative recycling-friendly homocomposites. Single polymer composites (SPCs) represent an effective alternative to the traditional fiber reinforced composites where the matrix and the reinforcement are from the same chemical composition, thereby supporting the ease of recyclability [2,26-28].
The new European Union directive on the end-of-life of vehicles (ELV 2000/53/EC), which states that by 2015 vehicles must be made of 95% recyclable materials, being 85% can be recovered through reuse or mechanical recycling and 10% through energy recovery or thermal recycling, lead the automotive industry to make every component recyclable [28].
Besides the recyclability there are other advantages in the use of SPCs: the possibility of manufacturing lightweight parts and structures in comparison with traditional composites due to lower density of polymeric fibers compared with traditional reinforcements (e.g. glass fiber, carbon fibers, basalt, talc, and silica); better interfacial adhesion fiber-matrix, in comparison with traditional composites, due to fully compatibility of them in the SPCs [2,27,28].
On the other hand, the main challenge in the SPCs production is the small difference, in terms of melting temperature, between matrix and reinforcement, once both constituents have the same chemical composition. This processing window can be expanded using polymers with same chemical composition but different chemical structure (e.g. HDPE and LDPE, PLLA and PDLA) or changing the chemical structure of the polymers [2,27].
reinforcement with a highly viscous matrix; overheating method, where the polymer fibers are overheated above their melting temperature when they are constrained, the constraining of the fibers increase their melting temperature offering the required temperature window; film-stacking, a textile reinforcement is sandwiched between matrix films and the material is produced by hot pressing; co-extrusion is used in order to generate SPC tapes; and in-situ polymerization [2,27,28].
If the single polymer composites using microfibers as reinforcement have been widely studied by the academia, the SPC containing nanofibers as reinforcement are not often studied. To the best of our knowledge, there is only one article in literature regarding the topic. Matabola et al. [40] studied the production and characterization of SPCs of PMMA containing nanofibers as reinforcement, it resulted in better dynamic mechanical properties in comparison with the PMMA matrix. This proves that SPCs using nanofibers can be the future in the field, improving not only mechanical properties, but inducing several kinds of functionalization to the final composite.
2.2 Liquid crystalline polymers
Reinitzer firstly observed liquid crystal state in the end of XIX Century, and together with Lehmann they started a new field, the liquid crystal science. In the beginning of the XX century Lehman, Friedel and Vorländer started to synthesize the first liquid crystalline compounds and established the existence of several types of liquid crystals [4,5].
managed to reduce the melting point of LCPs, in this way it could be processed from molten state without suffering degradation [4]. Thermotropic main-chain LCPs have a unique integration of properties from both the liquid crystalline and the conventional thermoplastic states, such as melt processability, high mechanical properties, low moisture uptake, and excellent thermal and chemical resistance. The LCPs successful development and the recognition of their unique properties are the result of comprehensive research that has been carried out by both academia and industry over the past decades [4,5,42].
2.2.1 Classification and physical structure of liquid crystalline polymers
As mentioned before, LCPs can be classified as lyotropic or thermotropic depending on whether the liquid crystalline state is achieved in a solution or by increasing the temperature.
In the thermotropic LCPs, a purely thermal process induces the transition to the liquid crystal state. Thermotropic LCPs form thermally activated mesogenic phases that extend from the crystal melting temperature, Tm, up to the isotropic temperature, Ti, in other words, the
liquid crystalline phase only exists between Tm and Ti. Over the latter, the
liquid crystalline phase reverts to an isotropic liquid. A liquid crystalline system in which transition temperatures are brought down by the addition of a low molecular weight solvent is known as lyotropic. Lyotropic solutions enable very rigid molecules to be handled, although wet processes have their own particular inconveniences and limitations [3-5,42,43].
Figure 1 – The schematics of a) crystal state, b) liquid crystalline state and c) liquid state [5].
The liquid crystalline state can present several different structures between the amorphous isotropic structure and the perfect organized crystal and they are mainly classified in three different phases: nematics, smectics and cholesteric [41].
The nematics phase (N phase), are characterized by the non-presence of long-range translational order, but a long-range orientational order only. The molecules in it are aligned with respect to the vector known as the director (𝑛). The quality of the alignment is not perfect, and is quantified by what is known as the order parameter (S) [4,5,41,42]. Nematics are the most important member in the family of the liquid crystals and are widely used in the display industry and its molecular organization is presented in figure 2 [5].
Figure 2 – The nematic phase [5].
and has no long- range positional correlation. Likewise, there is no correlation between the lateral positions of the molecules in successive layers. Because of the disorder within the layers, the layers are not well defined, and in formal terms the smectic A can be described as a one-dimensional density wave. As in a nematic, the alignment of the molecules with the director is not perfect and is described by S. The smectic C only differs from smectic A because the director of each layer is inclined at an angle ω to the layer normal, this angle remain the same for all layers [4,5]. They are schematically showed in figure 3.
Figure 3 – The smectic A and C phases, respectively [5].
Figure 4 – The cholesteric phase [5].
Several other crystalline phases exists (e.g. cubic, hexagonal, lamellar, columnar), since they are not frequently present in thermotropic liquid crystals, they will not be further detailed.
2.2.2 Classification and chemical structure of liquid crystalline polymers
Figure 5 – Examples of main-chain and side-chain liquid crystalline polymers [44].
Mesogenic units give to the LCPs their anisotropic rod shape, it must be essentially linear and of high aspect ratio. The typical mesogenic group consists of at least two aromatic or cycloaliphatic ring connected in the para
positions by a short rigid link, which maintains the linear alignment of the rings. At first it was believed that the mesogenic group should be completely inflexible. However, it was revealed lately that the mesogenic group might contain a flexible sub-unit [44].
Most main-chain LCPs are composed of mesogenic units linked by spacers with different degrees of flexibility (e.g. methylene, oxyethylene, siloxane groups), in order to reduce the mesomorphic temperature of liquid crystalline polymers and increase their processability. The participation of flexible spacers dramatically changes the properties of liquid crystalline polymers. These properties depend not only on the mesogenic units but also on the type of flexible spacers. However, some main-chain LCPs, like Vectran, are fully aromatic and no flexible chain group is present. The required lowering of the transition temperature, in this case, is accomplished with a copolymerization of 2,6-naphthalene units in the main chain [4,5,44].
2.2.3 Liquid crystalline polymer fibers
Both lyotropic and thermotropic LCPs are currently used for fiber production and they are probably the ideal precursors for preparing it. In the both, solution or molten, states the degree of uniaxial orientation is typically very high and the extensional flow that is associated with the extrusion process orients the mesophases in the flow direction. Exploiting the anisotropy of LCPs a very high orientation can be reached during the fiber production, which means outstanding tensile mechanical properties coupled with low density resulting in very good specific properties [3].
Nowadays LCP fibers are divided mainly in three classes: aromatic polyamides, aromatic heterocycles and aromatic copolyesters. The first one is commonly known as aramid fibers, they are obtained from polyamides containing aromatic rings along the main chain. Typically the aromatic units are phenylene or naphthalene rings and they present a rod-like behavior. These fibers cannot be produced by melt-spinning because they decompose before reaching the melting temperature, and in this case they are generally obtained from polymer solutions being a lyotropic LCP. As main applications it is possible to cite; advanced fabrics, coatings, and fillers, advanced composites in the aerospace and armament industry, asbestos substitutes, electrical insulation, bullet-proof body armor, industrial filters, and protective and sport clothing [45]. Their most known commercial products are; Kevlar® (Dupont, USA) and Twaron® (Teijin Aramid, Japan), both based on poly-p -phenylene terephthalamide (PPTA); Nomex® (Dupont, USA) and Tijinconex® (Teijin Aramid, Japan), poly-m-phenylene isophthalamide (MPIA) based; Technora® (Teijin Aramid, Japan) based on 3,4’-POP-T copolymer [3].
this polymer does not offer high strength and high modulus. The tensile properties of PBI fibers are in the range of conventional textile fibers [3,5]. As main applications of PBO it is possible to cite athletic equipment, high-fidelity speaker cones, heat and flame resistant work-wear such as for fire fighters and particular areas, such as the knee and elbow regions, of motorcycle suits are reinforced with PBO fabric, providing the required excellent heat, flame and abrasion resistance. PBI is mostly used in non-structural roles as high-temperature gas filtration, aircrafts fire blocking, nonwoven insulative products, among others [3,5,46].
Unlike the other two classes aromatic copolyesters are a thermotropic LCP (TLCP). These polymers possess a molecular structure with a high degree of linearity and rigidity allowing the formation of ordered phases on a wide temperature range. When these domains are extruded through very small holes, the flow and accompanying shear aligns the domains parallel to each other in the direction of flow. When cooled down, the extruded fiber has a highly oriented structure with high tensile strength and modulus. Because of this high orientation, drawing after spinning is not necessary, to improve the strength of a TLCPs increase the chain length is necessary. Solid-state polymerization of the spun fiber, which raises the molecular weight, results in fibers with very high strength and modulus [3,5,46]. The most known commercially available products of this class are Vectran® (Kuraray, Japan) a copolymer based on 4-hydroxybenzoic acid (HBA) and 6-hydroxy-2-naphthoic acid (HNA), Xydar® (Solvay Advanced Polymers, Belgium) and Ekonol® (Sumito Chemical, Japan) a copolymer of HBA, terephthalic acid (TA) and 4,4’-biphenol (BP) [3]. Among the applications it is important to cite products including towed arrays/streamers for off-shore exploration, halyards for racing yachts, restraint lines for race cars, and long lines for tuna fishing. And the air bags used to land the Jet Propulsion Laboratory Pathfinder on Mars in 1997 were produced with TLCP fibrers because of the flex/fold characteristics (even at extreme low temperatures) and tear strength of composite fabrics made from the fiber [46].
2.2.3.1 Vectran®
is a copolymer of HBA/HNA with a molecular ratio of 73/23, respectively. Its molecular structure is showed in figure 6.
Figure 6 – Vectran® molecular structure, where n represents HBA and m HNA [3].
The main component of Vectran® is the HBA, this monomer is capable to form a whole aromatic chain conferring a rigid and linear molecular structure to the LCP. Nonetheless, it has a very high melting temperature (around 600 °C) and start to decompose before reaching this temperature, being impossible to melt-spin it. Due to this reason Hoechst-Celanese (USA) developed polymers based on parallel offset or ‘crankshaft’ geometry provided by 2,6 functionally di-substituted naphthalene monomers, in this particular case a HNA was used. The addition of HNA drop the Vectran® melting temperature to around 300 °C being possible to process it through conventional techniques. The copolymerization is one of the most effective techniques to decrease the crystallinity and melting temperature of a polymer, in particular with HBA/HNA copolymers the minimum melting temperature (245 °C) occurs at 40 mol% HNA [3,5,42,44].
using ideas from the NPL model seems to give a more realistic physical image of the crystalline structures of the random liquid crystal copolyesters [50].
Figure 7 - Schematic two-dimensional representation of the order in the solid state of HBA/HNA copolymers as described by (a) the PCL model and (b) the NPL model [50].
There are two main paths to increase the thermal stability and the mechanical properties of the TLCPs, the first is the randomization process and the second is sequence ordering. Both are results of an annealing of the copolyesters near their crystallization temperature (TCN). The first consists in
HBA/HNA copolyesters near TCN dramatically increases the transition
temperature throughout the entire compositional range. The melting transition of the annealed copolymer is best described as a smectic B
(molecules arranged in a hexagonally close-packed array within the layers), and in addition there is an abrupt decrease in solubility.
Economy et al. [53] propose an ordering mechanism that is chemical in nature and depends on inter-chain transesterification reactions inside the existing crystallites present in the copolyester. Therefore, near TCN the
end-groups have sufficient mobility within the crystallites to facilitate ordering of the microstructure through inter-chain transesterification reactions. These reactions can only occur in the crystallites, since in the coexisting nematic melt no templates are present to promote ordering. The driving force for chemical ordering reactions arises from the improved packing and correspondingly higher density associated with a more ordered structure. Inter-chain transesterification reactions allow an improved ordering of sequences, but not necessarily complete ordering, since mobility within the crystallites should drop significantly as the transition temperature begins to increase [52].
2.3 Electrospinning
In order to produce polymeric fibers there are several traditional techniques extensively studied (e.g. melt spinning, solution spinning, dry spinning, gel spinning) however, these conventional techniques present as limitation the diameter of the produced fibers, that is generally in a range of 05 to 25 µm [22]. The diameter of these fibers can be further reduced, to a sub-micron level, submitting them to a drawing process [46,54]. In spite of this, electrospinning process appears as the most convenient and scalable technique for the nanofibers production. This process has been successfully scaled up and is used in the production of industrial products such as air filter media. Fibers with a diameter in the range 10 – 900 nm can readily be electrospun into mats [16,55].
Although, the first description of an electrospinning process occurred in 1902 by Cooley when he applied a US patent number 692631, which describes a method of using high voltage power supplies to generate yarn. In 1934, Formhals [56] patented an improved version of the electrospinning process and apparatus. In his patent the fiber collector could be moved, allowing a certain degree of fibers orientation. Between 1964 and 1969 Taylor contributed to electrospinning by mathematically modeling the shape of the cone formed by the fluid droplet under the effect of an electric field, which is nowadays known as Taylor cone [55,57-59].
Nonetheless, until 1995 there are only a few number of publications regarding electrospinning [60]. Electrospinning was re-discovered in 1995 in the form of a potential source of nano-structured material by Reneker and Doshi who, while investigating electrospraying, observed that fibers could easily be formed with diameters on the nanometer scale [61].
The basic set-up for the electrospinning technique consists in three major components: a high-voltage power supply, a reservoir with a capillary tip for the spinning solution (or melt) and a collector (grounded conductor) an example can be seen in figure 8.
Figure 8 – Schematic representation of a basic electrospinning set-up [60].
force exerted by the external electrical field. These forces will deform the drop to a conical form, known as Taylor cone (figure 8). When the strength of electrical field exceeds a threshold value, the repulsive electrostatic force overcomes the surface tension and the charged jet is ejected from the tip of the Taylor cone. The jet starts a stretching and whipping process forming a long and thin thread, being continuously elongated reducing its diameter from hundreds of micrometers to tens of nanometers. Its small diameter permits rapid mass exchange and the solvent usually evaporates during its traveling from the capillary to the collector acting as a counter electrode. The result is a non-woven mat with nanofibers randomly oriented in it (figure 8). Under certain conditions the charged jet violates its continuity and, instead of fibers, nano- and/or microparticles of various forms are formed on the collector. This process is called electrospraying and is particularly appropriate for obtaining nano- and/or microparticles [12,16,59,60].
Reneker and Yarin [21,62] analyzed the jet as a system of connected, viscoelastic dumbbells and provided a good interpretation for the bending stability. Initially the jet only follows a direct path towards the counter electrode. Then it becomes unstable performing a series of bending coils with a continuously enlarged radius. Investigations with the help of a high-speed digital video camera show that the jet is only one and it moves and bends very quickly. From the above description it is clear that whipping instability is the primary mechanism responsible for reducing nanofiber dimensions during electrospinning. However, Dzenis [63] pointed out that suppressing this instability using either a secondary electric field or a short tip to collector distance did not result in substantially thick nanofibers being generated. Nowadays the understanding of the process is still incomplete, and all the factors that govern fiber formation are not well understood [55,58-60].
The morphology and diameter of the electrospun fibers are affected by several parameters that can be divided in three broad categories: solution parameters, processing parameters and environmental parameters.
electrospinning to occur, the fibers diameter will decrease with the increase of conductivity. If the surface tension is too high instability of jets will probably occur. In the case of concentration, if the solution present a low viscosity a mixture of fibers and beads will predominate, however if the viscosity is too high, the formation of fibers will be prohibited because of the inability to maintain the flow of the solution at the tip of the needle, resulting in the formation of larger fibers. Also, increasing the molecular weight of the polymer will reduce beads formation and a further increase of it will raise the fiber diameter [57,60,64].
Process parameters includes applied electric field, tip to collector distance, solution flow rate and type of collector. The applied voltage to the solution is crucial in the electrospinning; generally increasing its value causes greater stretching of the solution leading to a decrease in the fiber diameter and faster solvent evaporation. However, Zhang [65] and Demir [66] suggested that increasing the applied voltage causes more polymer ejection and consequently higher larger fiber diameters. There is a minimum and a maximum distance between tip and collector in which the electrospinning will produce fibers; outside this interval it will generate beads. Within this range it will be an optimal distance in which the evaporation of the fibers will be favored. The solution flow rate influences directly the jet velocity and the transfer rate. A lower flow rate lead more time to the solvent evaporate forming very thin and dry fibers, on the other hand higher flow rates form much thicker fibers and increase the incidence of beads. The collector geometry and the addition of secondary electrodes can be used to control deposition patterns or the extent of the bending instability. Works such as Teo and Ramakrishna [67] shows that the modification of the electric field allows control over the fiber flight and hence the modification of the final fiber alignment [57,60,64].
As demonstrated, electrospinning is a simple and powerful technique to generate nanofiber mats, there are a series of applications for the produced structures as main examples it is possible to cite: filtration (e.g. air filters, antimicrobial nanofilters, adsorptive membranes), biomedical field (e.g. enzyme immobilization, drug delivery, scaffolds in tissue engineering), clothing material, sensors, and as reinforcement in composite materials. Particularly in composite materials due to the nanofibers high surface-to-volume ratio, it use can improve the interaction between matrix and reinforcement leading to better mechanical properties. Beside the mechanical point of view, the addition of nanofiber mats can induce special functionalizations on the composite, in example self-healing capabilities [55,57,58,60,64,68].
2.4 Predictive models
The structure of composite materials with random orientation is highly complex; therefore, it is a great challenge to trace those structural parameters that affect the desired property. The simplest way to predict the elastic modulus is to use the rule of mixture and check if it fits. There have been many micromechanical theories and models developed to predict mechanical properties of fiber-reinforced composites, mostly of them focused on continuous and unidirectional composites. In example, the Voigt upper bound of the E-modulus is based on a two-phase laminate model (matrix and reinforcement), according to which the reinforcing laminates are aligned along the load direction and thus all constituents experience the same strain (parallel coupling), and the Reuss lower bound of stiffness reflects a serial coupling, according to which both matrix and reinforcing phases are under the same stress. On the other hand, a few micromechanical models have been established for discontinuous fiber composites.
results into a simpler analytical form adapted for a variety of reinforcement geometries, including discontinuous filler reinforcement [73]. Halpin-Tsai equations are expressed in equations 1 and 2.
𝐸
!! =𝐸!
1+𝜁!𝜂!𝑉!
1−𝜂!𝑉! (1)
𝐸
!!=𝐸!
1+𝜁!𝜂!𝑉!
1−𝜂!𝑉! (2)
where 𝐸!! and 𝐸!! represent respectively the longitudinal and transverse tensile moduli for a unidirectional aligned fiber composite having the same fiber volume fraction and fiber aspect ratio of the composite under evaluation, 𝐸! is the matrix modulus, 𝑉! is the fiber volume fraction, and:
𝜁!=2
𝑙
𝑑 𝜁!=2 𝜂!= 𝐸!
𝐸!−1 𝐸!
𝐸!+𝜁!
𝜂!= 𝐸!
𝐸!−1 𝐸! 𝐸!+𝜁!
being 𝑙 the length, 𝑑 the diameter and 𝐸! the tensile modulus of the fibers. Based on the predictions of 𝐸!! and 𝐸!!, several theories were proposed to estimate the in-plane elastic modulus of the random fiber composite (𝐸!); the first, and probably the more diffused, was proposed by Tsai and Pagano [74],
𝐸!= 3 8𝐸!!+
5
8𝐸!! (3)
𝐸
!=
1
3𝐸!! (4)
and a third was proposed by Loewenstein [76],
𝐸
!= 3
8𝐸!! (5)
Lavengood and Goettler [77] used an approximate averaging technique to generate the following rule-of-thumb expression for the elastic modulus prediction of a structure having 3-dimensionally random fiber orientation;
𝐸
!=
1 5𝐸!!+
4
5𝐸!! (6)
at 30 vol% loading, equation 6 predicts a value about 20% lower than the in-plane stiffness for random 2-dimensional orientation (equation 3) [78]. Nielsen [79] believes that the equation 6 predicts values which are too large for truly randomly oriented 3D composites when the concentration of fibers is below 40% [23].
Christensen [80] have used alternative approaches to arrive at upper and lower bounds for the stiffness problem. This approach can accommodate the general random 3-dimensional problem from a bounding viewpoint, but cannot explicitly accommodate the distributions of aspect ratio and fiber orientation [78].
𝐸
!=
𝑉!
6𝐸!+[1+ 1+𝜈! 𝑉!]𝐸! (7)
where 𝜈! is the Poisson’s ratio of the matrix.
Chapter III
E
XPERIMENTAL3.1 Materials
Kuraray supplied the as-spun Vectran® LCP fiber yarn used in this work as matrix and reinforcement under the trade name of Vectran® NT. It has a linear density of 750 denier and 150 filaments per yarn and a sizing weaving finish applied at a level of ~ 0.5% oil-on-yarn to assist processing (e.g. rewinding, twisting, braiding, weaving). Vectran® is a copolymer of 4-hydroxybenzoic acid (HBA) and 2-hydroxy-6-naphthoic acid (HNA) with a molar ratio of 73/27, respectively [83,84]. Vectran® NT has molar mass of 290.27 Da and molecular weight higher than 20 kDa [85]. The fibers possess an almost circular cross-section with an average diameter of 25.5±2.1 µm.
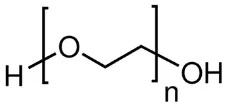
Poly(ethylene oxide) (PEO, molar mass 44.05 Da, Mw = 600 kDa,
figure 9) was used as host polymer in order to increase the spinnability of Vectran® during the nanofibers production.
Figure 9 – Poly(ethylene oxide) molecular structure.
Chloroform (> 99.8%) and pentafluorophenol (PFP, > 98%) were used as solvents in the nanofibers production and were purchased from Sigma-Aldrich. All materials were used as received without any further purification.
3.2 Composites preparation and characterization
3.2.1 Single Polymer Micro Composites (SPMCs)
3.2.1.1 Sample preparation
The continuous Vectran® NT fibers have been chopped in 12 mm short fibers using a fiberglass chopper model B-410 (Glascraft Composites Equipment). The fibers were used in three ways; as received (for the matrix), after an annealing treatment (described in section 3.2.1.2) and annealed plasma treated (described in section 3.2.1.3), both as reinforcement.
In a first step the reinforcement and the matrix (as received fibers) were mechanically mixed at weight fractions of 10, 20 and 30%. The next step is the SPMCs consolidation; an aluminum square mold of 120 x 120 mm² and 1 mm thick was used. The mixture was placed between two 1 mm thick PTFE sheets and hot-pressed using a Carver laboratory press at a temperature between the melting points of the constituents (295 °C) once the consolidation temperature was reached the pressure was increased until 4.4 MPa and maintained for 30 seconds and then the SPMCs were cooled under pressure (1.8 MPa). In this way single polymer micro composite plates of LCP reinforcing fibers embedded in a LCP matrix were prepared. When used, an epoxy coupling agent it has been added in the composite as parts-per-hundred (phr) of matrix, maintaining the fiber/matrix ratio untouched, and it has been mechanically mixed together with the other components before the consolidation.
3.2.1.2 Annealing treatment
In the past two decades annealing on liquid crystalline polymers was widely studied. Annealing treatments consist in increasing the fibers temperature close to the crystallization temperature (TCN), and keeping them under these
in the temperature range of 240 – 300 °C and treatment times lasting between 2 and 24 hours.
3.2.1.3 Plasma treatment
A plasma apparatus, consisting of a glass cylinder reactor (500 mm in length and 150 mm in diameter) equipped with semi cylindrical copper electrodes, was assembled at the University of Trento. A radiofrequency generator RF5S (maximum power 500 J.s-1 and frequency 13.56 MHz) matching
network AM-5 and controller AMNPS-2A supplied by RF Plasma Products, (Marlton, NJ, USA) were used. Vacuum, produced by a double stage pump, was controlled and measured by Edwards devices. The working pressure was ca. 1 atmosphere. The voltage of 30 V and a treatment time of 3 min were used in the fibers treatment; oxygen fluxed along the reactor axis at a flow rate of 100 ml/min.
3.2.1.4 Thermal analysis
Differential scanning calorimetry (DSC) measurements were performed using a Mettler DSC 30 Low Temperature Cell and a Mettler TC 15 TA Controller. The heating rate was 10 °C/min under a nitrogen flux of 100 mL/min.
Thermo-gravimetric analysis (TGA) was applied, and measurements were performed using a modulated TGA Q5000IR by TA instrument. The heating rate was 10 °C/min under an air flux of 25 mL/min.
3.2.1.5 Mechanical analysis
All tensile tests were conducted using a universal testing machine (Instron, model 4502). Tensile tests on the single fibers were executed according to ASTM standard D3379 with a 10 N load cell. Single fibers were randomly extracted from a bundle and mounted on window cards using quick-setting glue. The diameter of individual fibers was measured using an optical microscope. The gage length was fixed at 25 mm and the cross–head speed at 1 mm/min. At least 17 specimens were tested for each sample.
resistance extensometer Instron model 2620-601 with a gage length of 12.5 mm. At least five specimens were tested for each sample.
Dynamic mechanical thermal analysis (DMTA) under tensile configuration was performed by a DMA Q800 (TA Instruments, New Castle, USA) apparatus on rectangular specimens of 5 x 15 x 1 mm3 at a frequency
of 1 Hz. Storage modulus (𝐸!) and loss tangent (tan𝛿) were determined in
the temperature range from 0 °C up to 200 °C. A peak-to-peak displacement of 64 µm and a heating rate of 3 °C/min were imposed.
3.2.1.6 Infrared spectroscopy
Infrared analysis was performed in attenuated total reflection (ATR) mode using a Fourier transform infrared (FTIR) Spectrum One (Perkin Elmer). Each spectrum was generated as a mean of four scans between 4000 and 650 cm−1. The spectral resolution was 4 cm−1.
3.2.1.7 Observations
Field emission scanning electron microscopy (FESEM) images were obtained using a Supra 40 (Zeiss) microscope with the operating mode in high vacuum and secondary electron detector. Optical observations were done using a Leitz Ortholux 2 Pol microscope in transmission mode.
3.2.2 Single polymer nano composites (SPNCs)
3.2.2.1 Sample preparation
In a first step, two square plates of matrix (120 X 120 X 0.5 mm3) were put in
bellow the melting point of the nanofiber mats and the pressure was increased until 4.4 MPa during 30 seconds and then the SPNCs were cooled under pressure (1.8 MPa). In this way single-polymer composites of Vectran® nanofibers embedded in a LCP matrix were prepared.
3.2.2.2 Vectran® nanofibers preparation
Vectran® solution (1 wt%) was prepared by dissolving 0.202 g of LCP in 20 g of a mixture of two solvents, chloroform and pentafluorophenol (PFP), with a 70/30 ratio by weight, respectively. Stirring for 10 h at room temperature resulted in a yellow-clear solution. PEO solution (1.85 wt%) was prepared by dissolving 0.37 g of PEO in 19.63 g of chloroform under magnetic stirring for 5 h. Then, the Vectran® solution was mixed with the PEO solution at a ratio of 15:1 by weight, respectively. The as-spun nanofibers produced in the present work possess the Vectran®/PEO weight ratio of 8.19:1, correspondingly.
To spin Vectran® or its blends with PEO, a conventional electrospinning setup was used (figure 8), with aluminum foil as a collector [62]. The controlled power generator was a Glassman High Voltage model EH, that can generate DC voltage in the range 0 – 30 kV. A pump NE-1000 from New Era Pump Systems, Inc. was used to ensure a continuous supply of polymer solution during the process. The voltage was set at 10 kV at a solution flow rate of 1.5 ml/h, and the distance between the collector and needle was kept equal to 10 cm. The obtained samples were dried for 24 h at room temperature.
3.2.2.3 Heat treatment
The heat treatment over the nanofiber mats was used to enhance the mechanical properties of Vectran®, as well as its melting temperature and remove the residual PEO used as “host” polymer during the electrospinning. The heat treatment was performed in an oven in air in the temperature range 250 – 300 °C, and the treatment duration were in the range 15 – 24 h.
3.2.2.4 Thermal analysis
Controller. The heating rate was 10 °C/min under a nitrogen flux of 100 mL/min.
Thermo-gravimetric analysis (TGA) measurements were performed using a modulated TGA Q5000IR by TA Instruments. The heating rate was 10 °C/min under a nitrogen flux of 25 mL/min.
3.2.2.5 Mechanical analysis
Electrospun nanofiber mats were cut into rectangular specimens measuring 4 X 30 mm2 and mounted on window-likeholders with a gage length of 20
mm. Tensile tests were conducted with 15 as-spun mat specimens. Also a sample (consisting of 13 heat-treated specimens) was subjected to tensile test. The tensile tests were conducted using a universal testing machine (Instron, model 4502) with a 10 N load cell (Instron, model 2518-808)at a cross-head speed of 5 mm/min.
Tensile tests on composites were performed according to ISO 527 on 1BA specimens with a gage length of 25 mm, a crosshead speed of 1 mm/min and a 1 kN load cell. The strain was recorded by using a resistance extensometer Instron model 2620-601 with a gage length of 12.5 mm.
3.2.2.6 Microscopic observations
Field emission scanning electron microscopy (FESEM) images were obtained using a JEOL JSM-6320F and Supra 40 Zeiss microscopes under high vacuum and secondary electron detector operating mode. Transmission electron microscopy (TEM) was performed using a JEOL JEM-3010 microscope. Optical observations were done using an Olympus BX51 microscope in refraction mode and a Leitz Ortholux 2 Pol microscope in transmission mode.
3.2.2.7 Selected area electron diffraction (SAED)
Chapter IV
R
ESULTS AND DISCUSSIONPart of this chapter has been published in:
Medeiros Araujo, T., S. Sinha-Ray, A. Pegoretti and A. L. Yarin,
“Electrospinning of a blend of a liquid crystalline polymer with poly(ethylene oxide): Vectran® nanofiber mats and their mechanical properties.”,
Journal of Materials Chemistry C, 1. (2013) 351 - 358.
Medeiros Araujo T. and A. Pegoretti,
“Liquid crystalline single-polymer short-fibers composites”,
Composite Interfaces. (2013).
4.1 Single polymer micro composites (SPMCs)
In order to successfully produce SPMCs the first step is to obtain a difference in terms of melting temperature and mechanical properties between matrix and reinforcement. At this aim, a thermal annealing treatment has been optimized. In a second step, SPMCs have been produced by a thermal consolidation process and their thermo-mechanical properties have been investigated.
4.1.1 Annealing treatment on Vectran® NT fibers
The annealing treatment used in the present work was motivated by the previous treatments successfully developed for commercial Vectran® fibers [9-11,87]. Economy et al. [53] reported that after an annealing at temperatures higher than the crystal-to-nematic transition (TCN) a chemical
endothermic peak (Tm1) appears at a temperature that increases with the
annealing temperature. As reported in previous studies Tm1 could be
attributed to inter-chain transesterification reactions where an increase of alternating copolymer sequences occurs [53,83,89], or it can be associated to a process called crystallization induced reactions (CIR). In this process the initial non-crystalline random copolyester is converted to a block copolymer via ester interchange reactions in the solid state, replacing in this way the non-crystallizable unit sequence by crystallizable regions increasing the crystal size, crystallinity and melting point [11,53]. When the treatment was performed at 300 °C, Tm1 overlaps the endothermic peaks Tp1and Tp2
present in the untreated fibers becoming the new transition temperature of the fibers. Due to the larger increment in Tm1 temperature, 300 °C was
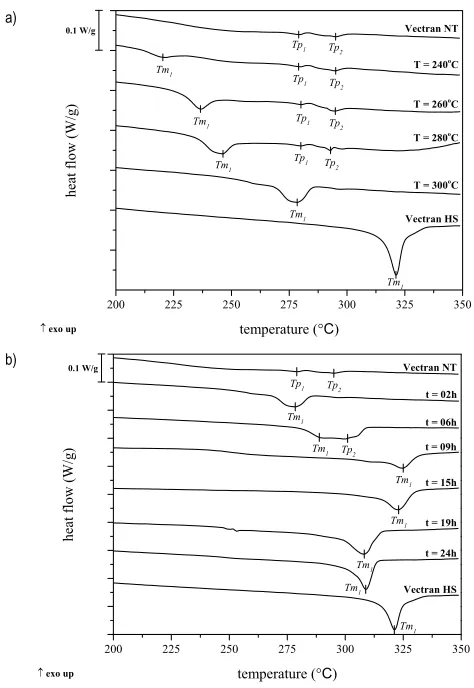
chosen as annealing treatment temperature. In order to establish an optimal treatment time, DSC analysis were also performed on fibers treated at 300 °C for 2, 6, 9, 12, 15, 19 and 24 hours. The DSC traces of Vectran® fibers as a function of treatment time at 300 °C are presented in figure 10(b). It is interesting to observe that until 15 hours of treatment Tm1 moves to higher
temperatures with increasing treatment times. After this time, Tm1 starts to
Figure 10 – DSC traces on Vectran® fibers as a function of a) annealing temperature for 2 hours and b) annealing duration at 300 °C.
The increase of the melting temperature of the fibers was not the only aim of the annealing treatment, figure 11 shows the representative tensile curves of Vectran® NT, annealed at 300 °C for 2 hours, annealed at 300 °C for 15 hours ad Vectran® HS. After only 2 hours of annealing there are no considerable modifications in the mechanical properties of the material in
a)
NT fibers. However, the tensile modulus of all kinds of fibers does not change significantly. The improvement on the tensile properties of LCP fibers has been attributed to the increase in molecular weight after the treatment due to the transesterification reactions induced by the thermal annealing [9,11]. Vectran® HS fibers present nearly the same elastic modulus but a much higher tensile strength and elongation at break due to the proprietary heat treatment under tension they have been submitted to. It is important to underline that, due to the impossibility of using an extensometer directly on the fibers, all the elastic modulus were corrected by taking the machine compliance into account.
Figure 11 – Example of tensile stress-strain curves of Vectran® single fibers.
𝐹 𝜎 =1−𝑒𝑥𝑝 − 𝜎
𝑎
!
(8)
where 𝑎 and 𝑏 are the scale and shape parameters, respectively. The shape parameter describes the dispersion of the strength values and it increases as the dispersion of the strength values decreases. The scale parameter is proportional to the average fiber strength.
Figure 12 report the cumulative probability of failure of pristine Vectran® fibers and after annealing. After a 2 hour annealing the shape parameter slightly changed in comparison with the pristine NT fiber. After 15 hours of annealing treatment the shape parameter value increased moving in the direction of HS fibers, i.e. of commercially available thermally treated fibers.
Figure 12 – Cumulative probability of failure for Vectran® NT, Vectran® HS and annealed fibers.
MPa for Vectran® HS, 1240 MPa for 2 hour annealed and 1573 MPa for 15 hour annealed fibers, at a reference length of 25 mm were found. These values are comparable to the ones found in literature [6,7]. Table 1 compares the main tensile mechanical properties of as-received and annealed single fibers.
Table 1 – Results of single fiber tensile tests on untreated or annealed Vectran® NT fibers.
Property Vectran® NT 300 °C for 02 h annealed at 300 °C for 15 h annealed at Vectran® HS
Tensile modulus
[GPa] ± 3.261.6 ± 1054.3 ± 8.861.4 ± 8.566.8
Tensile strength
[MPa] ± 168.01129.6 ± 214.81148.0 ± 117.2 1521.6 ± 216.92726.7
Elongation at
break [%] ± 0.242.09 ± 0.222.00 ± 0.242.33 ± 0.513.75
Weibull scale
parameter (MPa) 1198 1240 1573 2823
Weibull shape
parameter 8.16 5.88 15.60 15.02
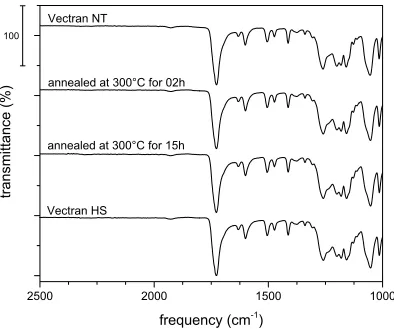
Once the effectiveness of the annealing over the thermal and mechanical properties was attested, infrared spectroscopy was used to ensure that no chemical reactions occur during the treatment. In figure 13 it is possible to note that the peaks of aryl-ester absorbance (1739 cm-1),
aromatic C–C stretching (1610 cm-1) and O–C–C stretching (1178 cm-1)
Figure 13 – FTIR spectra of Vectran® fibers before and after annealing.
Once the annealing treatment (300 °C for 15 h) was optimized over the reinforcement the SPMCs were produced.
4.1.2 Optimization of processing conditions and compatibilization for SPMCs preparation.
To optimize the consolidation temperature of SPMCs, a preliminary investigation has been conducted producing plates of unfilled matrix (Vectran® NT). They were produced at four different temperatures 265 °C, 275 °C, 285 °C and 295 °C. At 265 °C only a partial melting occurred generating a non-homogeneous plate that was not submitted to further evaluations. In table 2 tensile properties of the consolidated plates at different temperatures can be found.
Table 2 - Tensile properties of unfilled matrix at various consolidation temperatures.
Property 275 °C 285 °C 295 °C
The plate consolidated at 295 °C shows better mechanical properties as well smaller standard deviations in it results, therefore this temperature was chosen for the consolidation process.
In order to improve the interfacial fiber-matrix adhesion, surface modifications of the reinforcing fibers and the use of coupling agents are commonly used, on LCPs in particular, previous works using both techniques reported very good improvements in the interfacial adhesion [85,94,95]. In this work both techniques were studied distinctly, the use of a high molecular weight epoxy resin (D.E.R. – 669E) as coupling agent and the use of a plasma treatment over the reinforcement fibers as surface modification treatment.
The use of coupling agents for LCPs was widely studied and the reactive compatibilization seems to be the most promising technique. It combines the matrix and reinforcement through a suitable multifunctional coupling agent and the in-situ-formed copolymers, made of chain segments identical to the base constituents, should be effective compatibilizers of the composite. Epoxy resins of various epoxy equivalent weight (EEW) have been demonstrated to be excellent in compatibilizing blends whose single constituents possess functional groups able to react with the epoxy functions under melt conditions to form block copolymers of the blend pairs [95-98]. The D.E.R. – 669E it is not miscible to the LCP [97]. The only expected reactions are between the epoxy groups with the carboxylic acid or hydroxyl end groups of the LCP. They are demonstrated in the following reaction schemes (9) and (10) [98,99].
(9)
(10)
In order to ensure that the D.E.R. – 669E will not suffer from any degradative phenomena during the composite consolidation due to the elevated temperature (295 °C), TGA analysis was made under air atmosphere, to mimic the consolidation atmosphere. It curve can be seen in figure 14, it is possible to note that the degradation onset is around 390 °C,
O
R – CH – CH2 + LCP – COOH R – CH – CH2 – OCO – LCP OH
O
attesting in this way that the D.E.R. – 669E resin can be used as coupling agent, without suffering any degradation.
Figure 14 – Thermogravimetric curve of D.E.R. – 669E.
The plasma treatment was used in order to activate the surface of the annealed Vectran® fibers, in other words to clean their surface and introduce some chemical groups onto the polymeric chain. The microetching is the removal by evaporating surface material for cleaning purposes, in it the plasma breaks the carbon-to-carbon bonds of the hydrocarbon polymer, their volatile monomers and oligomers boil off and are removed away with the vacuum. This cleaning procedure removes external organic contaminants (such as hydraulic oils and sizings applied during the production) from the polymer surface. After the initial cleaning stage, the fibers surface is exposed to the plasma environment, the electrons, ions and free radicals in the plasma act on the surface, creating free radicals in the molecular chains of the polymer surface [100-103].
4.1.3 SPMCs characterization
4.1.3.1 Microstructure
FESEM micrographs of the fracture surfaces of SPMCs filled with 20 wt% of annealed fibers, plasma treated annealed fibers and composites using D.E.R. – 669E as coupling agent are reported in figure 15(a – e).
Figure 15 – FESEM micrographs of fracture surfaces of SPMCs filled with 20 wt% of annealed fibers [a) and b)], and c) plasma treated annealed fibers d) annealed fibers and 0.5 phr of D.E.R. – 669E e) annealed fibers and 2.0 phr of D.E.R. – 669E.
4.1.3.2 Thermal analysis
DSC technique on the SPMCs can give us important indications about their thermal behavior. The first information is to ensure that the reinforcement
(a) (b)
(c) (d)
scanning, it is possible to have an indication of their recyclability from a thermal point of view.
As the DSC first scans (figure 16) shows in all the compositions, with the exception of unfilled matrix, is possible to observe two endothermic peaks. The first peak occurs around 282 °C and is present also on the unfilled matrix, it corresponds to the melting temperature of the matrix after the consolidation process. The second peak occurs between 295 and 305 °C and is present in all reinforced SPMCs, it is related to the melting temperature of the annealed fibers that reinforces the SPMCs. The presence of the peak confirms the presence of the reinforcement fibers after the consolidation.
Figure 16 – First scan DSC curves comparing SPMCs containing different types of reinforcement and the unfilled matrix.
Figure 17 – Second scan DSC curves comparing SPMCs containing different types of reinforcement and the unfilled matrix.
4.1.3.3 Infrared spectroscopy
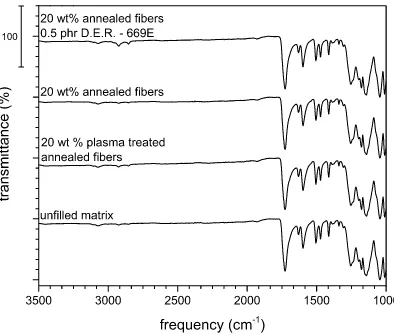
Another way to confirm the fully recyclability of the SPMCs produced in this work is to analyze their FTIR spectra after they had been melted down to see if there are changes in their chemical structure. Figure 18 shows the IR spectra obtained after the melting of the SPMCs and the unfilled matrix, it is important to note that in all cases the peaks of aryl-ester absorbance (1739 cm-1), aromatic C–C stretching (1610 cm-1) and O–C–C stretching (1178 cm -1) [11,93] remains unchanged after the consolidation process and re-melting
of the composite. The only changes in the chemical struct
![Figure 1 – The schematics of a) crystal state, b) liquid crystalline state and c) liquid state [5].](https://thumb-us.123doks.com/thumbv2/123dok_us/560485.2055358/23.420.78.346.47.140/figure-schematics-crystal-state-liquid-crystalline-state-liquid.webp)
![Figure 5 – Examples of main-chain and side-chain liquid crystalline polymers [44].](https://thumb-us.123doks.com/thumbv2/123dok_us/560485.2055358/26.420.130.292.48.180/figure-examples-main-chain-chain-liquid-crystalline-polymers.webp)
![Figure 8 – Schematic representation of a basic electrospinning set-up [60].](https://thumb-us.123doks.com/thumbv2/123dok_us/560485.2055358/32.420.144.275.281.419/figure-schematic-representation-basic-electrospinning-set.webp)

![Figure 15 – FESEM micrographs of fracture surfaces of SPMCs filled with 20 wt% of annealed fibers [a) and b)], and c) plasma treated annealed fibers d) annealed fibers and 0.5 phr of D.E.R](https://thumb-us.123doks.com/thumbv2/123dok_us/560485.2055358/56.420.71.350.39.397/figure-micrographs-fracture-surfaces-annealed-treated-annealed-annealed.webp)