DOI : 10.21608/ejss.2017.4158
T
HE PURPOSE of this experiment is to elaborate the mode of distribution of both moisture and salt under drip irrigation system which is widely regarded as the most promising system in combination with saline water under conditions of El-Sheikh Zewied area-North Sinai (Lithic Torripsamments) during the summer growing season (March – June) 2015. It is just a trial to suggest a suitable irrigation management to increase production of a vegetable crop (Squash, (cucurbita pepo). Two methods of drip irrigation system were applied, i.e.,surface and sub-surface with three quantities of irrigation water, i.e., 80, 100 and 120% of evapotranspiration calculated by meteorological equation of Penman-Montieth. Two emitter’s discharge rates, i.e., 2 and 4 liter/ hour were used to irrigate squash with saline water (4.5 dS/m). Split – split plot design statistically was applied.
1- There is a remarkable decrease in soil moisture content apart from drippers horizontally and vertically.
2- Irrigation water applied as a reference evapotranspiration calculated by penman-Montieth showed that water requirement followed the order increasing as 120 %100 < % < 80 % under 4L/h dripper discharge rate.
3- Surface drip irrigation system cased more soil moisture content than subsurface one. 4- Dripper discharge rate 4L/h surpassed for soil moisture content which increased horizontally,
while it increased vertically under 2L/h.
5- Salt concentration in soil increased apart from drippers by increasing irrigation water quantities and dripper discharge rates through growth periods.
6- Surface drip irrigation system help roots to be tolerable salt concentration by moving salts in the two up and down directions apart from roots.
7- Salt concentration significantly increased at 5% level growth season under surface and subsurface drip irrigation system as 90 < 60 < 30 < 1 days, respectively.
8- Biological yield decreased by using salt water under 2L/h dripper discharge and subsurface drip irrigation system, while the best water and salt distribution was conducted in the root zone under surface irrigation system and 100% of irrigation water applied.
9- The maximum squash yield , (significantly increase), was conducted to surface drip irrigation system by applying 100% quantity calculated by reference evapotranspiration approach as 7.59 and 7.4 ton/fed under 4 and 2 L/h dripper discharge rates, respectively. While the minimum yield, (4.4 ton/fed), was found by applying 80 % of water requirements under subsurface drip irrigation with 2L/h dripper discharge rate.
10-Water use efficiency significantly increased with 100% irrigation water requirements and 4L/h dripper discharge rate when applying surface drip irrigation system.
Keywords: Drip irrigation, Salt and moisture distribution, Saline water, Discharge rates.
Introduction
The worldwide use of Surface and subsurface drip irrigation system has increased considerably in recent decades. The main advantage of this system is the potential to increase crop yields
while reducing water application and fertilizer and cultivation costs. The soil moisture distribution pattern around a water emitter depends on: (i) the
total volume of water applied; (ii) the emitter flow rate, source configuration (surface, subsurface,
point or line) and initial boundary conditions;
Effect of Drip Irrigation System on Moisture and Salt Distribution
Patterns under North Sinai Conditions
R.M. Rafie and F.M. El-Boraie(iii) the soil physical properties and their spatial distribution; (iv) plant root activity ; and (v) irrigation management, El-Maloglou et al. (2010)
also identified that surface and subsurface drip irrigation system can increase water use efficiency
but only if the system is designed to meet the soil and plant conditions. Drip irrigation can achieve
high water use efficiencies, but only when the
system is designed correctly, with appropriate
emitter spacing, flow rate and installation depth
(Phene, 1995).
Water is one of the most precious and heavily scrutinized natural resources worldwide. Particularly in arid regions and in parts of the world that have limited water resources improving
agricultural water use efficiency is vitally
important. Innovative irrigation solutions must address the water scarcity problems affecting arid countries. The type of irrigation system is important and the availability of suitable irrigation systems barely meets the needs of agricultural expansion. Irrigation water is rapidly becoming the primary limiting factor for crop production. Surface and subsurface drip irrigation systems were proven to increase water productivity (Mailhol et al., 2011).
The soil moisture distribution patterns showed that the vertical movement of soil moisture was higher than the horizontal movement under both surface and subsurface drip irrigation systems. The overall wetted area, delimited by the wetting front was larger for the manually controlled irrigation scheduling with both surface and subsurface drip irrigation systems, smaller for the smart controller irrigation scheduling under both surface and subsurface drip irrigation systems, Al-Ghobari and El-Marazky, 2012).
Sustained irrigation agriculture is now critical for food production to support the growing uman population. Because almost all accessible fresh water resources in the arid region have been already committed, it is only natural to turn to non- conventional water resources for satisfying the accelerated rates of demand for fresh water. In many countries and regions, fresh water is relatively scarce, but there are considerable resources of saline water, which could be utilized for irrigation if proper crops, soil and water management practices were established (Rhoades et al., 1992 and Malash et al., 2005). Salinity can negatively impact plants through three major components; osmotic, nutritious, and
toxic stresses . When exposed to salinity, growth, development, and yield of most cultivated crops tend to decline with consequent reduction in their economic value (Pasternak and De Malach, 1995). However, the response pattern of many crop species may substantially change due to environmental conditions (e.g., soil properties and weather) as well as by agricultural practices (Shannon and Grieve, 1999) (e.g., irrigation methods). Considerable yields were obtained using saline irrigation water (4
– 12 dS/m) in crops that been previously defined as
moderately sensitive to salt stress (Pasternak and De Malach, 1995 and Bustan et al., 2004). Furthermore, in some crops (e.g., squash) the reduction in the fresh yield was compensated by an increase in fruit dry weight and other quality parameters (Pasternak et al., 1986).
Proper irrigation management consists of a number of practices, which when used together
facilitate the efficient application of water for crop production. These practices may need to be modified
and new practices introduced through adding the suitable irrigation water quantities in the optimum times when saline water is applied. Many factors should be considered in making management strategies such as crops, crop cultivars, local climate, soil type, salinity levels, irrigation method and water management practices ( Ferreyra et al., 1997; Shannon & Grieve, 1999 and Bustan et al., 2004) . Several brackish water irrigation experiments were
carried out in open fields on loamy soil to sand dunes
and the results evidently revealed that if suitable management practices were adapted, it was feasible to irrigate crops using relatively high saline water under arid conditions. When using low quality water, drip irrigation has several advantages over other irrigation methods; e.g., possible damage to the foliage is prevented and because of salts accumulation at the wetting front, soil salinity in the root zone is similar to the initial salinity in the irrigation water when the irrigation is managed properly (Aragues et al., 1999). Mathematical models and laboratory experiments
that describe water flow and salinity transports in
soil have been available for a long time. However, the number of inclusive soil salinity transport studies
at field scale is still rather limited. Field assessment of water flow and salinity transport in the soil is
essential for the design, operation, and management of saline water use with drip irrigation system (Khan et al., 1996 and Amente et al., 2000).
to 8.0 l/h. The relationships between application rates, soil properties, and the resulting water distribution for conventional drippers are well documented (Bresler et al., 1982). The wetting patterns during application generally consist of two zones; (i) a saturated zone close to the drippers and (ii) a zone where the water content decreases toward the wetting front. Increasing the discharge rate generally results in an increase in the wetted soil diameter and a decrease in the wetted depth (Ah Koon et al., 1990 and Assouline, 2002). Consequently, the water application rate is one of the factors, which determine the moisture and salt distribution around the dripper and the related root distribution and plant water uptake patterns. However, if the drippers had lower discharge
rates, we hypothesize that the efficiency of salt
removal out of root zone would have been greater. Some investigators developed different methods to allow the estimation of wetting patterns from point sources (Wang et al., 2006; Badr & Taalab,2007; Lazarovitch et al., 2007 and Malek & Peters, 2010).
Optimal management of salt accumulation
during and following subsurface drip irrigation system is especially important for high-value crops that are often salt sensitive. Understanding patterns of salt accumulation at the end of the growing season enables one to foresee a possible need to leach accumulated salts from the near surface by surface drip irrigation. This understanding forms
a combination of well- designed field experiments
and numerical modeling (Siyal et al., 2013). The main objective of the present work was to study the effect of irrigation method and irrigation water quantities under dripper discharges on different aspects of water and salt distribution to establish safe salinity levels of irrigation water and maintain crop production under drip irrigation system. Material and Methods
A split-split design field experiment with
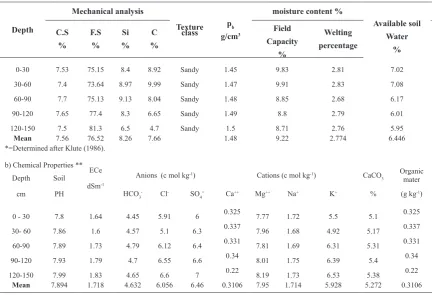
three replication for each treatment (Snedecor and Cochran, 1990) was conducted at El-Shiekh Zewied region in North Sinai during the summer growing season (March – June) 2015 using drip irrigation system. This area is a desert region and the soil of the experimental site was deep, well- drained sandy. The main analytical data of the soil and irrigation water used are presented in Tables 1 and 2. Drip tubing (2 TABLE 1. Analysis of the experimental soil
a) Physical properties*
Depth
Mechanical analysis
Texture class pb g/cm3
moisture content %
Available soil Water % C.S % F.S % Si % C % Field Capacity % Welting percentage
0-30 7.53 75.15 8.4 8.92 Sandy 1.45 9.83 2.81 7.02 30-60 7.4 73.64 8.97 9.99 Sandy 1.47 9.91 2.83 7.08 60-90 7.7 75.13 9.13 8.04 Sandy 1.48 8.85 2.68 6.17 90-120 7.65 77.4 8.3 6.65 Sandy 1.49 8.8 2.79 6.01 120-150 7.5 81.3 6.5 4.7 Sandy 1.5 8.71 2.76 5.95
Mean 7.56 76.52 8.26 7.66 1.48 9.22 2.774 6.446 *=Determined after Klute (1986).
b) Chemical Properties ** Depth cm Soil PH ECe dSm-1
Anions (c mol kg-1) Cations (c mol kg-1) CaCO
3 Organic mater
HCO3- Cl- SO4= Ca++ Mg++ Na+ K+ % (g kg-1)
0 - 30 7.8 1.64 4.45 5.91 6 0.325 7.77 1.72 5.5 5.1 0.325 30- 60 7.86 1.6 4.57 5.1 6.3 0.337 7.96 1.68 4.92 5.17 0.337 60-90 7.89 1.73 4.79 6.12 6.4 0.331 7.81 1.69 6.31 5.31 0.331 90-120 7.93 1.79 4.7 6.55 6.6 0.34 8.01 1.75 6.39 5.4 0.34 120-150 7.99 1.83 4.65 6.6 7 0.22 8.19 1.73 6.53 5.38 0.22
Mean 7.894 1.718 4.632 6.056 6.46 0.3106 7.95 1.714 5.928 5.272 0.3106
TABLE 2. Chemical analysis of groundwater used for irrigation**
pH EC
dSm-1
Soluble cations (meq/L) Soluble Anions (meq/L)
S.A.R
Ca++ Mg++ Na+ k+ CO
3- HCO3- Cl- SO4=
7.5 4.81 12.93 12.85 4.49 6.23 0 13.98 14.93 19.21 4.49
**= Determined after Page et al. (1982)
and 4 L/h discharges, 40 cm dripper spacing and 1.5 m apart) was either placed on soil surface (surface drip irrigation method) or buried 10 cm deep directly under the soil beds (subsurface drip irrigation method). Squash seeds were sown in rows (30 cm apart) on the beginning of March, 2015 (7000 plants/ fed.).
The treatments included application of equal volume of water at two different dripper discharge rates, 2 and 4 liter/hour with surface and subsurface drip irrigation methods. The actual crop water
requirement was estimated by multiplying reference
evapotranspiration with crop coefficient (ETc =ETo X
Kc) for different months based on crop growth stages using the model suggested by Penman-Montieth formula, (Allen et al., 1998). Nitrogen was fertigated on weekly basis at the rate of (250 kg ammonium sulphate /ha 20.5%N). This was done along with phosphorus (250 kg /ha super phosphate 15.5% P2O5) before two weeks of planting and potassium
(250 kg potassium sulphate /ha 52% K2O).
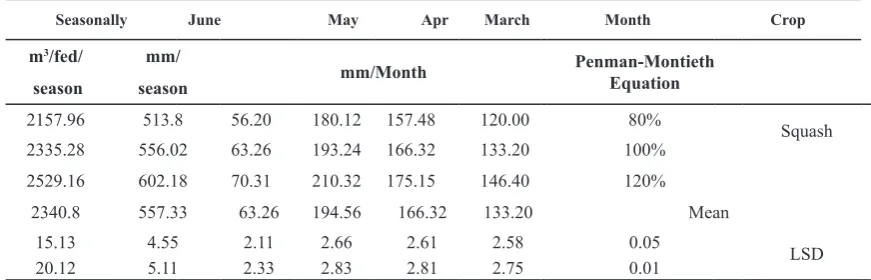
To determine moisture and salt distribution TABLE 3. Actual Evapotranspiration of Squash grown in the studied area.
Seasonally June May Apr March Month Crop
m3/fed/
season
mm/
season mm/Month
Penman-Montieth Equation
2157.96 513.8 56.20 180.12 157.48 120.00 80% Squash
2335.28 556.02 63.26 193.24 166.32 133.20 100%
2529.16 602.18 70.31 210.32 175.15 146.40 120%
2340.8 557.33 63.26 194.56 166.32 133.20 Mean
15.13 4.55 2.11 2.66 2.61 2.58 0.05 LSD
20.12 5.11 2.33 2.83 2.81 2.75 0.01
for each treatment, soil samples were taken from the wetted area just after the end of irrigation periodically at 4 weeks intervals. The sampling layout was radial and vertical intervals of 5 and 13 cm, respectively, starting 0 cm from the point of application and moving outward to the edge of the wetted front, using tube auger. Soil moisture content was determined gravimetrically. The EC were based on 1 :2.5 soil extracts and were determined using a conductivity meter. Squash fruits were collected periodically and at last pick of fruits all above ground biomass were collected and weighed. Average fruit weight and number of total fruits per plant were recorded.
The soil water content was determined gravimetrically immediately before and two days after each irrigation in 0-20, 20-40 and 40-60cm depth. Average daily rates as well as the monthly and seasonal actual Evapotranspiration amounts were calculated using the estimated average soil water content. Actual Evapotranspiration (ETa)
in mm of Squash as affected by applied different amounts of irrigation water are shown in Table 3.
The water economy for dry matter production was calculated by dividing the dry weights of the over ground parts (Kg/fed) by the amount of water added (m3/fed),
Water use efficiency of crop (WUE): WUE=
crop yield (Kg/fed)/ETa(Giriappa, 1983).
Data were subjected to statistical analysis of variance of the split- split plot design (ANOVA); according to the methods described by Snedecor and Cochran (1990).
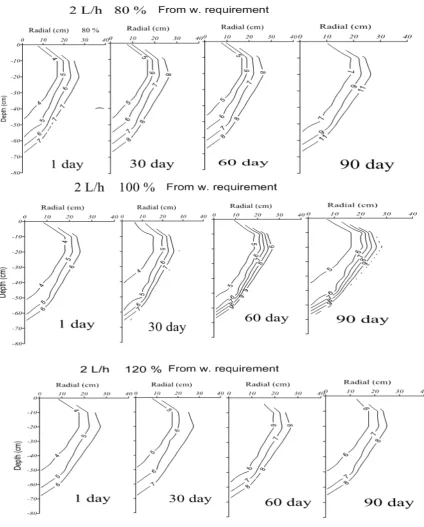
Results and Discussion Soil wetting patterns
and 4 liter/ hour seem to be located away from the drip line under the three amount of water applied, i.e., 80, 100 and 120% and comparing the higher discharge than the lower one. It can therefore be concluded that increasing the application rate allows more water to distribute in the horizontal direction, while decreasing the rate allows more water to distribute in the vertical direction. A saturated zone below the drip line was obtained only for the higher discharge rate at a radius of 20-25cm from the water source. For the lower discharge rate, there was no saturated zone below the dripper and the water content at that point decreased with decreasing the dripper discharge rate. The wetting front depths below the drip line were 70 and 60cm for the 2 and 4 l/h, respectively.
Relatively, the same distribution pattern was
observed in the subsurface drip irrigation ( the drip line was buried at 10 cm soil depth), except that surface soil later was not completely wetted as in the case of surface drip. However, the upward capillary movement of water was not sufficient
and soil water content at the surface decreased
significantly where most wetting occurred close to the water source. Again, in the lower discharge rate, the downward movement of water was more than its lateral movement due to gravity force playing a predominant role in the sandy soil of the experimental site. The overall wetted area, delimited by the wetting front was larger for the 2 L/h dripper discharge, and smaller for the 4 L/h practically under subsurface drip irrigation as also reported by Lubana and Narda (2001). Under both irrigation methods, the dry zone that
from w. requirementfrom w. requirement from w. requirement from w. requirement
from w. requirement from w. requirement from w. requirement
irrigation
developed in the soil profile halfway between the drip lines at 70 cm depth was larger for the 2 L/h dripper, and smaller for the 4 L/h dripper. This result indicates possible consequences for solute concentration patterns between the rows in drip irrigated crops due to fast losses of water applied through evaporation. The results are concurrent with Ah Koon et al. (1990) who investigated the effect of drip discharge rate on the water content distribution beneath a crop of sugar cane and they found that increasing the discharge rate resulted in an increased lateral movement of water and a decrease in the wetted depth, in agreement with the results of the laboratory experiment of Li et al. (2004) for determining the geometry of the wetted volume under point source irrigation. In the present experiment results indicate that
the absence of a saturated zone obtained with conventional dripper discharges, depending on the water amount applied. The results in agreement with Koenig (1997) when comparing conventional dripper discharges, he has described the water distribution resulting from micro-drip irrigation as characterized by the absence of a saturated zone and by a larger wetted zone, the plant water uptake, and the soil hydraulic properties.
Soil salinity during the season
Generally, soil salinity in surface drip irrigation increased throughout the growing season in all treatments at certain locations with relative differences according to the rate of discharge (Fig.2a & b). Saline water irrigation produced two different salinity zones, an upper salinity zone near
from w. requirement
% from w. requirement
from w. requirement
Fig.2b: Spatial distribution of salts in surface drip line during the growing season for the 4L/h discharge rates. The numbers labeling curves of contour lines indicate EC values (dS/m).
30 day
From w. requirement
From w. requirement
the soil surface where salinity levels are low near the drippers at the surface and a lower zone where the salinity levels increases with depth and with the distance from the water source. Soil salinity increased with increases in radius distance from the dripper and with advanced in crop growth for each discharge rate. Concentration of salts during the growing season under discharge rate of 2 L/h varied very little with time and was very close to the salinity of the irrigation water. The EC values at the radius of 40 cm ranged from (4.3 to 5.2) for 2 L/h, from (4.7 to 6.5) for 4 L/h, respectively. Therefore, squash plants grown under the lower discharge rate were in relatively less stressed environment than the other one indicating that relatively small changes in water movement bring about considerably changes in soil salinity. However, decreasing the discharge rate of applied water resulted in lower average salinity profiles significantly and led to a large reduction in the soil salinity at the end of the growing season. In addition, the increased volume of water percolated below the root zone helped in more leaching for salts as also reported by (Petersen, 1996). The higher discharge rate developed the higher salt concentration in the root zone and near the soil surface, due to shallow wetted depth, since water movement was directed horizontally rather than vertically. Capillary forces as well as the shallow wetted depth promote salt accumulation at the soil surface due to salt build up by evaporation components.
Subsurface drip resulted in higher salinity levels at the upper and lower soil layers than with surface drip irrigation and the salt concentration tended to increase significantly around the root system for both the dripper discharge rates (Fig. 3a & b). The EC values measured at a radius of 40 cm soil depth ranged from 4.5 to 6.7 for 2 L/h and from 4.7 to 8.8 for 4 L/h, respectively. Therefore, squash plants could be grown for a considerable period without higher stress with the lower discharge rate, because of the upper part of the root zone is relatively maintained at lower salinity level and the salinity stress might had some impact on root water uptake for both medium and high application rates. A similar pattern of salt accumulation with subsurface drip irrigation systems has been reported by Morvant et al. (1997) and Cox (2001).The higher concentration with subsurface irrigation can be expected because the dispersion flows of saline solution inside the wetted soil volume due to capillarity force and bulk flow (Reed, 1996).
Therefore, a progressive accumulation of the salts not used by the plant occurs in all the soil layers and especially in the upper portion of the soil (Molitor, 1990 and Reed, 1996).As indicated by the values of salt concentration in subsurface drip, the salts tended to concentrate in the upper layer where there were much less roots, which grew markedly in the lower region (as found by visual assessment). By contrast, decreasing salts from the top to the bottom of the wetted soil was found in surface drip, in which roots tended to occupy the whole wetted region. In subsurface drip, the salinity of the upper region was about two times higher than in surface drip irrigation, because a great deal of salts were directed to move upward by capillary forces. Hence, resulted in a relatively narrow vertical rang in salt concentration that showed a tendency to accumulate in the top region; the reverse phenomenon was observed in surface drip. However, the reductions in yield took place when the salt began to build up in the upper portion of the root zone regardless of soil depth. These results showed that the irrigation method and irrigation regime considerably affected soil salinity and salt distribution around dripper. Such results can improve our knowledge of practically using saline water under a drip irrigation system. Irrigation with saline water with salinity that exceeds the threshold salinity level of the crop would be expected to have a major impact on EC of the soil and crop yield. However, the EC of the soil may reach a limiting value in the lower portion of the root zone when we are forced to use saline water (Shalhevet, 1994).
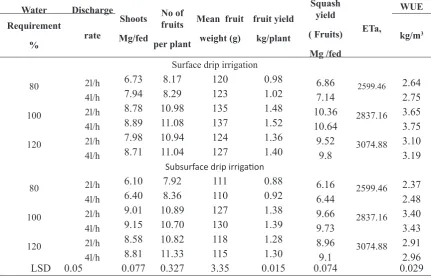
Squash yield
Yield reductions occurred with saline irrigation water and the lowest reduction was under 2 l/h discharge rate in both cases of irrigation method. Data presented in Table 3 stated that yield differences were statistically significant
lower by 35.4 & 36.77% in surface and subsurface drip irrigation with the lower discharge rate than the lower one while the yield reduction was more pronounced with subsurface drip irrigation and lower by 42% than with surface drip irrigation. Squash fruit yield showed that yields were higher in surface drip than in subsurface drip irrigation with all discharge rates.
Lower water use efficiency was observed in
subsurface irrigation with higher discharge rate can be expected due to a drastic reduction of yield and the increasing of evaporation losses
(the average of water use efficiency was 1.97 kg/
m3 for surface drip while it was 1.55 kg/m3 for
subsurface drip irrigation).
TABLE 3. Yield and yield components of Squash plants as influenced by dripper discharge rate and irrigation method. Water Discharge Shoots Mg/fed No of fruits per plant
Mean fruit
weight (g) fruit yield kg/plant Squash yield ( Fruits) Mg /fed ETa, WUE Requirement
% rate kg/m
3
Surface drip irrigation
80 2l/h 6.73 8.17 120 0.98 6.86 2599.46 2.64
4l/h 7.94 8.29 123 1.02 7.14 2.75
100 2l/h 8.78 10.98 135 1.48 10.36 2837.16 3.65
4l/h 8.89 11.08 137 1.52 10.64 3.75
120 2l/h 7.98 10.94 124 1.36 9.52 3074.88 3.10
4l/h 8.71 11.04 127 1.40 9.8 3.19
Subsurface drip irrigation
80 2l/h 6.10 7.92 111 0.88 6.16 2599.46 2.37 4l/h 6.40 8.36 110 0.92 6.44 2.48
100 2l/h 9.01 10.89 127 1.38 9.66 2837.16 3.40
4l/h 9.15 10.70 130 1.39 9.73 3.43
120 2l/h 8.58 10.82 118 1.28 8.96 3074.88 2.91
4l/h 8.81 11.33 115 1.30 9.1 2.96
LSD 0.05 0.077 0.327 3.35 0.015 0.074 0.029
Squash is considered moderately sensitive to salt stress, since it can tolerate a soil salinity ( EC of the saturated soil extract) of about 1.72 dS/m and fruit yield decrease by approximately 10% with each unit of EC increasing above the threshold value ( Maas, 1986).
In the present study, the threshold value was similar to the value reported by Maas, 1986, where the maximum yield was depressed by about 30.51% than the statewide variety average yield. However, the differences that were found in squash response can be explained by the fact that of salinity in the root zone, there is an increase of crop tolerance to salinity because the root growth occurred mostly in the lower 20-30 cm layer where the EC of the soil is more favorable. Plants grown with subsurface drip irrigation gave a lower total yield than those grown with surface drip irrigation because of the higher soil salinity due to the upward
flow of water and salt accumulation in the root
zone leading to a moderate plant stress especially with higher discharge rate, while with surface drip irrigation, the mentainance of highly leached root zone reduces the detrimental effects of salinity on growth and yield. Similar results on the effects of the two systems under saline condition (surface drip versus subsurface drip irrigation) were also obtained by Santamaria et al., (2003), who found that with drip irrigation the squash production was
almost 20% higher than with subsurface irrigation as a result of the lower soil salinity. Moreover, Scholberg and Locascio (1999) observed that the total dry weight, total fruit yield, marketable fruit yield and average fruit weight of squash were higher with surface drip than with subsurface drip irrigation. Salinity decreased total squash yield by reducing both mean fruit weight and the number of fruit per plant. These results are consistent with
the findings reported on snap bean and tomato,
(Scholberg and Locascio, 1999), cultivated on sandy soil.
Generally, drip irrigation should be adopted when farmers are forced to use saline water for irrigation. The choice of the irrigation system coupled with appropriate discharge rate appears to be of foremost importance when using low quality irrigation water. Unlike subsurface irrigation by using drip irrigation with saline irrigation water (4.81 dS/m) would be one of a good solution for the problem yield reduction and improving the
water use efficiency.
References Ah Koon, P.D., Gregory, P.J. and Bell, J.P. (1990)
Al-Ghobari, H. M. and El Marazky, M. S. A. (2012) Surface and subsurface irrigation systems wetting patterns as affected by irrigation scheduling techniques in an arid region Hussein. Afr. J. Agric. Res. 7(44), pp. 5962-5976.
Allen, R.G., L.S. Pereira, Raes, D. and Smith, M. (1998)Crop evapotranspiration. Guidelines for computing crop water requirements. FAO irrigation and Drainage. Paper No. 56, FAO, Rome, Italy, pp: 300.
Amente, G., Backer, M.J. and Reece, C.F. (2000) Estimation of soil solution electrical conductivity from bulk soil electrical conductivity in sandy soil.
Soil Sci. Am. J., 64, 1931-1939.
Aragues, R., Playan, E., Ortiz, R. and Royo,A. (1999) A new drip-injection irrigation system (DIS) for crop salt tolerance evaluation. Soil Sci. Soc. Am. J.
63, 1397-1404.
Assouline, S. (2002) The Effects of micro drip and conventional drip irrigation on water distribution and uptake. Soil Sci. Soc. Am. J., 66, 1630-1636.
Badr. M.A. and Taalab, A.S. (2007) Effect of Drip Irrigation and Discharge Rate on Water and Solute Dynamics in Sandy Soil and Tomato Yield. Aust. J. Basic & Appl. Sci., 1(4): 545-552, 2007.
Bresler, E., Mc Neal, B.L. and Carter, D.L. (1982)"Saline and Sodic Soils". Advanced Series in Agricultural Sciences 10. Springer-Verlag, Berlin.
Bustan, A., Sagi,M. De Malach, Y. and Pasternak, D. (2004) Effects of saline irrigation water and heat waves on potato production in an arid environment.
Field Crops Res., 90, 275-285.
Cox, D.A. (2001) Growth, nutrient content and growth medium electrical conductivity of poinsettia irrigated by subirrigation or from overhead. J. Plant Nutr., 24, 523-533.
Elmaloglou, S., Diamantopoulos, E. and Diamantopoulos, N. (2010) Comparing soil moisture under trickle irrigation modeled as a point and line source. Agric. Water Manage. 49 (97), 426-432.
Ferreyra, R.E., Aljaro, A.U., Ruiz, R.S., Rojas,L.P. and Oster, J.D. (1997) Behavior of 42 crop species grown in saline soils with high boron concentrations. Agric. Water Manage., 34, 111-124.
Giriappa, S. (1983) Water use efficiency in agriculture. Agricultural development and rural transformation
unit. Inst. for Social and Economic Change Bangalore. Oxford & IBH Publ. Co.
Karlberg, L., Rockstrom, J., Annandale, J.G. and Steyn, J.M. (2007) Low-cost drip irrigation. A suitable technology for southern Africa: An example with tomatoes using saline irrigation water. Agricultural water management, 89, 59-70.
Khan, A.A., Yitayew, M. and Warrick, A.W. (1996) Field evaluation of water and solute distribution from a point source. J. Irrigation Drainage Eng.,
ASCE, 22(4), 221-227.
Klute, A.A (1986) Methods of Soil Analysis. Updated Part 1 2nd ed. American Society of Agronomy .Inc. Publishes, Madison, Wisconsin, USA.
Koenig, E. (1997) Methods of micro-irrigation with very small discharges and particularly low application rates. (In Hebrew.) Water Irrig., 365, 32-38.
Lazarovitch, N, Warrick, A.W., Furman, A. and Simunek, J. (2007) Subsurface water distribution from drip irrigation described by moment analyses.
Vadose Zone J. 6,116:123.
Li, J., Zhang, J. and Rao,M. (2004) Wetting patterns and nitrogen distributions as affected by fertigation strategies from a surface point source. Agricultural Water Management, 67, 89-104.
Lubana, P.P.S. and Narda, N.K. (2001) Modeling soil water dynamics under trickle emitters - a review. J. Agric. Eng. Res., 78, 217-232.
Maas, E.V. (1986) Salt tolerance of plants. Applied Agricultural Research, 1, 12-26.
Mailhol, J.C., Ruelle, P., Walserb, S., Schützeb, N. and Dejeana, C. (2011 ) Analysis of AET and yield predictions under surface and buried drip irrigation systems using the Crop Model PILOTE and Hydrus-2D. Agric. Water Manage. 98,1033-1044.
Malash, N., T.J. Flowers and R. Ragab, (2005) Effect of irrigation systems and water management practices using saline and non-saline water on tomato production. Agricultural Water Management, 78, 25-38.
Malek, K. and Peters, R.T. (2010) Wetting pattern models for drip irrigation: a new empirical Model. doi:10.1061/(ASCE)IR.1943-4774.0000320. Minhas, P.S. (1996) Saline water management
1985. Effects of salinity on quality of various agricultural crops. Plant Soil, 89, 301-307.
Molitor, H.D. (1990) The European perspective with emphasis on subirrigation and recirculation of water and nutrients. Acta Hort., 272, 165-170. Morvant, J.K., Dole, J.M. and Allen, E. (1997)
Irrigation system alter distribution of roots, soluble salts, nitrogen and pH in the root medium. Hort. Tech., 7, 156-160.
Page, A.L. Miller, R.H. and Keeney, D.R. (1984) Methods of soil analysis. Part 2: Chemical and Microbiological Properties. Second edition. Agronomy J. 9: 2, Am. Soc. Agron. Inc., Soil Sci. Soc. Am. Inc. Pub. Madison, Wisconsin, USA.
Pasternak, D. and De Malach, Y. (1995) Crop irrigation with saline water. In: Pessarakli, M. (Ed.),Handbook of Plant and Crop Stress. Marcel Dekker, Inc., NY, 599-622.
Pasternak, D., De Malach, Y. and Borovic,I. (1986) Irrigation with brackish water under desert conditions VII. Effects of time of application of brackish water on production of processing tomatoes (Lycopersicum esculentum Mill.). Agric. Water Manage., 12, 149-158.
Petersen, F.H., (1996) Water testing and interpretation. In: Reed, D.W. (ed.) Water, media, and nutrition for greenhouse crops. Batavia: Ball, cap., 2, 31-49.
Phene, C.J. (1995) Research trends in micro irrigation. In: Lamm, F.R. (Ed.), Micro irrigation for a Changing World: Conserving Resources/ Preserving the Environment. Orlando, Florida, USA, 2e6 April 1995. Proceedings of the Fifth International Micro irrigation Congress. American Society of Agricultural Engineers, St. Joseph, Michigan. p. 6e24.
Reed, D.W. (1996) Closed production systems for containerized crops: recirculating subirrigation
and zero- leach system. In: Reed, D.W. (Ed.), Water, Media and Nutrition for Greenhouse Crops. Ball Publishing, Batavia, IL, USA: 221-245.
Rhoades, J.D., Kandiah, A. and Mashali, A.M. (1992)The use of saline waters for crop production. FAO Irrigation and Drainage paper. FAO, United Nations, Rome, pp: 48. Santamaria, P., Campanile,G., Parente, A.
and Elia, A. (2003). Subirrigation vs. drip-irrigation: effects on yield and quality of soilless grown cherry tomato. J. Hortic. Sci. Biotechnol., 78, 290-296.
Scholberg, J.M.S. and Locascio, S.J. (1999) Growth response of snap bean and tomato as affected by salinity and irrigation method. HortScience, 34(2),259-264.
Shalhevet, J. (1994) Using water of marginal quality for crop production: major issues. Agric. Water Manage., 25, 233-269.
Shannon, M.C. and Grieve, C.M. (1999) Tolerance of vegetable crops to salinity. Sci. Hort., 78, 5- 38.
Siyal, A.A., Van Genuchten, M. Th. and Skaggs,T.H. (2013) Solute transport in a loamy soil under subsurface porous clay pipe irrigation. Agric., Water Management. V(2) pp, 73-80.
Snedecor, G.W. and Cochran W.G. (1990) Statistical Methods 7th ed. Iowa State Univ., Press. Ames, Iowa, USA, PP. 507
Wang, F.X., Kang, Y. and Liu, S.P. (2006) Effects of drip irrigation frequency on soil wetting pattern and potato growth in North China Plain. Agric. Water Manage. 79, 248-264.
فورظ تحت ىحلملاو ىئاملا عيزوتلا طامناو جذامن ىلع طيقنتلاب ىرلا ماظن ريثات ةسارد ضرغب ةيلقح ةبرجت تيرجا .(ةسوكلا) راضخ لوصحم جاتنا ةدايزل ةمئلام ةيئام ةرادا حارتقلا كلذو 2015 سرام ءانيس لامش ديوز خيشلا ةقطنم ةبوسحم %120 ، 100 ، 80 ىر ةايم تايمك ثلاث ةفاضاو ىحطسلا تحتو ىحطسلا طيقنتلاب ىرلا ماظن قيبطت مت اذل ىئاصحلاا ليلحتلا مدختساو ، ةعاس / رتل 4 ،2 فرصت تلادعم تاذ طاطاقن مدختسا .ثيتنوم نامنب ةيخانملا ةلداعملا نم .ىلاتلاك جئاتنلا تناكو نيترم ةقشنم عطق تاذ (ةيلماع ةبرجت) 1
- .ًايسأرو ايقفا طاقنلا نع دعبلاب ةبرتلاب ىبوطرلا ىوتحملا ضافخنا 2
- حتن رخبلا ةلداعم نم ةبوسحملاو فاضملا ىرلا ءام هيمك ةدايز دنع تاطاقنلا نم برقلاب ىبوطرلا ىوتحملا داذ كلذك /رتل 4 طاقن فرصت دنع ناك ىبوطر ىوتحم ىلعا ناكو . %80 > %100 > %120 ىلاتلاك بيترتلا ناكو ىعجرملا
.%120 ةفاضم ىر ةايم تايمكو ةعاس 3
- تحتلا طيقنتلاب ىرلاب ةنراقم ىحطسلا طيقنتلاب ىرلا ماظن تحت هبرتلا حطس نم برقلاب ىبوطرلا ىوتحملا داذ .ىحطس 4
- ايسار هبوطرلا كرحت داز ةعاس / رتل 2دنع اما ايقفا ةايملا كرحت ىلإ ىدأ ةعاس / رتل 4 ىلا طاقنلا فرصت لدعم هدايز .لفسلاو 5
- كلذ سكع ناك تاطاقنلا فرصتل ىحلملا عيزوتلا امنيب ايسارو ايقفا تاطاقنلا نع دعبلاب ةبرتلا ىف ىحلملا زيكرتلا داز مسوم للاخ ةعاس / رتل 2 لقلاا فرصتلاب ةنراقم دنع ةعاس / رتل 4 طاقنلا فرصت ةدايزب ةبرتلا ىف ىحلملا زيكرتلا داز اذل .ىرلا ءام عم حلاملاا مكارتل ارظن ومنلا 6
- اديعب لفسلأو ايسار حلاملاا كرحتب ىحلملا زيكرتلا لمحت ىلع روذجلا ةدعاسم ىلا ىحطسلا طيقنتلاب ىرلا ماظن ىدا روذجلا راشتنا ةقطنم نع 7
- تحتلاو ىحطسلا طيقنتلاب ىرلا ماظن نم لك تحت %5 ىوتسم دنع هيونعم هدايز حلاملأا زيكرت داذ ومنلا مسوم ءانثا . بيترتلا ىلع موي > موي 30 > موي 60 > موي 90 دنع تناكو ىحطس 8
- ىحطس تحتلا ىرلا دنع ةعاس /رتل 2 فرصت تحت ةحلاملا ةايملا مادختسا ببسب ايجولويب لوصحملا ضافخنا .ىر ءام %100 دنعو ىحطسلا ىرلا مادختسا دنع روذجلا ةقطنم ىف ىحلمو ىئام عيزوت لضفا تطعاو 9
- هايم %100 ةفاضإو ةعاس /رتل 4 تاطاقن فرصتب (نادف/نط 7.59) جاتنا ىصقا ىحطسلا طيقنتلاب ىرلا ماظن ىطعأ (نادف/نط 7.41) تطعا ثيح هفاضلاا سفن دنع ةعاس /رتل 2 تاطاقن هيلي ىعجرملا حتن رخبلا ةلداعم نم ةبوسحم ىر ىحطس تحتلا طيقنتلاب ىرلا ماظن تحت (نادف/نط 4.4) جاتنا لقا ناك امنيب، %5 ىوتسم دنع هىونعم ةدايزلا تناكو .ىر هايم %80 ةفاضإو ةعاس /رتل 2 طاقن فرصتو / رتل 4 فرصتلا لدعمو %100 ةيئاملا تاجايتحاب ىرلا دنع ىحطسلا ىرلاب ًايونعم ىئاملا كلاهتسلاا ةءافك تداز-10 .ةعاس