DEVELOPMENT OF A SPARSE RFID READER DEPLOYMENT
ALGORITHM FOR EFFECTIVE RFID NETWORK PLANNING
M. F. Munkailu
1,*, S. M. Sani
2and A. M. S. Tekanyi
31,
N
IGERIANI
NSTITUTE OFT
RANSPORTT
ECHNOLOGY,
PMB
1148,
Z
ARIA,
K
ADUNAS
TATE.
NIGERIA
2,3,
D
EPARTMENT OFC
OMMUNICATIONSE
NGINEERING,
A
HMADUB
ELLOU
NIV.,
Z
ARIA,
K
ADUNAS
TATE.
NIGERIA
E-mail addresses:
1[email protected]
,
2[email protected],
3[email protected],
ABSTRACT
A well planned Radio Frequency Identification (RFID) network achieves the following twin objectives, (a) reduces the cost of acquiring the readers to be deployed (b) completes coverage of tags deployed in the network. A reader deployment approach that considered the physical topology of passive tags that were sparsely deployed in a RFID network was developed. In the implemented technique, readers could not be deployed outside the work area which implied that tags located outside the work area could not be detected. Bidirectional communication between the readers and tags could only be established if their receiver sensitivity was less than or equal to the incoming signal. The developed algorithm was optimized by logically integrating some sub-algorithms such as Useless Reader Elimination Algorithm (UREA) and Redundant Reader Elimination Algorithm (RREA). The effectiveness of the developed Sparse Reader Deployment Algorithm (SRDA) was demonstrated through simulation of various scenarios. The implemented approach was compared to the Constrained Reader Deployment Approach (CORDA) and the former outperformed the latter in terms of Optimal Power Dissipated (OPD) which was 255mW. The impact of increasing the number of tags and coverage area on the OPD of SRDA was investigated in a bid to ascertain the robustness of the developed algorithm.
Keywords: RFID; CORDA; SRDA; OPD.
1. INTRODUCTION
Radio Frequency Identification (RFID) is a wireless technology used in tagging and identification of objects [1]. RFID systems consist of three core components, namely, tag, reader, and controller or RFID server. The legacy counterparts of RFID technology such as barcode and magnetic strip suffer several drawbacks of requiring human intervention before scanning a tagged object, low storage capacity, and line of sight communication [2]. Some areas of application of RFID technology are logistics, production, and supply chain management. Asset tracking requires the deployment of a sufficient number of readers in a bid to achieve complete tag coverage [3]. This gives rise to some challenging issues in the deployment of an RFID network, such as optimal tag coverage, Quality of Service (QoS), and cost efficiency [4].
RFID technology has also been used to build the Internet of things (IoT). IoT is a network that connects physical things to the Internet and enables remote access of sensor data in a bid to control the physical
world from a distance [5]. A RFID system is constrained by the number of readers to be deployed, where to place the reader in the network, and the Reader and tag antenna orientation.
This paper deals with dynamic programming which is an exact optimization method that solves an optimization problem by splitting it into a collection of simpler sub-problems. In this work, SRDA is used to optimally deploy readers in an RFID network environment in which tags a sparsely placed in a decision environment. This strategy achieves triple objective of complete tag coverage, eliminating redundant readers and ensuring that no useless reader exist in the network.
The subsequent part of the paper is organized in sections. In section II, related works are discussed. Section III briefly explains the system model and assumptions made. Section IV discusses the results obtained from the implemented work. Section V concludes the work and proposes future work.
Copyright© Faculty of Engineering, University of Nigeria, Nsukka, Print ISSN: 0331-8443, Electronic ISSN: 2467-8821
www.nijotech.com
2. RELATED WORKS AND CONTRIBUTIONS
In this section, the related works and contributions of the work were briefly discussed.
2.1 Related Works
Attempts have been made by several works to address RFID Network Planning (RNP) mono-objective or multi-objective problems.
The work of [2] and [6 - 10] addressed the issue of coverage and reader redundancy. These works laid more emphasis on redundant reader elimination using techniques such as Layer Elimination Optimization (LEO), Redundant Reader Elimination (RRE) algorithm and RRE+LEO.
The works of [3 - 5] are closely related to this work because their implemented approach tried to address Multi-objective Optimization RFID Network Planning (MORNP) problem related constraints. In their work, techniques for optimal reader deployment which were capable of maximizing coverage and eliminating redundant readers were developed. The superiority of the technique to each other was ascertained by validation. However, the problem formulation of these techniques did not take cognizance of some aspects of RNP problem considered such as elimination of useless readers and did not show simulation time which is of great significance in a practical RFID network.
In SRDA just like CORDA, sub-algorithms such as Useless Reader Eliminator Algorithm (UREA), Overlapping Reader Detection Algorithm (ORDA), and Redundant Reader Eliminator Algorithm (RREA) were integrated into the developed reader deployment approach in a bid to achieve optimal reader topology design.
3. SYSTEM MODEL
The system model of this work is discussed in phases as follows:
3.1 RFID Communication Medium
In this paper, a passive RFID tag which operates between the frequency range of 860 MHz – 960 MHz is used for the MORNP. Passive RFID tags draw the power required for operation from the radio wave transmitted to them by the reader and communicate with the reader by reflecting the incident wave it receives from the reader [4]. This technique is referred to as backscattering modulation. It is assumed that the sensitivity of the receiver of a tag decreases as it moves away from the reader. The signal power of the passive tag considered is also assumed to diminish as the inverse square of the distance ( ⁄ ) from the reader.
The transmitted power received by a tag can be computed from Friis far-field transmission formula for unobstructed narrow-band propagation as:
( )
where: is the transmitted power by reader, is
the antenna gain of the reader, is the antenna gain of the tag; δ is communication margin between the reader and the tag, is the wavelength of the signal transmitted.
The maximum operating distance at which a tag can receive a transmitted signal can by computed from equation (1) as:
√
The signal transmitted to the reader by a passive tag in its coverage area decreases with free space and it can be calculated as [1]:
The implication of equation (1) is that, the signal power received by the reader from the tag decreases at the
rate of ( ) . represents backscatter power sent by
the tag and depends on the tag reflection coefficient Γ and tag received power (in watts) [8].
3.2 Objective Functions
The objective function that guided the search pattern for the implemented technique is itemized in order of priority as follows:
a) Complete tag coverage: The main goal of any RNP is to ensure that all tags deployed in an RFID network is completely covered. In this work, achieving this objective was guaranteed due to the initial reader deployment strategy employed. b) Elimination of useless readers: The initial reader
population deployment strategy implemented ensured that useless readers were not found in the work area. However, if a manual procedure was used to deploy readers, useless readers might have been found, as such the Useless Reader Eliminator Algorithm (UREA) ensured that such readers were totally eliminated.
eliminated, all the tags are still detected and covered. In the implemented approach, a redundant reader was investigated by initially eliminating it and then computing the Number of Tags not detected (NTnd) and ensuring that the condition that NTnd was equal to zero was satisfied. If it did, the eliminated reader was redundant, else the eliminated reader was not redundant, and as such it was replaced. The process is continued until all the readers were tested for redundancy.
4. IMPLEMENTED APPROACH OF READER DEPLOYMENT.
In this work, the following assumptions were made: a) Tags were present within a predefined coverage
area
b) Readers were allowed to be deployed only within the coverage area in a constrained manner.
c) Tags were sparsely deployed. d) Tags deployed were passive tags.
In view of the assumptions, readers deployed at initial instant were gradually screened based on the desired target functions to verify their necessity. This screening procedure classified the readers into the following categories:
a) Useless Readers: are readers that were deployed to the network but cover no tag.
b) Redundant Readers: are readers whose absence does not affect the actualization of the objective function of complete coverage of tags.
c) Overlapping Readers: are readers that overlap with each other.
The major advantage for the implemented approach was that, the population of readers either decreased or remained constant over the simulation period, which in-turn guaranteed convergence and robustness. This kind of method could be used for highly constrained reader deployment problems with a large number of tags to be detected over a wide coverage area. Just like CORDA, the implemented approach is characterized by: where: NUT represents the number of uncovered tags, NUR represents the number of useless readers and NT represents number of tag deployed.
Coverage Area of Tag (CAT) is computed using the following formula:
Where L and B represent length and width of the coverage area in which tags can be found.
Density of Tags (DT) is computed as:
Initial Density of Readers (IDR) is computed using the following formula.
INRD represents the initial number of reader deployed. Optimal Density of Reader (ODR) is defined using the following mathematical relationship:
Optimal Number of Reader (ONR) deployed in the work area is given by:
– – where: NRR represents redundant readers.
4.1 Reader Generation
In this work, a reader was considered to be a circular disc with radius r and having concentric layers , , which were the respective co-ordinates of readers deployed. Hence, a reader can be represented as follows:
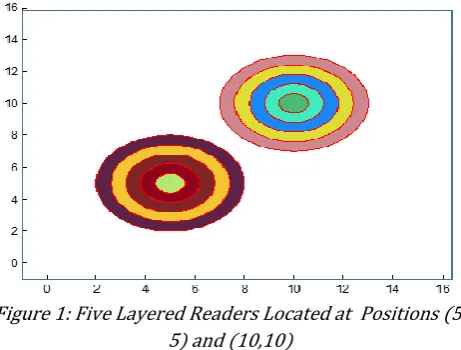
d r r r l d This means that a two layered reader having a communication range of 1m is located at positions (1, 1). Once these parameters are specified, the required reader can easily be generated at the desired location. Figure 1 illustrates two 5 layered reader located at position (10, 10) and (5, 5) respectively.
Figure 1: Five Layered Readers Located at Positions (5, 5) and (10,10)
In the implemented approach, a population of reader was created only once throughout a simulation period. The population was gradually optimized until an optimum topology was obtained.
4.2 SRDA
In this reader deployment approach, positions of the readers are set as that of the tags. Therefore, if XT and XR are the X coordinates of the tags and readers, respectively, then equations are used to define the X and Y coordinates of the readers.
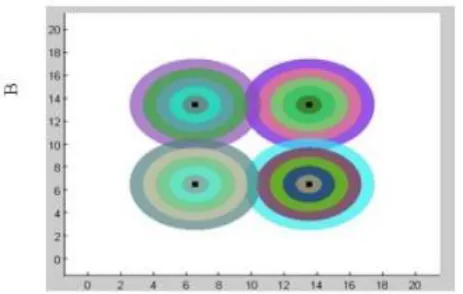
Figure 2 depicts the generation of reader population using SRDA. This approach has the advantage of making use of fewer numbers of readers and thus requires less computation than CORDA. In the case of sparse distribution of tags over a coverage area, SRDA is more suitable for optimal deployment of reader. But if the density of tags is very high, CORDA performs better. This assertion can be verified from the 0.3591 sec convergence time; and 255mw of optimal power dissipated of SRDA in table 2. From table 2, it can be seen that the INRD of CORDA was 500 while that of SRDA was 100 and still CORDA was able to converge at 10.5101 sec with an optimal power dissipated of 269mw.
Figure 2: Reader Population Generation Using SRDA
SRDA guarantees complete tag coverage at a very reasonable time, thereby, making it an excellent candidate for RFID reader deployment in mobile RFID systems. In SRDA, the number of initial readers deployed is always equal to the number of tags to be detected.
4.3 Optimization of SRDA
This algorithm made use of a multi-objective optimization approach to achieve an optimum reader topology design. It invoked a set of sub-algorithms to achieve multi-objective optimization. These sub-algorithms included.
i. Useless reader eliminator algorithm ii. Redundant reader eliminator algorithm iii. Overlapping reader detector algorithm
In the implemented method, no useless reader was found due to the way in which readers were deployed in the decision environment. However, if any of the reader deployment techniques used by [5 – 7] was used to deploy the reader initially, useless readers were found and such reader were totally eliminated by the
Useless Reader Eliminator Algorithm (UREA) developed. The pseudo-code for UREA is provided in Algorithm 1:
Algorithm 1 UREA
Start
Input XT and YT (coordinate of tags)
Input XR and YR (coordinate of readers)
Initialize the reader-tag distance DRT using DRT = (XR * XT)* Zero
For i = 1: (no of rows in DRT)
For j = 1: (no of columns in DRT)
DRT(i, j) = √( ) ( )
end end
Initialize the reader – tag matrix MRT using
MRT = DRT
For K = 1: (No of columns in MRT)
MRT(:,K) = [(DRT(:,K) – (1-δ_ R) < = 0]
end
For L = 1: (No of rows in MRT)
If sum (MRT(L, :)) = 0
Reader L is a useless reader MRT (L, :) = [ ] (eliminate it )
Stop
However, was the communication margin and was used to define the allowable maximum distances of a tag from a reader ≤ δ ≤ he higher the value of δ the more closer was the tag to the centre of its reader. When δ a tag was onl detected if it was at the centre of the circle while δ signified that a tag could be detected even if it was at the edge of the circle. Also, MRT was the information matrix and it contained all the information about the network topology. All the information about the network configuration could be derived from it.
On the other hand, a redundant reader is defined as a reader whose absence makes no difference in the condition of the network at that instant of time. This means that, even if such reader is eliminated, all the tags are still detected /covered. In the implemented approach, a redundant reader was investigated by initially eliminating it and then computing the Number of Tags not detected (NTnd) and ensuring that NTnd = 0 was satisfied. If it did, then the eliminated reader is redundant. Else the eliminated reader was not redundant and it was replaced and the process was continued till all the readers were tested for redundancy. The pseudo-codes for the RREA is presented in Algorithm 2.
Start
Input the information matrix MRT
M = MRT (assign the value of MRT to M)
For i = 1: (No of rows in MRT)
N = M: K = 0i N (i,:) = [ ];
For j = 1: (No of columns in N) If sum (N(:,j)) = 0
K = k +1 end end If K = 0
Reader i is redundant else
Reader i is not redundant end
rr = [rr, i]; end
Eliminate the readers of row Stop
RREA is used to detect and eliminate redundant readers from the RFID network. In this work, a number of parameters were used to distinguish the characteristics of the RFID topology design. Though, some other parameters were also used to describe the performance of the implemented algorithm. However, the entire parameters are briefly described as follows. a) Initial Power Dissipated (IPD) is computed as in
[11] using equations (14) to (19).
log
log
∑ ∑
where: denotes the power dissipated by a single tag in mW, denotes the power loss coefficient in dB,
denotes the distance between reader r and tag t, F
denotes the frequency of operation MHz, opt R
N
denotesthe number of readers at optimum configuration,
o
R
N
denotes the number of readers initially deployed,
N
Tdenotes the number of tags to be detected
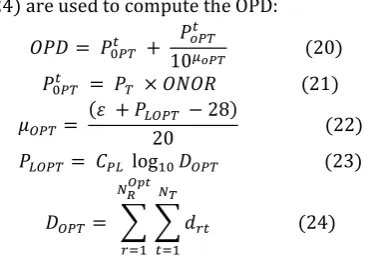
b) Optimal Power Dissipated (OPD) is computed using similar equation as those of the initial power dissipated with the reader configuration replaced
with the optimum configuration. Equations (20) to (24) are used to compute the OPD:
log
∑ ∑
5. SIMULATION RESULT
A set of suitable simulation parameter settings were selected as shown in Table 1 in order to demonstrate the effectiveness of the developed models and algorithms. These set of parameters are used throughout the simulation. The developed models and algorithms are MATLAB based.
Table 1: Simulation Parameter Values
Parameters Value
XMIN 0
YMIN 0
Operating Frequency 960 MHz
Number of Layers 2
Power Loss Coefficient 10dB
Power Dissipated Per TAG 10mW
Communication Margin 0
In this simulation scenario, 100 tags were placed in a square area bounded by XMAX = YMAX = 100m. Readers with a radius of 20m were to be optimally deployed to detect all the tags. All other parameters remain as in Table 1. SRDA and CORDA were used separately to deploy readers. The numerical results are presented in Table 2, while the optimum configuration for each of the approaches is shown in Figures 3.
Table 2: Simulation for SRDA and CORDA
Parameters SRDA CORDA
Tsim (CPU
sec) 0.3591 10.5101
NT 100 100
INRD 100 500
ONTLOR 44 55
INTLOR 100 100
CAT (m2) 10000 10000
DT (m-2) 0.01 0.01
IDR (m-2) 0.01 0.05
NUR 0 0
Parameters SRDA CORDA
NRR 88 488
ODR (m-2) 0.0012 0.0012
ONR 12 12
IPD (mW) 3900 38785
OPD (mW) 255 269
CORDA SRDA
Figure 3: Optimum Readers Network Topologies
Based on Figure 3, it can be observed that both SRDA and CORDA deployed readers in accordance with the topology of the tags. Therefore, convergence of the proposed solution strategy is guaranteed. The unique feature of any RFID network topology is easily described based on the power consumption of the reader-tag network, which depends on the number of readers, tags, and the topology of both the readers and tags. In this work, the Optimum Power Dissipated (OPD) by the network at the final stage was used as a basis for comparison as shown in
Table 2. Two cases were used to study the impact of varying some parameters of SRDA on its OPD. The variation of OPD with changes in the number of tags and increase in the coverage area was studied. In the first case, the number of tags was varied between 1 and 100, while the coverage area was kept constant at 100 x 100m. In the second case, the coverage area was varied while both the number of tags and reader communicating range were kept constant at 100 and 20m, respectively. All other parameters were same as in Table 1. Simulation was carried out using SRDA. The OPD was noted at each stage and plotted as shown in Figure 4 and Figure 5, respectively.
OPD also varies in the same pattern with increase in the number of tags over a fixed area as shown in Figure 4. In general, OPD increased with an increase in density of the tags. However, the OPD increased to a certain value and remained relatively constant over a further increase in density.
Figure 4: Variation in OPD with an increase in Number
Figure 5: Variation in OPD with increasing coverage area
This scenario can be considered as that of decreasing density of tags. Therefore, since the tags were generated automatically at each instant and distributed randomly over the entire area, it meant that the probability of the tags been close to one another was less, and as such more readers were needed to cover such tags. It can be observed in Figure 5 that OPD vary relatively slightly with decreasing density and tends to converge to a small value with further decrease in coverage area.
6. CONCLUSION
topology that is not sparse. The main contributions of this work are:
1) Development of SRDA that optimally deploys readers to cover sparsely deployed tags.
2) Validation of SRDA by comparing it with CORDA in terms of OPD. The SRDA improved the OPD of CORDA by 5.5%.
However, developing a reader deployment technique that simultaneously eliminates high density tags and sparsely deploys tags could be considered as future study. Also, validating the technique to be developed against other state of the art reader deployment technique could form part of the future study.
7. REFERENCES
[1] P lbert “ F a Guide o adio Frequenc dentification” Wiley-Interscience, John Wiley & Sons, Inc., Publication, p.p 1 241.
[2] Xuhui and Jinlong Zhao “ he nal sis and Research of the Hybrid Redundancy Elimination lgorithm ased on F Middleware eader” in Research Journal of Applied Sciences, Engineering and Technology, Vol 6, p.p 3022 – 3026, 2013.
[3] B. Nebojsa, T. Milan J aka “Hierarchical Multi-objective RFID Network Planning using Firefly lgorithm” in International Conference on Information and Communication Technology Research p.p 282-285. 2015.
[4] M. Lianbo, C. Hanning, H. Kunyuan, and Z. Yunlong “ Multiobjective RFID Network Optimization Using Multiobjective Evolutionary and Swarm ntelligence pproaches” in Hindawi Publishing Corporation. Mathematical Problems in Engineering, Vol (p.p 1-13)., 2014.
[5] ebojsa Milan and S vana “ F etwork Planning by ABC Algorithm Hybridized with Heuristic for Initial Number and Locations of eaders” in th KS M-AMSS International Conference on Modelling and Simulation, p.p 1-6, 2015.
[6] B. Carbunar, M. K. Ramanathan, M. Koyuturk, et al “ edundant eader Elimination in RFID S stems” Department of computer Science, Purdue University, West Lafayette, IN, p.p 1 – 14, 2005.
[7] B. Miodrag, A. Akshay, and H. L. Tzu, “Performance of Passive HF F S stems in Practice” RFID SYSTEMS. School of Information Technology and Engineering, University of Ottawa, Canada, p.p 3-21, 2010.
[8] H. Jui-Wen, L. I-Hui, L. Hsin-Hung, C. Jyun- n “ he first search right algorithm for redundant reader elimination in F network” in department of information and management, ling tung university, p.p 1-7, 2010.
[9] G Yunhua G ao and Jin Wand “Method of Reduction the Redundant Reader Based on RFID eader ommunication Protocol” in Advanced Science and Technology Letters, 79, p.p 124 – 128, 2014.
[10] rfan M Yagoub and K Hettak “Efficient algorithm for redundant reader elimination in wireless F networks” in International Journal of Computer Science Issues, 3(11), p.p 1-8, 2010.
[11] otero and H haouchi “ F network topology design based on genetic algorithm” n RFID Technologies and Applications (RFID-TA)