ISSN 0975-928X
Research Note
Identification of bread wheat lines with superior combining ability for
yield contributing traits and yellow rust resistance suitable for NWPZ of
India
Mohammed Talha*, Swati, Arvind Singh Negi and Harsha
Department of Genetics and Plant Breeding, Govind Ballabh Pant University of Agriculture and Technology, Pantnagar, Uttarakhand-263 145, India
E-mail: [email protected]
(Received: 11 Jan 2017; Revised: 14 March 2017; Accepted: 01 April 2017)
Abstract
Combining ability analysis and gene action were studied for yield contributing traits and yellow rust resistance, using AUDPC as a genetic basis of stripe rust resistance, among 15 parents (12 lines, 3 testers) along with their 36 F1s using Line x tester analysis. The purpose of the study was to identify and select superior high yielding rust resistant parents and best hybrid combinations on the basis of estimates of general and specific combining abilities. The significant differences among parents suggest that the breeding lines possess good amount of genetic variability for traits studied 11 traits showed predominance of non-additive gene action except for plant height, peduncle length, flag leaf area and AUDPC where additive gene actions were present. DPW 621-50 can be ranked as the best tester and UP2596, PBW 639 and PBW 658 can be considered as the best lines as these combine well for the highest number of yield contributing characters as well as yellow rust resistance. The cross WH1100 x PBW550 was found as good cross combination for maximum number of traits.
Key words
Wheat, combining ability, gene action, line x tester analysis, yellow rust, AUDPC
Wheat (Triticum aestivum L.), is the world’s most important food crop with the largest cropped area devoted to its cultivation and constitutes the staple food of about 36 per cent population. Marginal scope for horizontal expansion of arable land can be compensated by relentless increase in production and productivity. It can be achieved by developing superior genotypes with better yield potential per unit area imperative to tackle the existing challenge of synchronizing production increment with the population growth. The choice of parents based on combining ability analysis enable breeders to select genotypes having maximum potential of transmitting desirable genes to the progeny which in combination would provide desirable segregation or may be hybridized either to exploit heterosis or to accumulate fixable genes. In order to evolve an effective hybridization programme superior parents are identified using Line x Tester technique developed by Kempthorne (1957) which measures their performance in different cross combinations and the nature and magnitude of gene effects in expression of quantitative traits (Yadav and Sirohi, 2011). GCA estimates are very useful because it is attributable to fixable additive gene action and A x A interaction while SCA variance reflects non-additive gene action (Jain and Sastry, 2012). Stripe (yellow) rust caused by Puccinia striiformis f. sp.
tritici Eriksson is a major disease of wheat world-wide especially in moist and cool environments leading to 10 to 70 per cent (Chen, 2005) losses in regions like NWPZ (North West Plain Zone) of Indian subcontinent. Apart from targeting yield contributing traits, incorporation of stripe (yellow) rust resistance is essential breeding objective
keeping in view the emergence of new pathogen races and subsequent heavy losses. It is the most effective, efficient and environmentally safe method to tackle yield losses. AUDPC has been used in crop loss assessment (Ferrandino and Elmer, 1992) and field assessment of partial or quantitative resistance. Hence the investigation deals with estimation of relative magnitude of genetic variance for yield contributing traits and AUDPC as a measure for degree of yellow rust resistance to identify best combining parent and their desirable cross combination.
The experimental material comprised of 53 genotypes including 36 F1 crosses developed through 12 x 3 line- tester along with their 12 parents and three testers and 2 released wheat varieties (DBW 17, HD 2967) were also used as checks (Table 1). A line x tester set of 36 crosses, involving all 12 lines and all 3 testers, were evaluated during November 2012 to April 2013 in a completely Randomized Block Design with three replications consisting of 2 rows (one meter long) per entry with row spacing of 23 cm and 10 cm plant to plant distance maintained by proper thinning at the Norman E. Borlaug Crop Research Centre of G.B. Pant University of Agriculture and Technology, Pantnagar situated in the foot hills of Himalayas (Shivalik range) at an altitude of 243.84 m above mean sea level at 29.5° N latitude and 79.3° E longitude. The border rows were also planted to neutralize the border effect.
Observations were recorded for fifteen characters
ISSN 0975-928X
length, number of spikelets per spike, flag leaf area, days to maturity, biological yield, number of grains per spike, grain weight per spike, 1000 grain weight, grain yield per plant, harvest index and Area Under Disease Progress Curve (AUDPC). Cool and humid weather of the experimental site allows natural epiphytotic conditions for yellow rust infection. Border rows of highly susceptible Agra Local was planted as a spreader of yellow rust. AUDPC was calculated using rust severity (percentage of leaf area with symptom) determined by phenotypic observation on top 3 leaves of 5 randomly selected plants and recorded from 0 to 100 % of rust infection on selected plants from each genotype according to the modified Cobb scale (Peterson et al., 1948). Second, third and fourth reading of disease incidence on selected plants was recorded after seven days of the first reading. On the basis of severity data AUDPC was calculated using the formula:
AUDPC = Σ [(xi+ xi+1) / 2] (ti+1 – ti)
Where, xi = Rust intensity of the ith note, xi+1 = Rust intensity of the i+1th note, (ti +1−ti) = Number of days between the ith note and the i+1th note.
The character mean data recorded were subjected to the analysis of variance according to Panse and Sukhatme (1961) to determine significant differences among genotypes and combining ability analysis through line x tester mating design as described by Kempthorne (1957) and detailed by Singh and Chaudhary (1985).
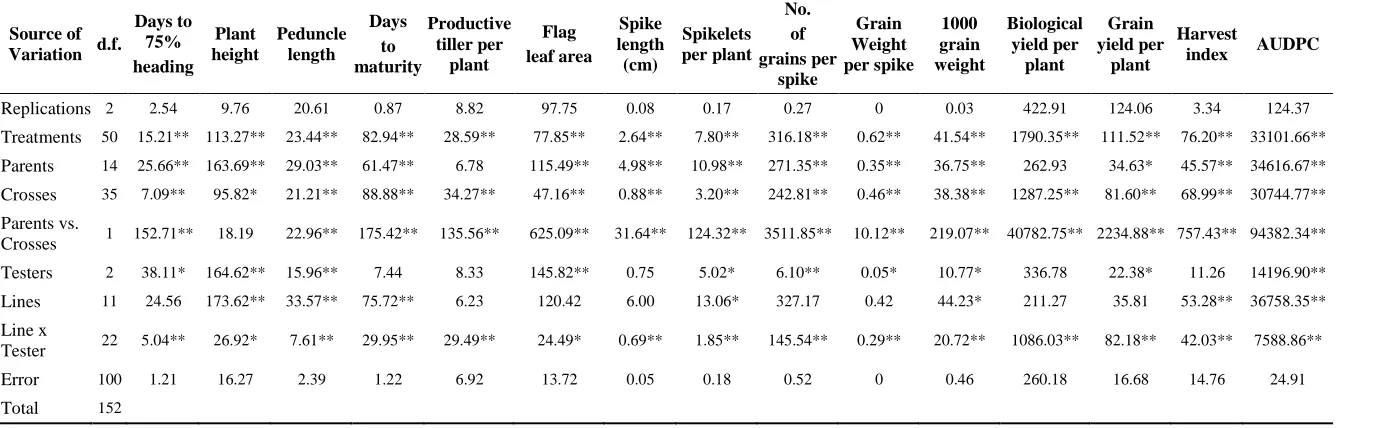
The analysis of variance for combining ability as shown in table 2 revealed presence of adequate genetic variability among the genotypes as highly significant differences among the genotypes for all the fifteen characters were observed.
Highest gca variance was observed for AUDPC (8461.76) followed by biological yield per plant (34.16) and number of grains per spike (21.31). Rest of the characters showed relatively smaller amount of σ2gca. Highest sca variance was observed for most of the characters. Maximum variance for sca was observed for the trait AUDPC (2526.39) followed by biological yield per plant (259) and number of grains per spike (48.42). The estimate of σ2gca/σ2
sca indicated predominance of non-additive gene effects for most of the characters. Similar effects were shown by the estimation of mean degree of dominance i.e. predominance for non-additive gene action. Results presented earlier by Majeed et al. (2011) and Srivastava et al. (2012) also indicated preponderance of non- additive gene effects in the expression of flag leaf length, spike length, number of tillers per plant, number of spikelets per spike, 1000 grain weight biological yield, grain yield per plant and harvest index.
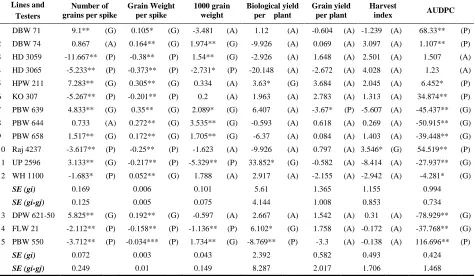
Among lines, Line PBW 639 was found to be a good general combiner for days to maturity, spike length, number of grains per spike, grain weight per spike 1000 grain weight and reduced AUDPC for yellow (stripe) rust. Similarly, line PBW 658 appeared as good general combiner for reduced plant height, spikelets per spike, grain weight per spike, number of grains per spike, 1000 grain weight and AUDPC. Parental line HPW 211 was identified as a good general combiner for days to maturity, spikelets per spike, number of grains per spike, grain weight per spike. Parental line Raj 4237 appeared as a good general combiner for dwarfness, short peduncle, days to maturity, productive tillers per plant and harvest index however it is a poor combiner for AUDPC. Line UP 2596 was found to be a good general combiner for maximum number of traits viz., increased peduncle length, productive tillers per plant, number of spikelets per spike, number of grains per spike, biological yield per plant and AUDPC. Line DBW 71 was identified as good general combiner for three traits viz., reduction in plant height, grain weight per spike and number of grains per spike. Line DBW 74 had a good gca effects for spike length, grain weight per spike and 1000 grain weight. Line WH 1100 emerged as good general combiner for number of spikelets per spike, grain weight per spike and reduced AUDPC
i.e. it can be used for incorporation of yellow rust (stripe) resistance. PBW644 was identified as good general combiner for grain weight per spike, 1000 grain weight and AUDPC. HD 3059, HD 3065 and PBW 550 were good general combiner for only two traits while KO307 was not good general combiner for any of the traits.
Among the testers, DPW 621-50 can be ranked as the best tester as it has a good general combining ability for maximum number of traits. It was found to combine well for short peduncle, spikelets per spike, number of grains per spike, weight of grains per spike and reduced AUDPC. It can be considered as the best general combiner for incorporation of yellow (stripe) rust resistance. Tester FLW 21 emerged as a good general combiner for the characters spike length, biological yield per plant and reduction in AUDPC. Likewise, among lines, PBW 639 and PBW 658 can be considered as the best lines as they combine well for the highest number of yield contributing characters as well as yellow (stripe) rust resistance. The findings showed that most of the parents having positive gca effects for yield, also had good
ISSN 0975-928X
GCA and SCA variance estimates as presented in table 5 revealed the importance of both additive and non-additive gene effects for different characters. The ratio of gca and sca variance estimates was greater than unity for the characters
viz. plant height, peduncle length, flag leaf area and AUDPC which indicated preponderance of additive gene action in the inheritance of these traits. For rest of the eleven traits non-additive gene action was observed. Therefore, early generation selection for these traits will be effective in breeding programmes (Barot et. al.,
2014).
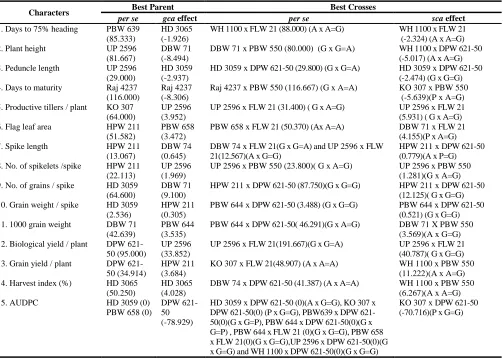
Among the tester, DPW 621-50 can be ranked as the best tester and among lines UP2596, PBW 639 and PBW 658 can be considered as the best lines as these combine well for the highest number of yield contributing characters as well as yellow rust resistance. The correspondence between per se
performance and gca effects was seen in only two lines Raj 4237 and HD 3065 which had highest per se performance and significantly high value of gca
in desirable direction for days to maturity and harvest index respectively as evident from Table 6. For remaining quantitative traits, best per se
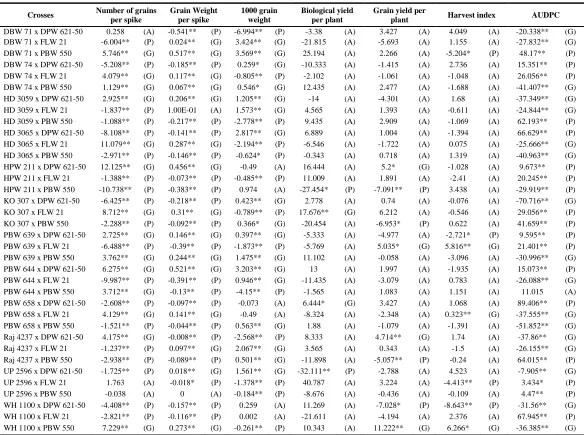
performance of the genotypes were not dependent on the presence of high gca effect of the respective trait.Eight crosses viz. HD 3059 x DPW 621-50, WH 1100 x FLW 21, UP 2596 x FLW 21, UP 2596 x PBW 550, HPW 211 x DPW 621-50, PBW 644 x DPW 621-50, UP 2596 x FLW 21 and KO 307 x DPW 621-50 had highest significant sca
effects in desirable direction as well as highest per se performance for peduncle length, days to 75% heading, productive tillers per plant, number of spikelets per spike, number of grains per spike, weight of grain per spike, biological yield per plant and AUDPC, respectively. The cross WH1100 x PBW550 was found as good cross combination for maximum number of traits (Table 6). It is advocated that the good combiner genotypes could be used in crossing programme and the crosses having significant sca effects should be tested over the location and years before their exploitation. The sca effects represent the non- additive gene action which is fixable. Normally the non-additive gene effects would not contribute tangibly in the improvement of grain yield in self-pollinated crops, except where the commercial exploitation of heterosis is feasible. In self-pollinated crops, however, the additive x additive type of interaction is also feasible in later generations and can be exploited for the improvement of grain yield and related traits.
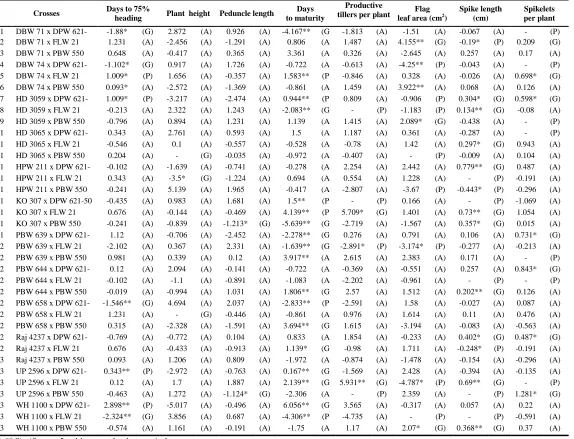
The estimates of specific combining ability effects (sca) of thirty six crosses are presented in Table 4. A close examination of crosses on the basis of best mean performance and sca effects revealed that there is a close agreement in the performance of
eight crosses viz., HD 3059 x DPW 621-50,WH 1100 x FLW 21,UP 2596 x FLW 21,UP 2596 x PBW 550, HPW 211 x DPW 621-50, PBW 644 x DPW 621-50,UP 2596 x FLW 21 and KO 307 x DPW 621-50 for the characters peduncle length, days to 75 % heading, productive tillers per plant, number of spikelets per spike, number of grains per spike, weight of grain per spike, biological yield per plant and harvest index, respectively (Table 6). Out of eight , in four crosses viz., HD 3059 x DPW 621-50, HPW 211 x DPW 621-50, PBW 644 x DPW 621-50 and UP 2596 x FLW 21 the parents also had positive gca effects in addition to correspondence between high per se performance and sca effects for the same character .The chances of getting good segregants from these crosses depend upon the additive genetic variance present in the good general combiner and additive x additive epistatic effect in the cross to maximize the fixation of desirable alleles in the later generation resulting in the desirable plant characteristics and development of desirable high yielding cultivars. However, for all the other characters studied, the crosses with highest sca
effects were not having highest high mean values. A close perusal of Table 6 revealed that for most of the characters the best cross on the basis of sca
effects had at least one parent having high gca for the trait. Thus transgressive segregants are expected in segregating generations.
Based on the combining ability effects the crosses were classified as good (G), average (A) and poor (P) combiners. Crosses with significant gca or sca
effects towards desirable direction were considered as good specific combiner (G) and those towards undesirable direction as poor specific combiner (P) while non-significant effects in positive direction were designated as average specific combiner (A) (Table 3 and 4). If crosses showing high sca
ISSN 0975-928X
(G x G=P) for AUDPC showed no significant sca
despite good gca of the parents. Such situations may arise due to lack of co-adaptation between positive favourable alleles of both the parents. Whereas, complementation between favourable alleles of parents will result in positive sca effect in P x P, A x P and A x A combiners (Barot et. al.,
2014). Therefore it is not necessary that parents with good gca values will always give superior cross combinations. Such patterns of sca in crosses represent independence of gca and sca effects involving the same parents. For such crosses biparental mating system can be used to enhance grain yield per plant (Yadav and Sirohi, 2011).
Considering the above results, it is concluded that there was predominant role of non-additive gene action in the inheritance of most of the traits except plant height, peduncle length, flag leaf area and AUDPC where additive gene actions seems to be involved in the inheritance. The most efficient way for utilizing the non-additive genetic variance is through the exploitation of heterosis. Since it was observed that sca was the predominant contributor to genetic variance, thus, it is suggested that selection of sca is likely to be the most effective method to exploit hybrid vigour. While in case of additive (fixable) components such as for traits like plant height, peduncle length, flag leaf area and AUDPC selection scheme would be useful to achieve homozygous lines. A high general combiner parent and inclusion of F1 hybrids showing high sca for seed yield and AUDPC may be included into multiple crosses, biparental mating, and diallel selective mating to produce desirable segregants which should be tested over the location and years before their exploitation for developing high-yielding, yellow rust resistant varieties in bread wheat.
Acknowledgement
Authors acknowledge with thanks the Director, Experiment Station, GBPUAT, Pantnagar for providing necessary facilities to carry out the present investigation. The first author is thankful to Dr. J. P. Jaiswal and Dr. Prashant Goel for providing assistance in research work.
References
Barot, H.G., Patel, M.S., Sheikh, W.A., Patel, L.P. and Allam, C.R. 2014. Heterosis and combining ability analysis for yield and its component traits in wheat [Triticum aestivum (L.)] Electron. J. Plant Breed., 5(3): 350-359.
Chen, X.M. 2005. Epidemiology and control of stripe rust [Puccinia striiformis f. sp. tritici] on wheat.
Can. J. Plant Pathol., 27: 314-337.
Ferrandino, F.J. and Elmer, W.H. 1992. Reduction in tomato yield due to Septoria leaf spot, Plant Dis.,
76(2): 208-211.
Jain, S.K. and Sastry, E.V.D. 2012. Heterosis and combining ability for grain yield and its
contributing traits in bread wheat (Triticum aestivum L.) Res. & Reviews, 1(1): 17-22. Kempthorne, Q. 1957. An introduction to genetic
statistics, John Willey & Sons. Inc. New York. pp. 468-471.
Majeed, S., Sajjad, M. and Khan, S. H. 2011. Exploitation of non-additive gene actions of yield traits for hybrid breeding in spring wheat,
J. Agric. Soc. Sci.,7(4): 131-135.
Panse and Sukhatme. 1961. Statistical methods for agricultural workers. New Delhi, ICAR, pp. 228-232.
Peterson, R.F., Campbell, А.В., and Hannah, A.E. 1948. A diagnostic scale for estimating rust intensity on leaves and stems of cereals. Can. J. Res. 26: 496–500.
Singh, A., Kumar, A., Ahmad, E., Swati and Jaiswal, J.P. 2012. Combining ability and gene action studies for seed yield, its components and quality traits in bread wheat (Triticum aestivum L. em Thell.) Electron. J. Plant Breed., 3(4): 964-972. Singh, S.P. and Choudhary, B.D. 1985. Biometrical
Methods in Quantitative Genetic analysis, Kalyani Publishers, New Delhi. 57 p.
Srivastava, M.K., Singh, D. and Sharma, S. 2012. Combining ability and gene action for seed yield and its components in bread wheat [(Triticum aestivum) (L.) em.Thell], Electron. J. Plant Breed., 3(1): 606-611.
Yadav, A.K. and Sirohi, A. 2011. Combining ability for grain yield and other related traits in bread wheat (Triticum aestivum L.). Electron. J. Plant Breed.,
ISSN 0975-928X
Table 1. List of wheat genotypes and their pedigree used in the study
S. No. Parent Name Pedigree S. No. Parent Name Pedigree
Line (Female Parents) Tester (Male Parents)
1. DBW 71 PRINIA/UP2425 13. DPW 621-50 KAUZ//ALTAR84/AOS/3/MILAN/KAUZ/4/HU ITES
2. DBW 74 RWP2008-26/WBLLL*2/BRAMBLING 14 FLW 21 UP2338/CENTURK//UP2338/YR15
3. HD 3059 KAUZ//ALTAR84/AOS/3/MILAN/KAUZ/4/HUITES 15. PBW 550 WH 594/RAJ 3858/W 485
4. HD 3065 PBW65/2*PASTOR
5. HPW 211 MO88/MILAN
6. KO 307 K 8321/UP 2003
7. PBW 639 HW2019/PBW49
8. PBW 644 PBW175/HD2643
9. PBW 658 CS/TH.SC//3*PVN/3/MIRLO/BUC/4/MILAN/5/TILHI
10. Raj 4237 PBW226/RAJ1972
11 UP 2596 CPAN 3004 M
12. WH 1100 PBW65/2*PASTOR
Table 2. Analysis of variance for combining ability for different traits
Source of Variation d.f.
Days to 75% heading
Plant height
Peduncle length
Days to maturity
Productive tiller per
plant
Flag leaf area
Spike length (cm)
Spikelets per plant
No. of grains per
spike
Grain Weight per spike
1000 grain weight
Biological yield per
plant
Grain yield per
plant
Harvest
index AUDPC
Replications 2 2.54 9.76 20.61 0.87 8.82 97.75 0.08 0.17 0.27 0 0.03 422.91 124.06 3.34 124.37 Treatments 50 15.21** 113.27** 23.44** 82.94** 28.59** 77.85** 2.64** 7.80** 316.18** 0.62** 41.54** 1790.35** 111.52** 76.20** 33101.66** Parents 14 25.66** 163.69** 29.03** 61.47** 6.78 115.49** 4.98** 10.98** 271.35** 0.35** 36.75** 262.93 34.63* 45.57** 34616.67** Crosses 35 7.09** 95.82* 21.21** 88.88** 34.27** 47.16** 0.88** 3.20** 242.81** 0.46** 38.38** 1287.25** 81.60** 68.99** 30744.77** Parents vs.
Crosses 1 152.71** 18.19 22.96** 175.42** 135.56** 625.09** 31.64** 124.32** 3511.85** 10.12** 219.07** 40782.75** 2234.88** 757.43** 94382.34** Testers 2 38.11* 164.62** 15.96** 7.44 8.33 145.82** 0.75 5.02* 6.10** 0.05* 10.77* 336.78 22.38* 11.26 14196.90** Lines 11 24.56 173.62** 33.57** 75.72** 6.23 120.42 6.00 13.06* 327.17 0.42 44.23* 211.27 35.81 53.28** 36758.35** Line x
Tester 22 5.04** 26.92* 7.61** 29.95** 29.49** 24.49* 0.69** 1.85** 145.54** 0.29** 20.72** 1086.03** 82.18** 42.03** 7588.86**
Error 100 1.21 16.27 2.39 1.22 6.92 13.72 0.05 0.18 0.52 0 0.46 260.18 16.68 14.76 24.91
Total 152
ISSN 0975-928X
Table 3. GCA effects of parents for different characters
Lines and Testers
Days to 75% heading
Plant height Peduncle length
Days to maturity
Productive tillers per plant
Flag leaf area
(cm2)
Spike length (cm)
Spikelets per plant
1 DBW 71 0.63 (A) -8.494** (G) -2.404 (A) 4.694** (P) 2.063 (A) -5.924** (P) 0.156 (A) -0.587** (P) 2 DBW 74 -1.148 (A) 1.861 (A) -0.804 (A) 2.25 (A) -2.404 (A) 1.041 (A) 0.645** (G) -0.343** (P) 3 HD 3059 0.407 (A) -0.939 (A) -2.937* (G) 3.917* (P) -2.226** (P) -0.131 (A) -0.348** (P) -0.831** (P) 4 HD 3065 -1.926* (G) 0.35 (A) 0.463 (A) -6.972** (G) -2.67** (P) 0.599 (A) -0.344** (P) -0.654* (P) 5 HPW 211 -0.148 (A) 2.75 (A) 1.663 (A) -2.194* (G) -0.537 (A) -1.564 (A) 0.156 (A) 0.213* (G) 6 KO 307 0.519 (A) 2.994 (A) -0.159 (A) 3.694** (P) 0.707 (A) 1.376 (A) -0.477** (P) -0.098 (A) 7 PBW 639 -0.704 (A) -3.05 (A) 0.041 (A) -6.194** (G) 0.241 (A) -2.786 (A) 0.296** (G) -0.431 (A) 8 PBW 644 0.63** (P) 3.883** (P) 0.73 (A) 6.917** (P) -2.581** (P) 0.595 (A) -0.088 (A) -0.143 (A) 9 PBW 658 1.296 (A) -2.583* (G) -0.515 (A) -0.972 (A) -0.759 (A) 3.473 (A) 0.229 (A) 0.746** (G) 10 Raj 4237 0.852 (A) -3.517** (G) -1.648** (G) -8.306** (G) 2.396** (G) 1.936 (A) -0.366* (P) -0.12 (A) 11 UP 2596 0.741 (A) 10.483** (P) 5.619** (P) 1.694 (A) 3.952** (G) 0.334 (A) -0.071 (A) 1.969** (G) 12 WH 1100 -1.148 (A) -3.739 (A) -0.048 (A) 1.472 (A) 1.819 (A) 1.053 (A) 0.212 (A) 0.28** (G)
SE (gi) 0.349 1.347 0.522 0.339 0.903 1.191 0.067 0.128
SE (gi-gj) 0.258 0.995 0.386 0.251 0.667 0.879 0.05 0.095
13 DPW 621-50 0.769 (A) 0.594 (A) -1.326** (G) -0.167 (A) 0.391 (A) -3.068** (P) -0.246* (P) 0.446** (G) 14 FLW 21 -0.676 (A) 2.056 (A) 0.824 (A) 0.528 (A) 0.624 (A) 1.888 (A) 0.237* (G) -0.009 (A) 15 PBW 550 -0.093 (A) -2.65* (G) 0.502 (A) -0.361 (A) -1.015 (A) 1.181 (A) 0.009 (A) -0.437 (A)
SE (gi) 0.149 0.574 0.223 0.145 0.385 0.508 0.029 0.055
SE (gi-gj) 0.516 1.99 0.771 0.501 1.333 1.759 0.1 0.189
Lines and Testers
Number of grains per spike
Grain Weight per spike
1000 grain weight
Biological yield per plant
Grain yield per plant
Harvest
index AUDPC
1 DBW 71 9.1** (G) 0.105* (G) -3.481 (A) 1.12 (A) -0.604 (A) -1.239 (A) 68.33** (P) 2 DBW 74 0.867 (A) 0.164** (G) 1.974** (G) -9.926 (A) 0.069 (A) 3.097 (A) 1.107** (P) 3 HD 3059 -11.667** (P) -0.38** (P) 1.54** (G) -2.926 (A) 1.648 (A) 2.501 (A) 1.507 (A) 4 HD 3065 -5.233** (P) -0.373** (P) -2.731* (P) -20.148 (A) -2.672 (A) 4.028 (A) 1.23 (A) 5 HPW 211 7.283** (G) 0.305** (G) 0.334 (A) 3.63* (G) 3.684 (A) 2.045 (A) 6.452* (P) 6 KO 307 -5.267** (P) -0.201** (P) 0.2 (A) 1.963 (A) 2.783 (A) 1.313 (A) 34.874** (P) 7 PBW 639 4.833** (G) 0.35** (G) 2.089* (G) 6.407 (A) -3.67* (P) -5.607 (A) -45.437** (G) 8 PBW 644 0.733 (A) 0.272** (G) 3.535** (G) -0.593 (A) 0.618 (A) 0.269 (A) -50.915** (G) 9 PBW 658 1.517** (G) 0.172** (G) 1.705** (G) -6.37 (A) 0.084 (A) 1.403 (A) -39.448** (G) 10 Raj 4237 -3.617** (P) -0.25** (P) -1.623 (A) -9.926 (A) 0.797 (A) 3.546* (G) 54.519** (P) 11 UP 2596 3.133** (G) -0.217** (P) -5.329** (P) 33.852* (G) -0.582 (A) -8.414 (A) -27.937** (G) 12 WH 1100 -1.683* (P) 0.052** (G) 1.788 (A) 2.917 (A) -2.155 (A) -2.942 (A) -4.281* (G)
SE (gi) 0.169 0.006 0.101 5.61 1.365 1.155 0.994
SE (gi-gj) 0.125 0.005 0.075 4.144 1.008 0.853 0.734
13 DPW 621-50 5.825** (G) 0.192** (G) -0.597 (A) 2.667 (A) 1.542 (A) 0.31 (A) -78.929** (G) 14 FLW 21 -2.112** (P) -0.158** (P) -1.136** (P) 6.102* (G) 1.758 (A) -0.172 (A) -37.768** (G) 15 PBW 550 -3.712** (P) -0.034*** (P) 1.734** (G) -8.769** (P) -3.3 (A) -0.138 (A) 116.696** (P)
SE (gi) 0.072 0.003 0.043 2.392 0.582 0.493 0.424
SE (gi-gj) 0.249 0.01 0.149 8.287 2.017 1.706 1.468
ISSN 0975-928X
Table 4. SCA effects of crosses for different characters
Crosses Days to 75%
heading Plant height Peduncle length
Days to maturity
Productive
tillers per plant leaf area (cmFlag 2)
Spike length (cm)
Spikelets per plant
1 DBW 71 x DPW 621-50
-1.88* (G) 2.872 (A) 0.926 (A) -4.167** (G )
-1.813 (A) -1.51 (A) -0.067 (A) -0.38**
(P) 2 DBW 71 x FLW 21 1.231 (A) -2.456 (A) -1.291 (A) 0.806 (A
)
1.487 (A) 4.155** (G) -0.19* (P) 0.209 (G) 3 DBW 71 x PBW 550 0.648 (A) -0.417 (A) 0.365 (A) 3.361 (A
)
0.326 (A) -2.645 (A) 0.257 (A) 0.17 (A) 4 DBW 74 x DPW
621-50
-1.102* (G) 0.917 (A) 1.726 (A) -0.722 (A )
-0.613 (A) -4.25** (P) -0.043 (A) -0.824*
* (P) 5 DBW 74 x FLW 21 1.009* (P) 1.656 (A) -0.357 (A) 1.583** (P
)
-0.846 (A) 0.328 (A) -0.026 (A) 0.698* *
(G) 6 DBW 74 x PBW 550 0.093* (A) -2.572 (A) -1.369 (A) -0.861 (A
)
1.459 (A) 3.922** (A) 0.068 (A) 0.126 (A) 7 HD 3059 x DPW
621-50
1.009* (P) -3.217 (A) -2.474 (A) 0.944** (P )
0.809 (A) -0.906 (P) 0.304* (G) 0.598* *
(G) 8 HD 3059 x FLW 21 -0.213 (A) 2.322 (A) 1.243 (A) -2.083** (G
) -2.224**
(P) -1.183 (P) 0.134** (G) -0.08 (A) 9 HD 3059 x PBW 550 -0.796 (A) 0.894 (A) 1.231 (A) 1.139 (A
)
1.415 (A) 2.089* (G) -0.438 (A) -0.519*
* (P) 1
0
HD 3065 x DPW 621-50
0.343 (A) 2.761 (A) 0.593 (A) 1.5 (A )
1.187 (A) 0.361 (A) -0.287 (A) -1.046*
* (P) 1
1
HD 3065 x FLW 21 -0.546 (A) 0.1 (A) -0.557 (A) -0.528 (A )
-0.78 (A) 1.42 (A) 0.297* (G) 0.943 (A) 1
2
HD 3065 x PBW 550 0.204 (A) -2.861**
(G) -0.035 (A) -0.972 (A )
-0.407 (A) -1.782**
(P) -0.009 (A) 0.104 (A) 1
3
HPW 211 x DPW 621-50
-0.102 (A) -1.639 (A) -0.741 (A) -0.278 (A )
2.254 (A) 2.442 (A) 0.779** (G) 0.487 (A) 1
4
HPW 211 x FLW 21 0.343 (A) -3.5* (G) -1.224 (A) 0.694 (A )
0.554 (A) 1.228 (A) -0.337**
(P) -0.191 (A) 1
5
HPW 211 x PBW 550 -0.241 (A) 5.139 (A) 1.965 (A) -0.417 (A )
-2.807 (A) -3.67 (P) -0.443* (P) -0.296 (A) 1
6
KO 307 x DPW 621-50 -0.435 (A) 0.983 (A) 1.681 (A) 1.5** (P )
-2.991**
(P) 0.166 (A) -1.087**
(P) -1.069 (A) 1
7
KO 307 x FLW 21 0.676 (A) -0.144 (A) -0.469 (A) 4.139** (P )
5.709* (G) 1.401 (A) 0.73** (G) 1.054 (A) 1
8
KO 307 x PBW 550 -0.241 (A) -0.839 (A) -1.213* (G) -5.639** (G )
-2.719 (A) -1.567 (A) 0.357* (G) 0.015 (A) 1
9
PBW 639 x DPW 621-50
1.12 (A) -0.706 (A) -2.452 (A) -2.278** (G )
0.276 (A) 0.791 (A) 0.106 (A) 0.731* *
(G) 2
0
PBW 639 x FLW 21 -2.102 (A) 0.367 (A) 2.331 (A) -1.639** (G )
-2.891* (P) -3.174* (P) -0.277 (A) -0.213 (A) 2
1
PBW 639 x PBW 550 0.981 (A) 0.339 (A) 0.12 (A) 3.917** (A )
2.615 (A) 2.383 (A) 0.171 (A) -0.519*
* (P) 2
2
PBW 644 x DPW 621-50
0.12 (A) 2.094 (A) -0.141 (A) -0.722 (A )
-0.369 (A) -0.551 (A) 0.257 (A) 0.843* *
(G) 2
3
PBW 644 x FLW 21 -0.102 (A) -1.1 (A) -0.891 (A) -1.083 (A )
-2.202 (A) -0.961 (A) -0.459**
(P) -0.969*
(P) 2
4
PBW 644 x PBW 550 -0.019 (A) -0.994 (A) 1.031 (A) 1.806** (G )
2.57 (A) 1.512 (A) 0.202** (G) 0.126 (A) 2
5
PBW 658 x DPW 621-50
-1.546** (G) 4.694 (A) 2.037 (A) -2.833** (P )
-2.591 (A) 1.58 (A) -0.027 (A) 0.087 (A) 2
6
PBW 658 x FLW 21 1.231 (A) -2.367**
(G) -0.446 (A) -0.861 (A )
0.976 (A) 1.614 (A) 0.11 (A) 0.476 (A) 2
7
PBW 658 x PBW 550 0.315 (A) -2.328 (A) -1.591 (A) 3.694** (G )
1.615 (A) -3.194 (A) -0.083 (A) -0.563 (A) 2
8
Raj 4237 x DPW 621-50
-0.769 (A) -0.772 (A) 0.104 (A) 0.833 (A )
1.854 (A) -0.233 (A) 0.402* (G) 0.487* *
(G) 2
9
Raj 4237 x FLW 21 0.676 (A) -0.433 (A) -0.913 (A) 1.139* (G )
-0.98 (A) 1.711 (A) -0.248* (P) -0.191 (A) 3
0
Raj 4237 x PBW 550 0.093 (A) 1.206 (A) 0.809 (A) -1.972 (A )
-0.874 (A) -1.478 (A) -0.154 (A) -0.296 (A) 3
1
UP 2596 x DPW 621-50
0.343** (P) -2.972 (A) -0.763 (A) 0.167** (G )
-1.569 (A) 2.428 (A) -0.394 (A) -0.135 (A) 3
2
UP 2596 x FLW 21 0.12 (A) 1.7 (A) 1.887 (A) 2.139** (G )
5.931** (G) -4.787* (P) 0.69** (G) -1.146*
* (P) 3
3
UP 2596 x PBW 550 -0.463 (A) 1.272 (A) -1.124* (G) -2.306 (A )
-4.363**
(P) 2.359 (A) -0.296**
(P) 1.281* *
(G) 3
4
WH 1100 x DPW 621-50
2.898** (P) -5.017 (A) -0.496 (A) 6.056** (G )
3.565 (A) -0.317 (A) 0.057 (A) 0.22 (A) 3
5
WH 1100 x FLW 21 -2.324** (G) 3.856 (A) 0.687 (A) -4.306** (P )
-4.735 (A) -1.752**
(P)
-0.426**
(P) -0.591 (A) 3
6
WH 1100 x PBW 550 -0.574 (A) 1.161 (A) -0.191 (A) -1.75 (A )
ISSN 0975-928X
Table 4. Contd.,
Crosses Number of grains per spike
Grain Weight per spike
1000 grain weight
Biological yield per plant
Grain yield per
plant Harvest index AUDPC 1 DBW 71 x DPW 621-50 0.258 (A) -0.541** (P) -6.994** (P) -3.38 (A) 3.427 (A) 4.049 (A) -20.338** (G) 2 DBW 71 x FLW 21 -6.004** (P) 0.024** (G) 3.424** (G) -21.815 (A) -5.693 (A) 1.155 (A) -27.832** (G) 3 DBW 71 x PBW 550 5.746** (G) 0.517** (G) 3.569** (G) 25.194 (A) 2.266 (A) -5.204* (P) 48.17** (P) 4 DBW 74 x DPW 621-50 -5.208** (P) -0.185** (P) 0.259* (G) -10.333 (A) -1.415 (A) 2.736 (A) 15.351** (P) 5 DBW 74 x FLW 21 4.079** (G) 0.117** (G) -0.805** (P) -2.102 (A) -1.061 (A) -1.048 (A) 26.056** (P) 6 DBW 74 x PBW 550 1.129** (G) 0.067** (G) 0.546* (G) 12.435 (A) 2.477 (A) -1.688 (A) -41.407** (G) 7 HD 3059 x DPW 621-50 2.925** (G) 0.206** (G) 1.205** (G) -14 (A) -4.301 (A) 1.68 (A) -37.349** (G) 8 HD 3059 x FLW 21 -1.837** (P) 1.00E-01 (A) 1.573** (G) 4.565 (A) 1.393 (A) -0.611 (A) -24.844** (G) 9 HD 3059 x PBW 550 -1.088** (P) -0.217** (P) -2.778** (P) 9.435 (A) 2.909 (A) -1.069 (A) 62.193** (P) 10 HD 3065 x DPW 621-50 -8.108** (P) -0.141** (P) 2.817** (G) 6.889 (A) 1.004 (A) -1.394 (A) 66.629** (P) 11 HD 3065 x FLW 21 11.079** (G) 0.287** (G) -2.194** (P) -6.546 (A) -1.722 (A) 0.075 (A) -25.666** (G) 12 HD 3065 x PBW 550 -2.971** (P) -0.146** (P) -0.624* (P) -0.343 (A) 0.718 (A) 1.319 (A) -40.963** (G) 13 HPW 211 x DPW 621-50 12.125** (G) 0.456** (G) -0.49 (A) 16.444 (A) 5.2* (G) -1.028 (A) 9.673** (P) 14 HPW 211 x FLW 21 -1.388** (P) -0.073** (P) -0.485** (P) 11.009 (A) 1.891 (A) -2.41 (A) 20.245** (P) 15 HPW 211 x PBW 550 -10.738** (P) -0.383** (P) 0.974 (A) -27.454* (P) -7.091** (P) 3.438 (A) -29.919** (P) 16 KO 307 x DPW 621-50 -6.425** (P) -0.218** (P) 0.423** (G) 2.778 (A) 0.74 (A) -0.076 (A) -70.716** (G) 17 KO 307 x FLW 21 8.712** (G) 0.31** (G) -0.789** (P) 17.676** (G) 6.212 (A) -0.546 (A) 29.056** (P) 18 KO 307 x PBW 550 -2.288** (P) -0.092** (P) 0.366* (G) -20.454 (A) -6.953* (P) 0.622 (A) 41.659** (P) 19 PBW 639 x DPW 621-50 2.725** (G) 0.146** (G) 0.397** (G) -5.333 (A) -4.977 (A) -2.721* (P) 9.595** (P) 20 PBW 639 x FLW 21 -6.488** (P) -0.39** (P) -1.873** (P) -5.769 (A) 5.035* (G) 5.816** (G) 21.401** (P) 21 PBW 639 x PBW 550 3.762** (G) 0.244** (G) 1.475** (G) 11.102 (A) -0.058 (A) -3.096 (A) -30.996** (G) 22 PBW 644 x DPW 621-50 6.275** (G) 0.521** (G) 3.203** (G) 13 (A) 1.997 (A) -1.935 (A) 15.073** (P) 23 PBW 644 x FLW 21 -9.987** (P) -0.391** (P) 0.946** (G) -11.435 (A) -3.079 (A) 0.783 (A) -26.088** (G) 24 PBW 644 x PBW 550 3.712** (G) -0.13** (P) -4.15** (P) -1.565 (A) 1.083 (A) 1.151 (A) 11.015 (A) 25 PBW 658 x DPW 621-50 -2.608** (P) -0.097** (P) -0.073 (A) 6.444* (G) 3.427 (A) 1.068 (A) 89.406** (P) 26 PBW 658 x FLW 21 4.129** (G) 0.141** (G) -0.49 (A) -8.324 (A) -2.348 (A) 0.323** (G) -37.555** (G) 27 PBW 658 x PBW 550 -1.521** (P) -0.044** (P) 0.563** (G) 1.88 (A) -1.079 (A) -1.391 (A) -51.852** (G) 28 Raj 4237 x DPW 621-50 4.175** (G) -0.008** (P) -2.568** (P) 8.333 (A) 4.714** (G) 1.74 (A) -37.86** (G) 29 Raj 4237 x FLW 21 -1.237** (P) 0.097** (G) 2.067** (G) 3.565 (A) 0.343 (A) -1.5 (A) -26.155** (G) 30 Raj 4237 x PBW 550 -2.938** (P) -0.089** (P) 0.501** (G) -11.898 (A) -5.057** (P) -0.24 (A) 64.015** (P) 31 UP 2596 x DPW 621-50 -1.725** (P) 0.018** (G) 1.561** (G) -32.111** (P) -2.788 (A) 4.523 (A) -7.905** (G) 32 UP 2596 x FLW 21 1.763 (A) -0.018* (P) -1.378** (P) 40.787 (A) 3.224 (A) -4.413** (P) 3.434* (P) 33 UP 2596 x PBW 550 -0.038 (A) 0 (A) -0.184** (P) -8.676 (A) -0.436 (A) -0.109 (A) 4.47** (P) 34 WH 1100 x DPW 621-50 -4.408** (P) -0.157** (P) 0.259 (A) 11.269 (A) -7.028* (P) -8.643** (P) -31.56** (G) 35 WH 1100 x FLW 21 -2.821** (P) -0.116** (P) 0.002 (A) -21.611 (A) -4.194 (A) 2.376 (A) 67.945** (P) 36 WH 1100 x PBW 550 7.229** (G) 0.273** (G) -0.261** (P) 10.343 (A) 11.222** (G) 6.266* (G) -36.385** (G)
ISSN 0975-928X
Table 5. General and specific combining ability variances
Characters σ2gca σ2sca σ2gca/ σ2sca √σ2sca/σ2gca
1. Days to 75%heading 0.40 1.28 0.31 1.79
2. Plant height (cm) 8.18 3.04 2.69 0.61
3. Peduncle length (cm) 1.70 1.64 1.04 0.98
4. Days to maturity 3.77 9.61 0.39 1.60
5. Productive tillers per plant 0.32 7.16 0.04 4.76
6. Flag leaf area (cm2) 5.86 3.52 1.66 0.78
7. Spike length (cm) 0.04 0.22 0.18 2.35
8. Spikelets per spike 0.19 0.56 0.34 1.72
9. Number of grains per spike 21.31 48.42 0.44 1.51
10. Grain weight per spike 0.03 0.10 0.26 1.95
11. 1000 grain weight 2.40 6.87 0.35 1.69
12. Biological yield per plant 34.16 259.00 0.13 2.75
13. Grain yield per plant 3.82 21.29 0.18 2.36
14. Harvest index 1.19 9.64 0.12 2.85
15. AUDPC 8461.76 2526.39 3.35 0.55
Table 6. Correspondence of per se performance with gca and sca effects of best crosses in F1 generation
Characters Best Parent Best Crosses
per se gca effect per se sca effect
1. Days to 75% heading PBW 639 (85.333)
HD 3065 (-1.926)
WH 1100 x FLW 21 (88.000) (A x A=G) WH 1100 x FLW 21 (-2.324) (A x A=G) 2. Plant height UP 2596
(81.667)
DBW 71 (-8.494)
DBW 71 x PBW 550 (80.000) (G x G=A) WH 1100 x DPW 621-50 (-5.017) (A x A=G) 3. Peduncle length UP 2596
(29.000)
HD 3059 (-2.937)
HD 3059 x DPW 621-50 (29.800) (G x G=A) HD 3059 x DPW 621-50 (-2.474) (G x G=G) 4. Days to maturity Raj 4237
(116.000)
Raj 4237 (-8.306)
Raj 4237 x PBW 550 (116.667) (G x A=A) KO 307 x PBW 550 (-5.639)(P x A=G) 5. Productive tillers / plant KO 307
(64.000)
UP 2596 (3.952)
UP 2596 x FLW 21 (31.400) ( G x A=G) UP 2596 x FLW 21 (5.931) ( G x A=G) 6. Flag leaf area HPW 211
(51.582)
PBW 658 (3.472)
PBW 658 x FLW 21 (50.370) (Ax A=A) DBW 71 x FLW 21 (4.155)(P x A=G)
7. Spike length HPW 211
(13.067)
DBW 74 (0.645)
DBW 74 x FLW 21(G x G=A) and UP 2596 x FLW 21(12.567)(A x G=G)
HPW 211 x DPW 621-50 (0.779)(A x P=G) 8. No. of spikelets /spike HPW 211
(22.113)
UP 2596 (1.969)
UP 2596 x PBW 550 (23.800)( G x A=G) UP 2596 x PBW 550 (1.281)(G x A=G) 9. No. of grains / spike HD 3059
(64.600)
DBW 71 (9.100)
HPW 211 x DPW 621-50 (87.750)(G x G=G) HPW 211 x DPW 621-50 (12.125)( G x G=G) 10. Grain weight / spike HD 3059
(2.536)
HPW 211 (0.305)
PBW 644 x DPW 621-50 (3.488) (G x G=G) PBW 644 x DPW 621-50 (0.521) (G x G=G) 11. 1000 grain weight DBW 71
(42.639)
PBW 644 (3.535)
PBW 644 x DPW 621-50( 46.291)(G x A=G) DBW 71 X PBW 550 (3.569)(A x G=G) 12. Biological yield / plant DPW
621-50 (95.000)
UP 2596 (33.852)
UP 2596 x FLW 21(191.667)(G x G=A) UP 2596 x FLW 21 (40.787)( G x G=G) 13. Grain yield / plant DPW
621-50 (34.914)
HPW 211 (3.684)
KO 307 x FLW 21(48.907) (A x A=A) WH 1100 x PBW 550 (11.222)(A x A=G) 14. Harvest index (%) HD 3065
(50.250)
HD 3065 (4.028)
DBW 74 x DPW 621-50 (41.387) (A x A=A) WH 1100 x PBW 550 (6.267)(A x A=G)
15. AUDPC HD 3059 (0)
PBW 658 (0)
DPW 621-50 (-78.929)
HD 3059 x DPW 621-50 (0)(A x G=G), KO 307 x DPW 50(0) (P x G=G), PBW639 x DPW 621-50(0)(G x G=P), PBW 644 x DPW 621-621-50(0)(G x G=P) , PBW 644 x FLW 21 (0)(G x G=G), PBW 658 x FLW 21(0)(G x G=G),UP 2596 x DPW 621-50(0)(G x G=G) and WH 1100 x DPW 621-50(0)(G x G=G)
KO 307 x DPW 621-50 (-70.716)(P x G=G)
*G = Good parents having significant gca effects in desired direction,