Vol.9 (2019) No. 1
ISSN: 2088-5334
Competency Discovery System: Integrating the Enhanced ID3
Decision Tree Algorithm to Predict the Assessment Competency
of Senior High School Students
Jestoni G. Vasquez
#1, Benilda Eleonor V. Comendador
#2 #Department of Information Technology, Polytechnic University of the Philippines, A. Mabini Campus, Anonas St., Sta. Mesa Manila, 1016, Philippines
E-mail: [email protected]; [email protected]
Abstract— The study presents the development of Competency Discovery System, which integrates enhanced Iterative Dichometer 3
(ID3) decision tree algorithm, to predict assessment competency of senior high school students. It was also successful in integrating the feature selection to select the data attributes that have impact on the performance of students. Pre-processing of data collected from school database and available spreadsheets was performed to determine the attributes that may possibly influenced the students’ competency assessment. It provides a decision tool for teachers to enhance students’ performance, particularly in the academic and technical aspect, based on factors that might affect their learning process. The academic and technical performance is often used for predicting the learning behaviour of the students and can be a crucial factor in building their better future. Moreover, the system identifies students that were likely to fail, and that may need assistance in view of the National Certificate programming-related assessment. The National Certificate assessment aim to regulate the students can perform to the standards expected in the workplace based on the defined competency standards. Passing the competency assessment shows that the students is ready to join the labour workforce. Predicting the future outcomes based on the historical records can help the teacher guide the students’ assessment performance. This is also beneficial to students as they have the opportunity to prepare for taking the assessment. Majority of the participants assessed the software as 'highly acceptable’ with support on its implied functions in terms of reliability, efficiency, usability, security, and user-friendliness.
Keywords— competency discovery system; decision tree; ID3 algorithm; enhanced ID3 algorithm; national certification assessment.
I. INTRODUCTION
Over the last years, the Internet has evolved at an exceptional speed. With its versatile facility, it is beneficial in completing many tasks quickly and conveniently. The manual process is turned to automate with various services related to various fields. The massive popularity of the Internet has been widely accepted by many organizations such as schools to support their teaching and learning process to students.
Today, educational learnings require data, which are collected, stored, and retrieved from available educational databases. The number of data that are needed and kept in the database is swiftly accumulating. The critical challenge posed in the higher education system is to significantly enhance the quality learnings and decision-making by using the student’s data collection [1]. These data can be converted into more valuable information, predict outcomes, and help to make better decision-making. Of all the widely used method, data mining had been proven to be useful in getting
significant information from databases. As per definition, Data Mining draws out necessary information from collected databases leading to the discovery of current and practical ideas from simple to complex proportions of data. This information is utilized to scrutinize questions and evidence for theories development [2]. One of the primary objectives of data mining is to process large databases to generate new and valuable information. It covers various fields of learning that can be used in information technology, machine learning, data analysis, data recovery, pattern recognition, neural networks, information system, data visualization, and artificial intelligence [3]. Data in various formats like text, electronic document, and spreadsheets, images, videos, animated scripts that are stored to databases can be helpful to predict future outcomes. These data can also convert to more useful information that may lead to better decision making.
educational information by using data mining tools and techniques to educational-related data [5]. This field of data mining can help the educational institutions to improve the teaching methods and learning process that may lead to enhancing the performance of students in the class.
There are two (2) classifications of data mining technique-predictive and descriptive data mining. Descriptive data mining is a framework that points out the patterns or relationships in a data set. It identifies the pattern by exploring the properties of data, which was previously examined, and not to predict new properties. In contrast, predictive data mining uses historical data found from databases and known sources to predict outcomes [6] [7]. Predictive data mining is a model that covers the classification of data, prediction of possible output, forecasting, and time series analysis.
Among predictive data mining techniques, the classification model is considered as the best-understood technique of all data mining approaches. A technique utilizes a set of pre-classified examples to build a model that could classify the large volumes of records [8]. The classification model is one of the learning methods that structure a model to categorize a data item into a pre-ordained class label. It is aimed to project future results based on previously used data [9]. Most classification algorithms used for output prediction are Decision Tree, Naïve Bayes, Support Vector Machine, K-Nearest Neighbors, and the Rule Learners Classification Algorithm. Classification methods such as decision trees, rule mining, and machine learning can be utilized to guide a student’s future academic performance by applying educational data in behavior prediction. The prediction can guide teachers to enhance their students falling short in academic and technical performance [10].
The decision Tree model is ideal for resolving classification and prediction problems. As described by [11], this model is a simple and recursive assembly for expressing a sequential classification procedure described by a huge array of attributes assigned on one of the disjoint set of classes. A decision tree can be illustrated similar to a tree composed of branches (nodes) and leaves. The Nodes functions by analyzing an attribute reflected in the leaf denoting a class.
Iterative Dichometer 3 (ID3) algorithm is a well-established and used classification. Ross Quinlan invented this algorithm to generate decision tree models. It starts by building a tree to organize the classification process. The ID3 algorithm creates a decision tree by using pre-arranged data samples. The subsequent tree is used to capture the dependency of different attributes. [12]. Its computation can be performed in five (5) steps, namely: 1) compute the classification entropy; 2) compute the information gain of all attributes using classification; 3) choose the attribute with the top information gain; 4) discard node attribute for future computation; and 5) repeat the steps from 2 to 4 until all attributes have been utilized.
Such a prediction model was very useful to analyze the relationship among variables that predict future outcomes such as student’s school performance [13]. Although the ID3 algorithm is known for generating decision trees, it has one major shortcoming. It is inclined toward the attributes with multiple values [14]. The main drawbacks of this algorithm
are its nature in selecting attributes of more values. The more inclined attributes, the more it could lead to an incorrect classification on many circumstances. While a good decision tree model is justly required without lengthy computation, it was conceptualized for cases where many attributes and training sets have multiple objects. Although it has been realized to generate decision trees, the system it utilizes does not have an assurance that better trees, which have not been, overlooked [15]. The increase in the value of the attribute will proportionally increase the inclination [16]. Decision tree algorithm including ID3 faces challenges such as 1) selection of splitting attributes; 2) arrangement of splitting attributes; 3) some splits to take; 4) tree structure and pruning stability, and 5) criteria to stop [17]. On the selection of splitting attributes, theories on Entropy, Information Gain, and Gain Ratio were used [18].
The selection attribute criterion of the ID3 algorithm enhanced by placing the attribute importance q (0 < q < 1). Its capacity is primarily determined on the knowledge, experience, or actual condition in the application field. It is an undefined concept that refers to bodies of knowledge on the transaction, i.e., domain knowledge, expert advice, or actual situation. To generate a decision tree, a set of rules and selection factors were applied. This can affect the decision tree generation process, and it is a changing value using the below formula.
0
≤
ρ
=
ρ
(
A
)
≤
min(
p
1
,
p
2
,
pv
)
(1) Where: is the attribute importance and p1 is the probability of attribute A from class C1. Evidently 0 ≤ 1 ≤ q.The formula used for entropy is as follows:
=−
=
c ipi
pi
S
Entorpy
12
log
)
(
(2)Where S is a set comprised of s data samples, Pi is the part of S belonging to class i. Observe that the entropy is zero (0) when members of S are in the same group and that entropy is one (1) when a collection contains an equal number of positive and negative samples. If the collection contains unequal numbers of positive and negative samples, the entropy is between zero (0) and one (1). While information gain can be computed using the following formula,
)
(
|
|
|
|
)
(
)
,
(
) ( v v A Values vS
Entropy
S
S
S
Entropy
A
S
Gain
∈−
=
(3)Where, Values (A) is the group of all possible values for attribute A, and Sv is the subgroup of S for which attribute A has value, v.
The formula for the ID3 algorithm improved according to the attribute importance as shown below.
) ... 2 1 ( )) ( ) ... 2 1 (( ) (
1 S A I Si S i Sni
Sni i S i S A AIE N
i + + + +
+ + +
=
= ρ (4))
(
)
...
2
1
(
)
(
AIE
I
S
i
S
i
Sni
AIE
A
Gain
=
+
+
+
−
(5)Enhanced ID3 algorithm formula applied in this study was introduced by [19]. To select a splitting node, the attribute with the top value of information gain can be used to construct the tree in a top-down fashion. This algorithm can be effective in generating more outcomes that are useful by diluting the attributes with many values. It is projected to make a concise decision tree model in a short period, and to select a reasonable attribute in every internal node [20].
Hence, in this paper, the authors have applied data mining technique through enhanced ID3 decision tree algorithm for data classification, which will be deployed to mine students’ academic performance and to predict their competency on the National Certification Assessment of Senior High School (SHS) Technical Vocational Education and Training – Information Communication Technology (TVET-ICT).
II. MATERIAL AND METHOD
The authors used the descriptive method in the study to describe the nature of the situation, as it occurs at the time of the study. The primary objective of such research is to provide an understanding on the set of variables in a group, but stops short of understanding the connection among variables [21]. It represents an attempt to provide a precise explanation or representation of a situation or phenomenon. It includes the classification fact based on empirical evidence based on observational source, or relationships among two or more actions [22].
The authors used the developmental method to determine the functionality, consistency, and effectiveness of the developed system, the. Developmental research can be defined as the study of designing, developing, and processing of relevant assessments to instructional programs and products that should comply with the requirements of core consistency and effectiveness. Although developmental research is a well-known type of research method that could provide experts with usable data and information, it lacks focus on the design, development, and evaluation of instructional products and processes [23]. One of the objectives of developmental research is leading the design, development, and evaluation of products and processes by producing models and principles [24].
Statistical tools such as percentage and frequency distribution, rank method, and weighted mean were adopted in this study. There were selected thirty-eight (38) ICT teachers from six (6) campuses of Asian Institute of Computer Studies (AICS) in Metro Manila that evaluated the developed system, and their responses were carefully examined to achieve an acceptable result.
A. Work Done / Contributions
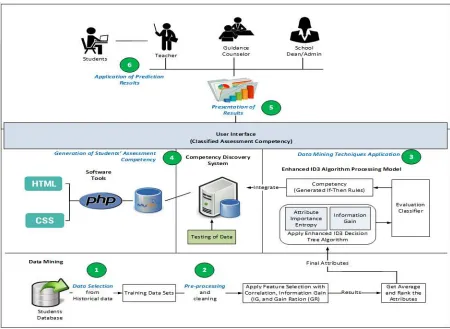
Fig. 1 shows the architecture of system development, composition, and basic operation ability.
The system flow comprised of six (6) major stages, namely: 1) data selection; 2) preprocessing; 3) data mining techniques application; 4) generation of the student’s assessment competency with ‘if-then’ rules; 5) presentation of results; 6) application of prediction outcomes.
From the student databases, the user extracted data needed for data selection and pre-processing. Large data records roughly 45,000 samples from eighty (80) selected students, who took a technical course of Computer Science, were collected from AICS. Students’ data from the year 2013 to 2016 were randomly selected from pre-determined school branches in Metro Manila. The selected students took the National Certificate IV (NCIV) Programming facilitated by the Technical Education and Skills Development Authority (TESDA). Data were collected from the school database and spreadsheets. It included the students’ information, academic and technical skills performance. The attributes that possibly influenced their assessment competency during the NCIV are shown in Table 1.
TABLEI STUDENTS DATA ATTRIBUTES
Attributes Values
Batch-Year Year (e.g., 2016, 2017) SHS-Track Track (e.g., ICT)
Class-Section Section A, Section B, Section C, Section_n)
Gender Male, Female General Weighted
Average (GWA) Grade
(Grade A <= 100%, Grade B <= 95%, Grade C <= 85%, Grade D <= 80%, Grade F <= 74%)
Class-Attendance Always, Often, Occasionally, Never Written-Work (Excellent <= 100%, Very Good<=95%,
Satisfactory <= 85%, Poor <=74%)
Programming-Performance
(Excellent <=100%, Good <= 95%, Sufficient <= 85%, Struggling <= 79%, Unsatisfactory <=74%)
Exam-Grade (Good <= 100%, Average <= 85%, Poor <= 74%)
Exam-Condition Passed, Failed
Study-Type Regular-Student, Working-Student Competency Competent, Not-Competent
Correlation attribute gain ratio and information gain were applied for the feature selection of collected data. Before the application of the learning algorithm, feature selection is an essential data processing procedure. The effective removal of irrelevant or redundant data is the objective of feature selection. Accordingly, it improves the performance of the machine-learning algorithm [25]. The attributes were ranked based on the top values computed using feature selection.
B. Application of Feature Selection Techniques
To fix the relationship of attributes among other attributes, the authors used the Correlation Attribute Evaluation (CAE), Gain-Ratio Attribute Evaluation (GRAE), and Information-Gain Attribute Evaluation (IGAE). The average value of Correlation, IGAE, and GRAE were taken to achieve the results of the variables. Next, results were captured using Waikato Environment Knowledge Analyzer (WEKA), which is a collection of visualization tools and algorithms for data analysis and predictive modeling, with user-friendly interfaces for quick access to these functions [26]. The final rankings were analyzed to determine the impact of each attribute in creating an enhanced ID3 algorithm decision tree model based on if-then rules. These rules were integrated into the proposed system for analysis and prediction.
In Table 2, attributes were presented with an average rate. The author used the top five (5) average created with feature selection techniques to generate a predictive decision tree model. The attribute Written-Work had the highest average rate of 0.5871. Programming-Performance placed at second best with an average rate of 0.4228 followed by General Weighted Average (GWA), Exam Grade, and Attendance with an average rate of 0.3713, 0.3440, and 0.1991 respectively. The results suggested that the attribute Written-Work showed the best performance among others. The results showed that attribute Written-Work significantly influenced output, and displayed the best performance in all three (3) data sets. Whereas, SHS-Track and Exam Condition attributes had a zero value, which implies nil influence to the ID3, algorithm decision tree model.
TABLEII
STUDENTS ATTRIBUTES RANKINGS
Attributes Correlation Info Gain (IG)
Gain Ratio (GR)
Average
Exam-Grade 0.5248 0.2629 0.2444 0.3440 Class-Attendance 0.3409 0.1267 0.1298 0.1991 General Weighted
Average (GWA) Grade
0.4993 0.3696 0.2451 0.3713
Written-Work 0.7642 0.4985 0.4987 0.5871
Programming-Performance 0.5722 0.4155 0.2806 0.4228 Study-Type 0.1291 0.0134 0.043 0.0618 Class-Section 0.0843 0.0106 0.0075 0.0341 Gender 0.1336 0.0131 0.0142 0.0536 Batch-Year 0.0244 0 0 0.0081 SHS-Track 0 0 0 0 Exam-Condition 0 0 0 0
C. Integration of enhanced ID3 algorithm
To enhance the ID3 algorithm, attributes with numerous values were diluted. The attribute importance entropy and information gain computation were applied to get these values. In Table 3, it shows that information gain for each attribute. Written-Work had a significant figure, and as such, would become the root of the decision tree. The if-then rules were created using the structured decision tree (see Fig. 2). In addition, Table 3 shows the top 5 attributes consisted of Written-Work, Programming-Performance, General Weighted Average, Exam-Grade, and Attendance.
TABLEIII PREDICTORS ATTRIBUTES
Attributes Entropy Attribute Importance
Entropy
Information Gain
Attendance 0.9632 0.8365 0.1267 General
Weighted Average (GWA)
0.9632 0.5936 0.3696
Written-Work 0.9632 0.2410 0.7221
Programming-Performance
0.9632 0.5477 0.4155
Fig. 2 If-Then Rules generated by the Enhanced ID3 Decision Tree Model D. Functionalities of Competency Discovery System
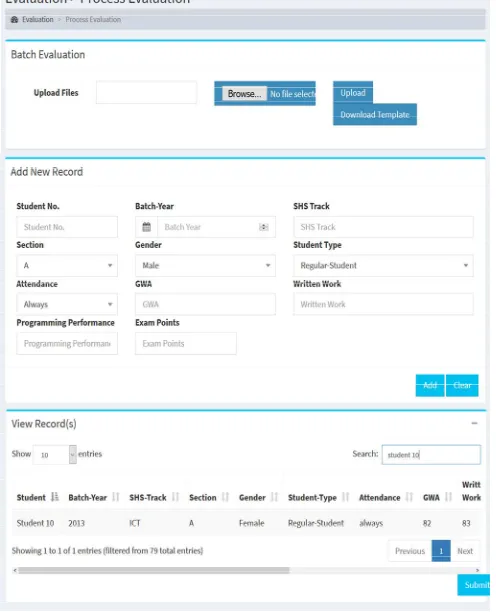
The ICT teacher can perform assessment competency of SHS students repeatedly in the system. The user can upload batch records using a template with students’ data, or it can be added manually in the system (see Fig. 3).
Fig. 3 Competency Evaluation Page
The top five (5) predictors attribute appear in Predictors Attributes Page as shown in Fig. 4. The attributes that have numeric values will be converted to nominal values. Upon submission, the system will assess the assessment competency of students based on their academic and technical performance. Set of rules generated from the enhanced ID3 algorithm will be the basis to predict the competency results as shown in Fig. 5.
Fig. 4 Predictors Attributes Page
Fig. 5 Evaluation Results
III.RESULTS AND DISCUSSION
The respondents evaluated the developed system based on reliability, efficiency, usability, security of data and information, and user-friendliness. Majority of the respondents concurred that the developed system is “Highly Acceptable”, and therefore, it resulted in the respondent's satisfactory results. The study focused on developing a Competency Discovery System: Integrating the Enhanced ID3 Decision Tree Algorithm to Predict the Assessment Competency of Senior High School.
specifically for programming-related. The system can be run on a desktop. It is not yet applicable in android and IOS applications.
IV.CONCLUSION
Developed Competency Discovery System was successful in the integration of feature selection and an enhanced ID3 algorithm. With the pre-processing data procedures and user-oriented interface, other, other educational institution to forecast the assessment competency performance of their students can adopt this study.
Furthermore, the results can help Senior High School students under the ICT track to be guided in programming related assessment. The developed competency discovery system with an integrated and enhanced ID3 algorithm provides prediction results that can undoubtedly help ICT teachers to identify students that need immediate assistance and preparation for taking the national certification programming related assessment. In addition, the developed system can be beneficial to other schools or universities, ICT teachers, and SHS-ICT students.
For future work, the study can be extended with more distinctive attributes (i.e., financial status, external factors, other tracks) to get valid results, and information useful to enhance the student’s assessment competency. The study can be further extended to a large number of students covering a wide area across the country. Lastly, this study can be done on a different data-mining algorithm to get a broader approach and valuable outputs.
REFERENCES
[1] Sameer, P. and Sachin, B. (2016). Educational Data Mining – A New Approach to the Education Systems. ISSN (Print): Pages 2319-2526, Volume 5, Issue 1, 2016
[2] Zahedifard, M.; Attarzadeh, I.; Pazhokhzadeh, H.; Malekzadeh, J. (2015). Prediction of students’ performance in high school by data mining classification techniques. International Academic Journal of Science and Engineering Vol. 2, No. 7, 2015, pp. 25-33.
[3] Mythili, M.S. and Shanavas, A.R.M. (2014). An Analysis of students’ performance using classification algorithms. IOSR Journal of Computer Engineering (IOSR-JCE) e ISSN: 2278-0661, p- ISSN: 2278-8727 Volume 16, Issue 1, Ver. III (Jan. 2014), PP 63,69. [4] Saa, A.A. (2016). Educational Data Mining and Student’s
Performance Prediction. (IJACSA) International Journal of Advanced Computer Science and Applications, Vol. 7, No. 5, 2016 [5] Agpayong, K.B., Hayfron-Acquah J.B., Asante (2016). An Overview
of Data Mining Models (Descriptive and Predictive). IJournals: International Journal of Software & Hardware Research in Engineering. ISSN-2347-4890 Volume 4 Issue 5 May, 2016 [6] Patil, P. (2015). A Study of Student’s Academic Performance Using
Data Mining Techniques. International Journal of Research in Computer Applications and Robotics. ISSN 2320-7345. Vol.3 Issue 9, Pages 59-63, September 2015.
[7] Sondwale, P. (2015). Overview of Predictive and Descriptive Data Mining Techniques. International Journal of Advanced Research in Computer Science and Software Engineering. ISSN: 2277 128X Volume 5, Issue 4, April 2015
[8] Samrat S. and Vikesh K. (2012). Classification of Student’s data Using Data Mining Techniques for Training & Placement
Department in Technical Education. International Journal of Computer Science and Network (IJCSN), Volume 1, Issue 4. [9] Al-Barrak, M. and Al-Razgan, M. (2016). Predicting Students Final
GPA Using Decision Trees: A Case Study. International Journal of Information and Education Technology, Vol. 6, No. 7, July 2016 [10] Vadivu, P.S. and Bharathi, D. (2014). Survey on Students’ Academic
Failure and Dropout using Data. International Journal of Advances in Computer Science and Technology. Volume 3, No.5, May 2014. [11] Mesarić, J. and Šebalj, D. (2016). Decision trees for predicting the
academic success of students. Croatian Operational Research Review. CRORR 7, 367–388
[12] Bhatt, H.; Mehta, S.; D'mello, L. (2015). Use of ID3 Decision Tree Algorithm for Placement Prediction. International Journal of Computer Science and Information Technologies, Vol. 6 (5), 2015, 4785-4789
[13] Nirmala Devi, R.; Deepa, R.; Kalaiarasi, P. (2015). Mining Educational Data for Predicting Higher Secondary School Student’s Grade Using ID3 Algorithm. International Journal of Engineering and Computer Science. ISSN:2319-7242. Volume 4 Issue 1 January 2015, Page No. 10068-10071
[14] Joseph, S. and Laya, D. (2015). Student’s Performance Prediction Using Weighted Modified ID3 Algorithm. International Journal of Scientific Research Engineering & Technology (IJSRET), ISSN 2278 – 0882 Volume 4, Issue 5, May 2015.
[15] Mesaric, J., & Sebalj, D. (2016). Decision trees for predicting the academic success of students. Croatian Operational Research Review, 7(2), 367-38
[16] Wang, S. and Zhou, A. (2016). Collaborate Computing: Networking, Applications, and Worksharing. 12th International Conference, CollaborateCom 2016, pp. 596.
[17] Adhatrao, K.; Gaykar, A.; Dhawan, A; Jha, R.; Honrao, V. (2013). Predicting Students' Performance Using ID3 and C4.5 Classification Algorithms
[18] Bhatt, H.; Mehta, S.; D'mello, L. (2015). Use of ID3 Decision Tree Algorithm for Placement Prediction. International Journal of Computer Science and Information Technologies, Vol. 6 (5), 2015, 4785-4789
[19] Suganya, J. and Balasubramanian, R. (2016). Enhanced ID3 algorithm based on the weightage of the Attribute. International Journal of Innovative Research in Advanced Engineering (IJIRAE) ISSN: 2349-2763, Issue 03, Volume 3 (March 2016)
[20] Wang, Y.; Li, Y.; Song, Y.; Rong X. (2017). Improvement of ID3 Algorithm Based on Simplified Information Entropy and Coordination Degree. Algorithms 2017, 10, 124; doi:10.3390/a10040124. www.mdpi.com/journal/algorithms [21] Wickford H. (n.d.). Descriptive Research Strategies. Small Business–
Chron.com. Retrieved from
http://smallbusiness.chron.com/descriptive-research-strategies-12107.html
[22] Williams, C. (2007). Research Methods. Journal of business & Economic Research – March 2007. Volume 5, Number 3.
[23] Richey, R., & Klein, J. (2005). Developmental Research Methods: Creating Knowledge from Instructional Design and Development Practice. Journal of Computing in Higher Education. Spring 2005. Vol. 16, Pages 23-38.
[24] Richey, R.C., & Nelson, W.A. (1996). Developmental Research. In D.H. Jonassen (Ed), Handbook of research for educational communication and technology (pp. 1213 – 1245). New York: Simon & Schuster Macmillan
[25] Hall, M., & Smith, L. (1999). Feature Selection of Machine Learning: Comparing a Correlation-based Filter Approach to the Wrapper. Proceedings of the Twelfth International Florida Artificial Intelligence Research Society Conference. Pages 235-239.