Academia Journal of Medicinal Plants 7(7): 169-180, July 2019 DOI: 10.15413/ajmp.2019.0147
ISSN: 2315-7720
©2019 Academia Publishing
Research Paper
Evaluation of reference genes for gene expression studies in senna (
Cassia
angustifolia
Vahl.) using quantitative real-time polymerase chain reaction
Accepted 30th July, 2019
ABSTRACT
Quantitative real-time polymerase chain reaction (RT-qPCR) is one of the most common methods used for quantification of gene expression due to its high sensitivity, specificity, accuracy and reproducibility. However, a selection of stable and suitable reference genes is crucial for reliable estimation of target gene expression under varied experimental conditions. The aim of the present study was to identify reference gene for gene expression studies in Senna (Cassia angustifolia Vahl.), a medicinal plant with potent laxative properties. Nine genes commonly used as internal controls in plants were selected in this study: Actin (caActin2-7), 18srRNA (ca18s), Glyceraldehyde-3-phosphate dehydrogenase (caGAPDH), Actin11 (caActin11), Alcohol dehydrogenase (caADH), ATP synthase (caATPSyn), β-Tubulin (caβ-TUB), Eukaryotic elongation factor 1-alpha (caEEF1-α) and Eukaryotic elongation factor 1-beta (caEEF1-β) for their suitability as internal controls in RT-qPCR to understand sennoside biosynthesis as well as abiotic stress. The expression stability of reference genes was studied using qRT-PCR in leaf (young and mature), pod (young and mature) and flower tissue of three (Sona, DCA-80 and DCA-149) genotypes of senna differing with sennoside content. All genes studied showed low variability (6.0-15.93% CV of Cq). Gene stability was assessed using the statistical algorithm GeNorm. The reference genes, caActin2-7, caGAPDH, caADH, caATPsyn, caEEF1-α and caEEF1- β are stable (M= <1.5) across all the tissues and genotypes studied thus enabling their wider use as internal controls. The study provides the foundation for reference gene(s) selection and will contribute towards more accurate target gene expression estimates which will help to elucidate the biosynthetic pathways that underlie sennoside production and abiotic stress tolerance in senna.
Key words: Senna, Cassia angustifolia, Reference genes, Expression stability, RT-qPCR, Sennoside biosynthesis.
INTRODUCTION
Expression pattern of genes involved in various metabolic pathways are required for understanding biological processes in plants. Among the various methods to estimate gene expression, fluorescence based RT-qPCR has shown significant advantage due to its high sensitivity, specificity, accuracy and reproducibility. Therefore, it has become the
method of choice for quantification of gene expression in plants and animals (Heid et al., 1996). Besides, it is the best method for the confirmation of global gene expression based on microarrays (Argyropoulos et al., 2005; Schmittgen et al., 2000). Measuring the kinetics of the reaction in the early phases of PCR provides a distinct Rama Reddy Nagaraja Reddy*and
Ponnuchamy Manivel
ICAR-Directorate of Medicinal and Aromatic Plants Research, Boriavi, Anand - 387 310, Gujarat, India.
advantage over traditional PCR detection. RT-qPCR is the most accurate and sensitive method to study gene expression with low concentrations of mRNA in any tissues (Bustin and Nolan, 2004; Kumar et al., 2011). Although it is widely used for quantification of gene expression, RT-qPCR suffers certain drawbacks such as differences in initial sample amount, RNA integrity issues, differences in the efficiency of cDNA synthesis, and differences in the overall transcriptional activity of the tissues or cells analyzed (Bustin, 2002), beside variation such as biological and technical variation during the procedure of RNA extraction, cDNA synthesis, real time PCR, and sample loading (Vandesompele et al., 2002; Andersen et al., 2004). Therefore, selection of an appropriate normalization method becomes imperative for obtaining reliable quantitative gene expression results. Reference genes or endogenous controls are used for data normalization during RT-qPCR (Andersen et al., 2004). Normalization of gene expression eliminate non-specific template variations between samples due to mRNA integrity, purity and reverse transcription efficiency, as well as pipetting errors (Nolan et al., 2006). Ideally, a reference gene should be uniformly transcribed and exhibit a similar transcription abundance to that of the target gene under different experimental conditions (Goossens et al., 2005; Nolan et al., 2006; Schmittgen and Zakrajsek, 2000; Wan et al., 2010). Although it is aptly sound to use reference genes which have been used in other near related plant species, it has been shown that reference genes have different stabilities depending on the type of tissue or experimental conditions (Ong et al., 2016). Further, commonly used reference genes in plants and animal systems such as 18s and 28s rRNA are affected by many biological factors (Warner, 1999). So, identification of the most stable reference gene(s) for specific experimental conditions is important and imperative for unbiased estimation of gene expression pattern.
Senna (Cassia angustifolia Vahl.) is used as a natural laxative and is widely used as a purgative, laxative, expectorant, wound dresser, antidysentric, and carminative (Dave and Ledwani, 2012; Reddy et al., 2015). The medicinal properties of senna are due to production of sennosides in leaves and pods. Senna is drought tolerant annual shrub (Mehta et al., 2017) and a rich source of galactomannan gum (Rajput et al., 2015). To date, improvements in transcriptome sequencing have provided an unprecedented opportunity to enhance our understanding on biosynthetic pathway of sennosides (Reddy et al., 2015) and abiotic stress tolerance (Mehta et al., 2017) in senna. Therefore, senna is regarded as a plant model for research of the biosynthesis of sennoside anthraquinones, galactomannan gums and drought in higher plants.
The statistical models, geNorm, NormFinder and BestKeeper are used for estimating variance reference genes for normalization (Vandesompele et al., 2002; Pfaffl
et al., 2004). The models, geNorm and NormFinder, use raw data as input and allow easy comparison, whereas, Bestkeeper calculates the geometric mean of the best suited genes by raw Cq values of each gene and employs a pair-wise correlation analysis to determine the optimal reference genes (Pfaffl et al., 2004).
Academia Journal of Medicinal Plants; Reddy et al. 171
MATERIALS AND METHODS
Plant materials and tissues
Three genotypes, Sona, DCA-149 and DCA-80 of Senna (Cassia angustifolia) were used to identify stable reference genes. The genotype Sona is a cultivar developed from CSIR-Central Institute of Medicinal and Aromatic Plants (CIMAP), Lucknow, India. While the genotypes, DCA-149 and DCA-80 are the germplasm accessions maintained at ICAR-Directorate of Medicinal and Aromatic Plants Research (DMAPR), Anand, Gujarat, India. Pure seed of all the genotypes were raised in the research block of ICAR-DMAPR, Anand, Gujarat, India during 2015-2016. Leaves (young and mature), pods (young and mature) and flower tissues were collected at the time of flowering. The tissues were dipped in RNA later (Sigma-Aldrich, St. Louis, Missouri, United States) and were immediately frozen in liquid nitrogen, and then stored at -80C for isolation of total RNA.
RNA extraction and cDNA synthesis
Total RNA from the leaves (young and mature), pods (young and mature) and flowers of Sona, DCA-149 and DCA-80 tissues was isolated using Trizol (Invitrogen) as per manufacturer’s instruction using the standard protocol described by the manufacturer (Thermo Fisher Scientific168 Third Avenue Waltham, MA USA 02451). The quality of the isolated RNA was checked on 1% denatured Agarose gel for the presence of 28S and 18S bands. cDNA was synthesized using oligo (dT) as primers by M-MLV reverse transcriptase according to the manufacturer’s instructions (Thermo scientific, Waltham, Massachusetts, United States). After the reverse transcription, synthesized cDNA was stored at -20C until use.
Primers and real-time PCR
Nine constitutively expressing genes in plants were selected based on previous studies (Stolf-Moreira et al., 2011; Hu et al., 2009; Mehta et al., 2017). Orthologs of the reference genes were picked from the senna leaf transcriptome library (Reddy et al., 2015). The primers were designed using primer3 with default parameters[http://frodo.wi.mit.edu/primer3/]. The expected allele size range given was 100-200 bp while picking the primers. The specificity of the primers was further confirmed by BLAST search. Annealing temperatures were optimized according to individual primers by testing several annealing temperatures ranging from 50 to 65C around the respective primer Tm, and the
annealing temperature with the best efficiency was chosen.
Real-time PCR was performed in a 25 μl volume using SYBR premix (Genetix, Delhi, India) on the CFX Connect Real-time PCR detection system (Bio-Rad, Hercules, USA) by following a program: 5 min at 95C; followed by 45 cycles of amplification with denaturation for 5 s at 95C, annealing for 30 s at 55C, and extension for 20 s at 72C. A melting step was performed to confirm a single gene-specific peak by a stepwise temperature increase ranging from 60 to 95C at ramp rate of 1C /s with continuous monitoring of fluorescence. No-template controls (NTCs) were included for each primer pair. Further analysis of amplicon specificity and size were also evaluated by running qPCR products in a standard 2% agarose gel electrophoresis. Triplicates under identical conditions were synchronously performed for all genes. Standard curves were made to calculate the amplification efficiency during real-time PCR using five-fold serial dilutions of cDNA for each tissue and each reference gene. The quantification cycle (Cq) was automatically determined for each reaction by the CFX Maestro™ Software (Bio-Rad, Hercules, USA). Finally, the specificity of the qRT-PCR reactions was determined by melt curve analysis of the amplified products.
Data analysis
We calculated the cycle threshold (Cq) values and real-time PCR efficiencies (E) for each reference gene to know the gene expression pattern. Relative standard curve was constructed using a 5-fold dilution series of cDNA from each tissue. PCR efficiency was determined by converting quantification cycles (Cq values) into raw data (relative quantities). The real-time E value was calculated from the given slopes in the SAS software according to the equation: (E = 10(−1/slope)−1) (Hellemans et al., 2007). Only Cq values <35 were used for calculating E values. Cq and E values were then analyzed in geNorm on the SAS 9.5 software (SAS, 2010) using SAS Proc qPCR program (Ling, 2012), which ranks the reference genes based on the M values. Meanwhile, geNorm software was used to calculate the pair-wise variation (Vn/Vn+1) between the sequential
normalization factors NFn and NFn+1. A one-way ANOVA
was also performed on Cq values obtained from the expression in genotypes and tissues. We used Microsoft Excel 2010 to calculate other statistical parameters.
RESULTS
Selection of reference genes
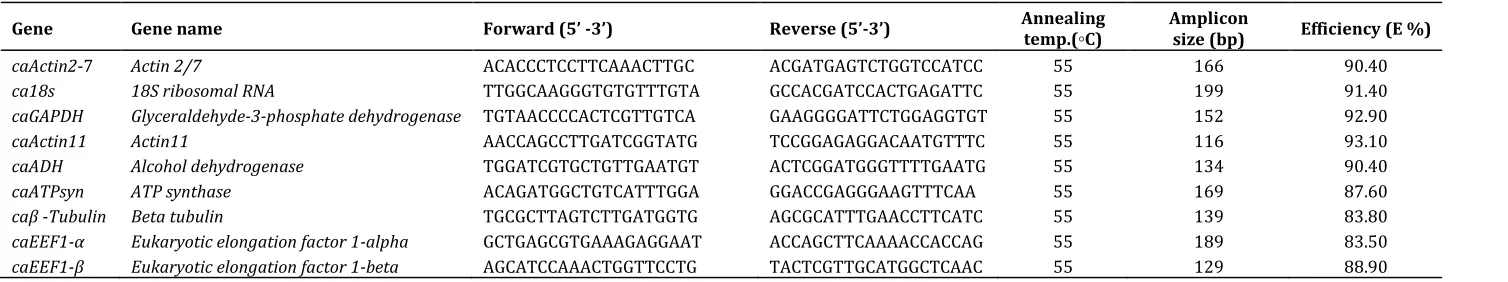
Table 1: Reference genes evaluated in this study.
Gene Gene name Forward (5’ -3’) Reverse (5’-3’) Annealing temp.(◦C)
Amplicon
size (bp) Efficiency (E %)
caActin2-7 Actin 2/7 ACACCCTCCTTCAAACTTGC ACGATGAGTCTGGTCCATCC 55 166 90.40
ca18s 18S ribosomal RNA TTGGCAAGGGTGTGTTTGTA GCCACGATCCACTGAGATTC 55 199 91.40
caGAPDH Glyceraldehyde-3-phosphate dehydrogenase TGTAACCCCACTCGTTGTCA GAAGGGGATTCTGGAGGTGT 55 152 92.90
caActin11 Actin11 AACCAGCCTTGATCGGTATG TCCGGAGAGGACAATGTTTC 55 116 93.10
caADH Alcohol dehydrogenase TGGATCGTGCTGTTGAATGT ACTCGGATGGGTTTTGAATG 55 134 90.40
caATPsyn ATP synthase ACAGATGGCTGTCATTTGGA GGACCGAGGGAAGTTTCAA 55 169 87.60
caβ -Tubulin Beta tubulin TGCGCTTAGTCTTGATGGTG AGCGCATTTGAACCTTCATC 55 139 83.80
caEEF1-α Eukaryotic elongation factor 1-alpha GCTGAGCGTGAAAGAGGAAT ACCAGCTTCAAAACCACCAG 55 189 83.50
caEEF1-β Eukaryotic elongation factor 1-beta AGCATCCAAACTGGTTCCTG TACTCGTTGCATGGCTCAAC 55 129 88.90
in soya bean (Stolf-Moreira et al., 2011; Hu et al., 2009), a close relative of Senna (both belong to Fabaceae family) and other plant species (Crismani et al., 2006; Expósito-Rodríguez et al., 2008; Liu et al., 2013; Liu et al., 2015; Wu et al., 2015), we selected Actin (caActin2-7), 18srRNA (ca18s), Glyceraldehyde-3-phosphate dehydrogenase (caGAPDH), Actin11 (caActin11), Alcohol dehydrogenase (caADH), ATP synthase (caATPSyn), β-Tubulin (caβ-TUB), Eukaryotic elongation factor 1-alpha (caEEF1-α) and Eukaryotic elongation factor 1-beta (caEEF1-β) reference genes for the study (Table 1). These genes encode proteins with a wide variety of biological functions such as transcription factors, ubiquitous enzymes or cytoskeleton elements and others. Variability of RNA samples was evaluated by RT-PCR for18srRNA gene. All the RT-PCR reactions produced a single 18srRNA specific band with a predicted molecular weight on agarose gel, confirming that the extracted RNA samples were suitable for transcript level analysis. RT-PCR with all the reference genes produced a single band in agarose gel electro-phoresis, indicating specificity of amplification.
Expression profile of reference genes
Nine reference genes were amplified in young leaf, mature leaf, young pod, mature pod and flower tissues of three genotypes viz. Sona, DCA-129 and DCA-80 of senna using cDNA as a template in a Real-time PCR detection system (Figure 1). To check the specificity of the primers, agarose gel electro-phoresis was performed following completion of the qRT-PCR assays. The primer pairs amplified a single band of the expected respective size and formed no primer dimers or other non specific amplification products. All the real-time PCR assays produced a single bond indicating the specificity of amplification (Supplementary Figure S1 and S2).
Efficiency (E) value of reference genes, mean, standard deviation (SD) and Coefficient of variation (CV) of Cq values for each tissues are given in Table 2. All reference genes had a Cq values below 31.19 cycles across tissues, indicating an abundance of cDNA in the samples. The reference gene caEEF1-α showed the most abundant expression level with an average Cq value of 17.81, whereas caADH gene showed the least abundant expression level with an
average Cq value of 25.10. The PCR efficiency of the nine candidate reference genes ranged from 83.50% for caEEF1-α to 93.10% for caActin11 (Table 1). There was no significant variation in Cq values of all the tissues of sona, DCA-129 and DCA-80 genotypes in senna.
Expression stability of reference genes
Academia Journal of Medicinal Plants; Reddy et al. 173
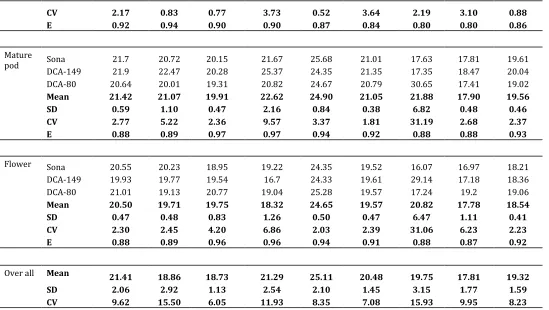
Figure 1: RNA transcription levels of reference genes presented as absolute Cq values in different tissues of Senna (Cassia angustifolia).The reference genes are: Actin (caActin2-7), 18srRNA (ca18s), Glyceraldehyde-3-phosphate dehydrogenase (caGAPDH), Actin11 (caActin11), Alcohol dehydrogenase (caADH), ATP synthase (caATPSyn), β-Tubulin (caβ-TUB), Eukaryotic elongation factor 1-alpha (caEEF1-α) and Eukaryotic elongation factor 1-beta (caEEF1-β) tissue samples.
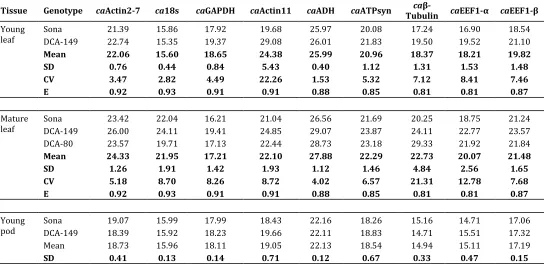
Table 2: Mean, standard deviations (SD) and coefficient of variation (CV) of Cycle threshold (Cq), and reaction efficiency (E) values for individual genes in examined tissues of Senna (Cassia angustifolia).
Tissue Genotype caActin2-7 ca18s caGAPDH caActin11 caADH caATPsyn ca
β-Tubulin caEEF1-α caEEF1-β
Young leaf
Sona 21.39 15.86 17.92 19.68 25.97 20.08 17.24 16.90 18.54
DCA-149 22.74 15.35 19.37 29.08 26.01 21.83 19.50 19.52 21.10
Mean 22.06 15.60 18.65 24.38 25.99 20.96 18.37 18.21 19.82 SD 0.76 0.44 0.84 5.43 0.40 1.12 1.31 1.53 1.48 CV 3.47 2.82 4.49 22.26 1.53 5.32 7.12 8.41 7.46 E 0.92 0.93 0.91 0.91 0.88 0.85 0.81 0.81 0.87
Mature leaf
Sona 23.42 22.04 16.21 21.04 26.56 21.69 20.25 18.75 21.24
DCA-149 26.00 24.11 19.41 24.85 29.07 23.87 24.11 22.77 23.57
DCA-80 23.57 19.71 17.13 22.44 28.73 23.18 29.33 21.92 21.84
Mean 24.33 21.95 17.21 22.10 27.88 22.29 22.73 20.07 21.48 SD 1.26 1.91 1.42 1.93 1.12 1.46 4.84 2.56 1.65 CV 5.18 8.70 8.26 8.72 4.02 6.57 21.31 12.78 7.68 E 0.92 0.93 0.91 0.91 0.88 0.85 0.81 0.81 0.87
Young pod
Sona 19.07 15.99 17.99 18.43 22.16 18.26 15.16 14.71 17.06
DCA-149 18.39 15.92 18.23 19.66 22.11 18.83 14.71 15.51 17.32
Mean 18.73 15.96 18.11 19.05 22.13 18.54 14.94 15.11 17.19
Table 2: Continued.
CV 2.17 0.83 0.77 3.73 0.52 3.64 2.19 3.10 0.88 E 0.92 0.94 0.90 0.90 0.87 0.84 0.80 0.80 0.86
Mature
pod Sona 21.7 20.72 20.15 21.67 25.68 21.01 17.63 17.81 19.61
DCA-149 21.9 22.47 20.28 25.37 24.35 21.35 17.35 18.47 20.04
DCA-80 20.64 20.01 19.31 20.82 24.67 20.79 30.65 17.41 19.02
Mean 21.42 21.07 19.91 22.62 24.90 21.05 21.88 17.90 19.56 SD 0.59 1.10 0.47 2.16 0.84 0.38 6.82 0.48 0.46 CV 2.77 5.22 2.36 9.57 3.37 1.81 31.19 2.68 2.37 E 0.88 0.89 0.97 0.97 0.94 0.92 0.88 0.88 0.93
Flower Sona 20.55 20.23 18.95 19.22 24.35 19.52 16.07 16.97 18.21
DCA-149 19.93 19.77 19.54 16.7 24.33 19.61 29.14 17.18 18.36
DCA-80 21.01 19.13 20.77 19.04 25.28 19.57 17.24 19.2 19.06
Mean 20.50 19.71 19.75 18.32 24.65 19.57 20.82 17.78 18.54 SD 0.47 0.48 0.83 1.26 0.50 0.47 6.47 1.11 0.41 CV 2.30 2.45 4.20 6.86 2.03 2.39 31.06 6.23 2.23 E 0.88 0.89 0.96 0.96 0.94 0.91 0.88 0.87 0.92
Over all Mean 21.41 18.86 18.73 21.29 25.11 20.48 19.75 17.81 19.32
SD 2.06 2.92 1.13 2.54 2.10 1.45 3.15 1.77 1.59 CV 9.62 15.50 6.05 11.93 8.35 7.08 15.93 9.95 8.23
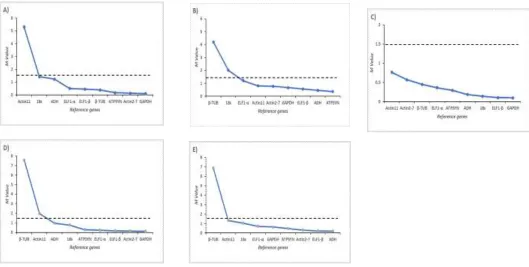
in the order of increasing M-values (Table 3). The M-value of 5.30 was recorded with caActin 11 reference gene in young leaf. While in mature leaf, all the nine genes, except caβ-TUB and ca18s, had E-value less than 1.5 and were ranked as caATPSYN (rank 1), caADH (rank 2), caELF1-β (rank 3), caGAPDH (rank 4), caActin2-7 (rank 5), caActin11 (rank 6) and caELF1-α (rank 7) as the most stable reference genes in the order of increasing M-values. The M-values in the young pod ranged from 0.09 to 0.76, indicating high stability of genes studied. caGAPDH (rank 1), caELF1-β (rank 2), caADH (rank 3), ca18s (rank 4), caATPSYN (rank 5), caELF1-α (rank 6), caβ-TUB (rank 7), caActin2-7 (rank 8) and caActin11 (rank 9), respectively were ranked in the order of increasing M-values. In contrast, the M-values in the mature pod ranged between 0.33 (caGAPDH) and 7.55 (caβ-TUB). The genes, caGAPDH (rank 1), caActin2-7 (rank 2), caELF1-β (rank 3), caELF1-α (rank 4), caATPSYN (rank 5), ca18s (rank 6) and caADH (rank 7) recoded M-value less than 1.5 and were respectively ranked in the order of increasing M-values. In flower, all the reference genes, except caβ-TUB recorded M-value less than 1.5, indicating the stability in the gene expression (Figure 3F). The reference genes, caADH (rank 1), caELF1-β (rank 2), caActin2-7 (rank 3), caATPSYN (rank 4), caGAPDH (rank 5), caELF1-α (rank 6), ca18s (rank 7) and caActin11 (rank 8) were ranked in the increasing order of their expression
stabilities. When all samples in different tissues were of 0.30, while the caβ-TUB was the least stable gene with M value of 3.90.
Optimization of reference genes for normalization
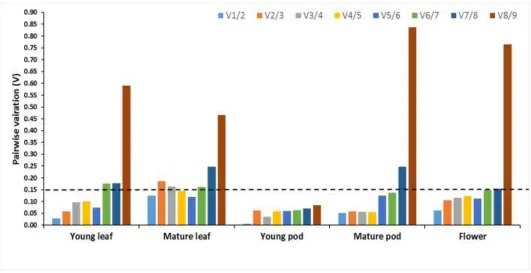
Optimal number of reference genes required for accurate normalization was calculated using geNorm which determines the pairwise variation Vn/Vn+1 that measures
the effect of measuring additional reference genes on the normalization factor. A cut-off value of 0.15 has been widely accepted as the criterion for selecting a suitable number of reference genes, below which the inclusion of additional reference genes are not needed (Vandersompele, 2002). The pair-wise variation V1/2 was lower than 0.15 in
leaf (young and mature), pod (young and mature) and flowers, indicating that the single or two most stable reference genes were sufficient for gene normalization in various tissues of senna (Figure 4). The best combinations among the nine reference genes were caGAPDH and caActin2-7 for young leaf (V1/2=0.029), caATPSYN and
caADH for mature leaf (V1/2=0.126), caGAPDH and caELF1-β
for young pod (V1/2=0.007), caGAPDH and caActin2-7 for
mature pod (V1/2=0.052) and caADH and caEEF1-βin flower
Academia Journal of Medicinal Plants; Reddy et al. 175
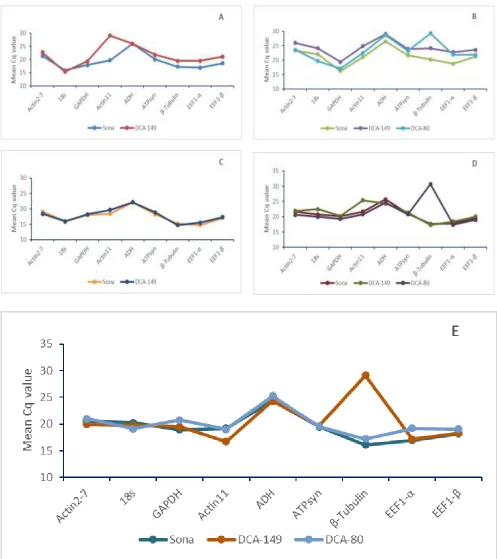
Figure 2: Average RNA transcription levels in different tissues presented as absolute Cq values in Senna (Cassia angustifolia).The tissues: Young leaf (A), Mature leaf (B), Young pod (C), Mature pod (D) and Flower (E).
DISCUSSION
Gene expression is heterogeneous and complex, and depends on the tissue, developmental stage, and condition of the experiment (Tenea et al., 2011; Chapman and
Figure 3: Expression stability values (M) of reference genes in tissues of Senna (Cassia angustifolia).The reference genes are: Actin (caActin2-7), 18srRNA (ca18s), Glyceraldehyde-3-phosphate dehydrogenase (caGAPDH), Actin11 (caActin11), Alcohol dehydrogenase (caADH), ATP synthase (caATPSyn), β-Tubulin (caβ-TUB), Eukaryotic elongation factor 1-alpha (caEEF1-α) and Eukaryotic elongation factor 1-beta (caEEF1-β) tissue samples.A) Young leaf, B) mature leaf, C) young pod, D)Mature pod, and E) flowers.
Table 3: Control genes ranked in the order of their expression stability.
Ranka Young leaf Mature leaf Young pod Mature pod Flower
1 caGAPDH caATPSYN caGAPDH caGAPDH caADH
2 caActin2-7 caADH caELF1-β caActin2-7 caELF1-β
3 caATPSYN caELF1-β caADH caELF1-β caActin2-7
4 caβ-TUB caGAPDH ca18s caELF1-α caATPSYN
5 caELF1-α caActin2-7 caATPSYN caATPSYN caGAPDH
6 caELF1-β caActin11 caELF1-α ca18s caELF1-α
7 caADH caELF1-α caβ-TUB caADH ca18s
8 ca18s ca18s caActin2-7 caActin11 caActin11
9 caActin11 caβ-TUB caActin11 caβ-TUB caβ-TUB
Reference genes with M values below 1.5 are considered as suitable reference genes for a particular tissue. aIncreasing expression stability from top to bottom.
with biological relevance. Reference genes are used for normalization in gene expression studies; however, choosing the best reference gene is the key for normalization. An ideal reference gene must be transcribed ubiquitously in the tissues being examined and remains is unchanged by any experimental treatment (Bustin, 2002; Czechowski et al., 2005). Reference genes/Internal control genes must be selected with caution. However, it must be noted that there are no universal reference genes that are stably expressed under all biological materials and/or experimental conditions. Several studies have shown that
Academia Journal of Medicinal Plants; Reddy et al. 177
reference genes, in five different tissues and three genotypes of senna which would help to assay the expression of genes involved in sennoside biosynthesis and abiotic stress tolerance. The identification of diagnostic reference genes was required to elucidate the biosynthetic pathways that underlie sennoside production and abiotic stress tolerance in senna, and the dynamics of gene expression are a valuable resource to achieve this goal.
In the present study, the average Cq values for all the reference genes studied in all the tissues were below 28 cycles, indicating strong positive reactions of the target tissue to the reference genes (Figure 1). As expected, the expression stability differs between tissues and genotypes. The study confirms that reference genes are expressed in every cell but are regulated differently in tissues and genotypes. geNorm is more commonly used analysis program for comparing the expression patterns of candidate reference genes and identifying the best suitable reference gene sets under particular conditions.
The GAPDH gene, encodes an enzyme in the glycolytic pathway, is present in most cell types and has been used commonly as an endogenous control in RT-qPCR experiments in plants (Expósito-Rodríguez, 2008). In the present study, caGAPDH showed an M value lower than the cutoff established by GeNorm (M<1.5) in leaf (young and mature), pod (young and mature) and flowers of senna indicating higher stability in the expression across the tissues. The use of GAPDH as a reference gene in RT-qPCR in medicinal plants such as liquarice (Glycyrrhiza glabra) has been reported (Maroufi, 2016). The gene for GAPDH should be used with caution because its expression can be more abundant in proliferating cells (Bustin, 2002). GADPH is unstably expressed in papaya during storage at different temperature or under nitrogen stress in tomato and actin is unstably expressed under salinity stress in potato or in cucumber (Nicot et al., 2005; Løvdal and Lillo, 2009; Wan et al., 2010; Zhu et al., 2012).
Actin genes encode a family of actin which are globular multi-functional proteins involved in cellular processes, including muscle contraction, cell motility, cell division and cytokinesis, vesicle and organelle movement, cell signaling, and the establishment and maintenance of cell junctions and cell shape. Actin genes are ubiquitously expressed in all eukaryotic cells and are used as reference genes in RT-qPCR experiments in plants (Reid et al., 2006; Maroufi, 2016; Liu et al., 2015). Actin2-7 (ACT2/7) encodes an actin protein that is constitutively expressed in vegetative structures but not in pollen. It is involved in tip growth of root hairs (Berardini et al., 2015). ACT2-7 was extensively used as reference gene in expression studies (Chapman and Waldenström, 2015; Hu et al., 2009). In the present study, caACT2-7 showed an M value lower than the cutoff established by GeNorm (M<1.5) in all tissues of senna. 18S ribosomal RNA (18srRNA) is a component of the small eukaryotic ribosomal subunit (40S) involved in protein synthesis. 18srRNA is the most commonly used reference
gene in expression studies in plants (Stolf-Moreira et al., 2011; Hu et al., 2009) due to its ubiquitous, abundant and stable expression across tissues and treatments. In the present study, ca18s showed an M value lower than the cutoff established by GeNorm (M<1.5) in leaf (young), pod (young and mature) and flower indicating higher stability in the expression in the tissues of senna. ca18s recorded an M value slightly higher than the cutoff established by GeNorm (M<1.5) in mature pod tissue and ranked last in stability by geNorm analysis. Previous studies have regarded rRNA as an ideal reference gene, given that the regulation of rRNA synthesis is independent of mRNA level (Bustin, 2002). However, an increasing amount of research is revealing the limitations of using 18S as a normalizer in RT-qPCR studies (Zhang et al., 2015a; Shen et al., 2010).
In the present study, the reference genes caADH, caATPsyn, caEEF1-α and caEEF1-β recorded an M value lower than GeNorm (M<1.5) in all the tissues and genotypes studied, thus regarded as highly stable reference genes for target gene quantification in Senna. The reference gene ADH encodes Alcohol dehydrogenase enzyme which facilitates the interconversion between alcohols and aldehydes or ketones with the reduction of nicotinamide adenine dinucleotide (NAD+ to NADH). ADH genes are ubiquitously expressed and are used as reference genes in RT-qPCR experiments in plants (Reid et al., 2006; Bas et al., 2012; Maroufi, 2016; Liu et al., 2015). Adenosine triphosphate (ATP) is the most commonly used "energy currency" of cells for most organisms. It is formed from adenosine diphosphate (ADP) and inorganic phosphate (Pi) catalyzed by ATP synthase enzyme. The gene ATPsyn that encodes ATP synthase enzyme is ubiquitous, abundant and has stable expression across tissues and treatments hence, used as endogenous control gene for target gene normalization in plants (Reddy et al., 2013). Eukaryotic elongation factors, EEF1 mediates the entry of the aminoacyl tRNA into a free site of the ribosome during protein synthesis. EEF1-α and EEF1-β, the subunits of EEF1 are abundantly expressed in the cytoplasm.
Figure 4: Pairwise variation of the reference genes in tissues of senna (Cassia angustifolia).
Czechowski et al., 2005; Maroufi, 2016; Liu et al., 2015). The rankings of the reference genes based on geNorm differed among tissue type used in this study perhaps due to tissue specific regulation of reference genes.
The optimal number of reference genes across different treatments determined by geNorm is presented in Figure 4. It has become clear from our study that a single reference gene is sufficient to normalize gene expression analysis in tissues used in Senna. Kylee et al. (2011) used multiple reference genes for normalizing functional gene expression, while Ling et al. (2011) indicated that an overabundance of reference genes may reduce data-normalization robustness.
Conclusion
Reference genes serve as an important endogenous control for data normalization in gene expression studies using qRT-PCR. We for the first time identified stable reference genes for expression assay using qRT-PCR in leaf (young and mature), pod (young and mature) and flowers in three genotypes of Senna. We provide a list of reference genes as well as specific primers that may be used in the future by researchers working on senna. The study provides the foundation for reference gene(s) selection in senna and will contribute toward more accurate target gene expression analysis studies and facilitate genomic research. Further, our study will also benefit future gene expression studies in other species of the genus Cassia or Senna.
ACKNOWLEDGEMENTS
This work was supported by funding from the Department of Science and Technology (DST)-Science and Engineering Research Board (SERB), Government of India with a grant number: SB/FT/LS-329/2012 (Young Scientist Award to RNR) and the funding from Indian Council of Agricultural Research (ICAR), New Delhi. Authors duly acknowledge the support rendered by the Director and the staff of ICAR-Directorate of Medicinal and Aromatic Plants Research, Anand, Gujarat. Authors are grateful to Dr. R.S. Fougat, Professor and Head, and Dr. Sushil Kumar, Assistant professor, Department of Biotechnology, Anand Agricultural University, Anand for extending the facilities for RT-qPCR work.
REFERENCES
Andersen CL, Jensen JL, Ørntoft TF (2004) Normalization of real-time quantitative reverse transcription-PCR data: a model-based variance estimation approach to identify genes suited for normalization, applied to bladder and colon cancer data sets. Cancer Res. 64(15): 5245–5250. Argyropoulos D, Psallida C, Spyropoulos CG (2005) Generic normalization
method for real-time PCR. Application for the analysis of the mannanase gene expressed in germinating tomato seed. FEBS J. 273(4): 770-777. Barsalobres-Cavallari CF, Severino FE, Maluf MP, Maia IG (2009)
Identification of suitable internal control genes for expression studies in
Coffea arabica under different experimental conditions. BMC Mol. Biol. 10: 1-10
Academia Journal of Medicinal Plants; Reddy et al. 179
Brunner AM, Yakovlev IA, Strauss SH (2004) Validating internal controls for quantitative plant gene expression studies. BMC Plant Biol. 4: 14. Bustin SA (2002). Quantification of mRNA using real-time reverse
transcription PCR (RT-PCR): trends and problems. J. Mol. Endocrinol. 29(1): 23-39.
Bustin SA (2004) Absolute quantification of mRNA using real-time reverse transcription polymerase chain reaction assays. J. Mol. Endocrinol. 25(2): 169-193.
Bustin SA, Nolan T (2004). Pitfalls of quantitative real-time reverse transcription polymerase chain reaction. J Biomol Tech 15(3):155-166 Chapman JR, Waldenström J (2015) With reference to reference genes: A
systematic review of endogenous controls in gene expression studies. PLoS One 10(11): e0141853.
Crismani W, Baumann U, Sutton T, Shirley N, Webster T, Spangenberg G, Langridge P, Able JA (2006). Microarray expression analysis of meiosis and microsporogenesis in hexaploid wheat. BMC Genomics. 7: 267. Cruz F, Kalaoun S, Nobile P, Colombo C, Almeida J, Barros LMG, Romano E,
Grossi-De-Sá MF, Vaslin M, Alves-Ferreira M (2009). Evaluation of coffee reference genes for relative expression studies by quantitative real-time RT-PCR. Mol. Breed 23: 607-616.
Czechowski T, Stitt M, Altmann T, Udvardi MK, Scheible WR (2005). Genome-wide identification and testing of superior reference genes for transcript normalization in Arabidopsis. Plant Physiol. 139: 5-17. Dave H, Ledwani L (2012). A review on anthraquinones isolated from
Cassia species and their applications. Indian J. Nat. Prod. Res. 3: 291-319.
Expósito-Rodríguez M, Borges AA, Borges-Pérez A, Pérez JA (2008). Selection of internal control genes for quantitative real-time RT-PCR studies during tomato development process. BMC Plant Biol. 8: 131. Ferguson BS, Nam H, Hopkins RG, Morrison RF (2010) Impact of reference
gene selection for target gene normalization on experimental outcome using Real-Time qRT-PCR in Adipocytes. PLoS One 5(12): e15208. Goossens K, Van Poucke M, Van Soom A, Vandesompele J, Van Zeveren A,
Peelman LJ (2005) Selection of reference genes for quantitative real-time PCR in bovine pre implantation embryos. BMC Dev. Biol. 5: 27. Gutierrez L, Mauriat M, Guénin S, Pelloux J, Lefebvre JF, Louvet R,
Rusterucci C, Moritz T, GuerineauF, Bellini C, Van Wuytswinkel O (2008) The lack of a systematic validation of reference genes: a serious pitfall undervalued in reverse transcription-polymerase chain reaction (RT-PCR) analysis in plants. Plant Biotechnol J 6(6):609-618.
Heid CA, Stevens J, Livak KJ, Williams PM (1996) Real time quantitative PCR. Genome Res. 6: 986-994.
Hellemans J, Mortier G, De Paepe A, Speleman F, Vandesompele J (2007). Base relative quantification framework and software for management and automated analysis of real-time quantitative PCR data. Genome Biol. 8: 19
Hu R, Fan C, Li H, Zhang Q, Fu Y-F (2009). Evaluation of putative reference genes for gene expression normalization in soybean by quantitative real-time RT-PCR. BMC Mol. Biol. 10: 93-99.
Huang S, An YQ, McDowell JM, McKinney EC, Meagher RB (1997). The Arabidopsis ACT11 actin gene is strongly expressed in tissues of the emerging inflorescence, pollen, and developing ovules. Plant Mol. Biol. 33(1): 125-139.
Kumar V, Sharma R, Trivedi PC, Vyas GK, Khandelwal V (2011). Traditional and novel references towards systematic normalization of qRT-PCR data in plants. Aust. J. Crop Sci. 5: 1455-1468.
Kylee J, Veazey MC (2011) Golding selection of stable reference genes for quantitative RT-PCR comparisons of mouse embryonic and extraembryonic stem cells. PloS One. 6: e27592.
Ling D (2012). SASqPCR: Robust and Rapid Analysis of RT-qPCR Data in SAS. PLoS One 7(1): e29788.
Ling D, Salvaterra PM (2011) Robust RT-qPCR data normalization: validation and selection of internal reference genes during post-experimental data analysis. PloS One 6: e17762.
Liu W, Zhao X, Zhang P, Mar TT, Liu Y, Zhang Z, Han C, Wang X (2013). A one step real-time RT-PCR assay for the quantitation of Wheat yellow mosaic virus (WYMV). Virol J. 10: 173.
Liu Z, Zhu Q, Li J, Yu J, Li Y, Huang X, Wang W, Tan R, Zhou J, Liao H (2015). Selection and evaluation of reference genes for expression analysis of Cassi, Biosci. Biotechnol. Biochem. 79 (11): 1818-1826.
Løvdal T, Lillo C (2009). Reference gene selection for quantitative real-time PCR normalization in tomato subjected to nitrogen, cold, and light stress. Anal. Biochem. 387(2): 238-242.
Mafra V, Kubo KS, Alves-Ferreira M, Ribeiro-Alves M, Stuart RM, Boava LP (2012). Reference genes for accurate transcript normalization in Citrus genotypes under different experimental conditions. PLoS One 7: e31263.
Maroufi A (2016). Selection of reference genes for real-time quantitative PCR analysis of gene expression in Glycyrrhiza glabra under drought stress. Biol. Plant. 60(4): 645-654.
Mehta RH, Manivel P, Kumar J, Reddy NR (2017). Exploring drought stress-regulated genes in senna (Cassia angustifoliaVahl.): a transcriptomic approach.Funct. Integr. Genomics 17(1): 1-25.
Nicot N, Hausman JF, Hoffmann L, Evers D (2005). Housekeeping gene selection for real-time RT-PCR normalization in potato during biotic and abiotic stress. J Exp. Bot. 56:2907-2914.
Nolan T, Hands RE, and Bustin SA (2006) Quantification of mRNA using real-time RT-PCR. Nat Protoc. 1(3): 1559-1582.
Nygard AB, Jłrgensen CB, Cirera S, Fredholm M (2007). Selection of reference genes for gene expression studies in pig tissues using SYBRgreen qPCR. BMC Mol Biol. 8: 67.
Ong OT, Young LJ, Old JM (2016). Evaluation of reference genes for gene expression in red-tailed phascogale (Phascogale calura) liver, lung, small intestine and spleen. Peer J. 4: e2552.
Pfaffl MW, Tichopad A, Prgomet C, Neuvians TP (2004). Determination of stable housekeeping genes, differentially regulated target genes and sample integrity: BestKeeper-Excel-based tool using pair-wise correlations. Biotechnol. Lett. 26: 509-515.
Rajput G, Pandey IP, Joshi G (2015). Carboxymethylation of Cassia angustifolia seed gum: Synthesis and rheological study. Carbohydr. Polym. 117: 494-500.
Reddy NRR, Mehta RH, Soni PH, Makasana J, Gajbhiye NA, Ponnuchamy M, Kumar J (2015). Next generation sequencing and transcriptome analysis predicts biosynthetic pathway of sennosides from Senna (Cassia angustifoliaVahl.), a non-model plant with potent laxative properties. PLoS One. 10(6): e0129422.
Reddy DS, Bhatnagar-Mathur P, Cindhuri KS, Sharma KK (2013). Evaluation and validation of reference genes for normalization of quantitative real-time PCR based gene expression studies in peanut. PLoS One 8(10): e78555.
Reid KE, Olsson N, Schlosser J, Peng F, Lund ST (2006). An optimized grapevine RNA isolation procedure and statistical determination of reference genes for real-time RT-PCR during berry development. BMC Plant Biol 6: 27.
SAS (2010) SAS Institute INC., Cary. NC. USA.
Schmittgen TD, Zakrajsek BA (2000). Effect of experimental treatment on housekeeping gene expression: validation by real-time, quantitative RT-PCR. J. Biochem. Biophys. Methods. 46(1-2): 69-81.
Shen GM, Jiang HB, Wang XN, Wang JJ (2010). Evaluation of endogenous references for gene expression profiling in different tissues of the oriental fruit fly Bactrocera dorsalis (Diptera: Tephritidae). BMC Mol. Biol. 11: 76.
Stolf-Moreira R, Lemos EGDM, Abdelnoor RV, Beneventi MA, Rolla AAP, Pereira SD, de Oliveira MCN, Nepomuceno AL, Marcelino-Guimaraes FC (2011). Identification of reference genes for expression analysis by real-time quantitative PCR in drought-stressed soybean. Pesquisa Agropecuaria Brasileira. 46(1): 58-65.
Suzuki T, Higgins PJ, Crawford DR (2000). Control selection for RNA quantitation. Biotechniques. 29(2): 332-337.
Tenea GN, Bota AP, Raposo FC and Maquet A (2011). Reference genes for gene expression studies in wheat flag leaves grown under different farming conditions. BMC Res Notes 4: 373.
Thellin O, Zorzi W, Lakaye B, De Borman B, Coumans B, Hennen G, Grisar T, Igout A, Heinen E (1999). Housekeeping genes as internal standards: use and limits. J. Biotechnol. 75: 291-295.
Vandesompele J, De Preter K, Pattyn F, Poppe B, Van Roy N, De Paepe A, Speleman F (2002). Accurate normalization of real-time quantitative RT-PCR by geometric averaging of multiple internal control genes. Genome Biol. 18:3(7): R34.
appropriate reference genes for gene expression studies by quantitative real-time polymerase chain reaction in Cucumber. Anal. Biochem. 399(2): 257-261.
Warner JR (1999). The economics of ribosome biosynthesis in yeast. Trends Biochem. Sci. 24(11):437-440.
Wu D, Dong J, Yao Y.J, Zhao W.C. Gao X (2015). Identification and evaluation of endogenous control genes for use in quantitative RT-PCR during wheat (Triticum aestivum L.) grain filling. Genet Mol Res14 (3): 10530-10542
Zhang S, An S, Li Z, Wu F, Yang Q, Liu Y, Cao J, Zhang H, Zhang Q, Liu X (2015a). Identification and validation of reference genes for normalization of gene expression analysis using qRT-PCR in Helicoverpaarmigera (Lepidoptera: Noctuidae). Gene 555(2): 393-402. Zhu X, Li X, Chen W, Chen J, Lu W, Chen L, Fu D (2012). Evaluation of new
reference genes in papaya for accurate transcript normalization under different experimental conditions. PLoS One 7: e44405.
Zhuang H, Fu Y, He W, Wang L, Wei Y (2015b) Selection of appropriate reference genes for quantitative real-time PCR in Oxytropisochrocephala Bunge using transcriptome datasets under abiotic stress treatments. Front Plant Sci. 30(6): 475.
Cite this article as:
Reddy RRN, Manivel P (2019). Evaluation of reference genes for gene expression studies in senna (Cassia angustifolia Vahl.) using quantitative real-time polymerase chain reaction. Acad. J. Med. Plants. 7(7): 169-181
Submit your manuscript at:
SUPPLEMENTARY
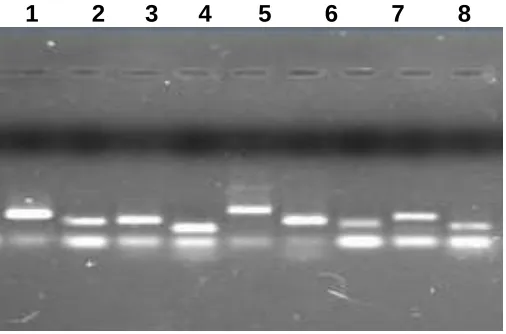
Figure S1: Specificity of qRT-PCR amplicons. (a) Agarose gel electrophoresis showing amplification of a single product of the expected size of reference genes. 1. ca18srRNA, 2. caGAPDH, 3.
caActin2-7, 4. caActin11, 5.caADH, 6. caATPsyn, 7. caTub-β, 8. caEEF1-α and 9. caEEF1- βin variety SONA of Senna.
Figure S2: Amplification of caGAPDH and caActin2-7 in leaf, pod and flowers of Senna. 1.Sona (young leaf), 2. Sona (mature leaf), 3. Sona (young pod), 4. Sona (mature pod), 5. Sona (flower buds), 6. 80 (leaf) 7. DCA-80(flower), 8.DCA-80 (pods), 9.DCA-149 (young leaf), 10. DCA-149(mature leaf), 11. DCA-149 (young pod), 12. DCA-149 (mature pod), 13. DCA-149(flower buds) and 14. Sona (leaf)
1 2 3 4 5 6 7 8
9
S. Fougat, Professor and Head, and Dr. Sushil Kumar, Assistant professor,
Department of Biotechnology, Anand Agricultural University, Anand for extending the
facilities for RT-qPCR work.
Supplementary Figure S2: Amplification of
caGAPDH
and
caActin2-7
in leaf,
pod and flowers of Senna.
1.Sona (young leaf), 2. Sona (mature leaf), 3. Sona
(young pod), 4. Sona (mature pod), 5. Sona (flower buds), 6. 80 (leaf) 7.
DCA-80(flower), 8.DCA-80 (pods
caGAPDH
1 2 3 4 5 6 7 8 9 10 11 12 13 14
caActin2-7