Vol.8 (2018) No. 3
ISSN: 2088-5334
Delay Tolerant Energy Efficient protocol for Inter-BAN
Communication in Mobile Body Area Networks
Aarti Sangwan
#, Partha Pratim Bhattacharya
* #Mody University of Science and Technology, Laxmangarh, Rajasthan, India- 332311 E-mail: [email protected]; [email protected]
Abstract— Body Area Networks (BANs) are used in a range of applications. In these networks, the sensor nodes attached to human body collect data and send it to controller node which in turn sends to a Base Station (BS) located at a remote location. The controller nodes in a BAN can be replaced easily, but when it comes to BANs moving in areas like war, it is hard to replace the batteries frequently. So we need to reduce energy requirement of the nodes to increase the network lifetime. Using mobile sensors is one way to reduce energy and controller nodes can send data to sink easily while performing inter-BAN communication where nodes need to act cooperatively to send data to BS using multi-hop communication. In this paper, we have proposed a new clustering algorithm in which probability of a node to become a Cluster Head (CH) is decided by its geographical location and residual energy of the node. Simulations results show that the proposed protocol is better than the existing EDDEEC protocol regarding the delay, energy efficiency, reliability and network lifetime.
Keywords— energy efficient; delay; mobility; body area networks; throughput.
I. INTRODUCTION
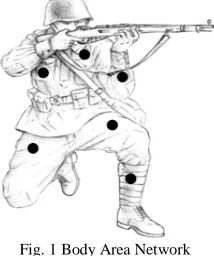
Body Area Networks (BANs) is a significant achievement when it comes to health services. It plays a vital role in not only medical applications but also many non-medical applications like sports, military, and entertainment. A BAN performs two types of communications intra-BAN and inter-BAN communication. Intra-BAN refers to the communication among the sensors placed on human body whereas inter-BAN communication is the communication that occurs between two or more BANs [1]- [3] through their controller nodes. Intra-BAN applications include monitoring the health of a person remotely by implanting or placing sensors on the human body. The sensors sense and send personal data from the human body to a controller node (CN) and send it to the medical servers which are located remotely at a hospital. Fig. 1 shows the architecture of BAN where different sensor nodes depicted by black colored circles are placed on a soldier which measure various physiological parameters from the soldier’s body and sent it to a remote location. Inter-BAN communication can be used for keeping track of the health of soldiers while they are on a battlefield and are in motion. In such cases, the BANs (humans with sensors placed on them) will be scattered in the open field, and the BS or the sink node will not be in range at all times. Also sending data in unique hop fashion will lead to increase in parallel communication and increased
energy. Hence, BANs need to cooperate with each other for sending data to sink by performing multi-hop communication. The BANs act as routers for forwarding data to the sink present at some remote location [4].
Fig. 1 Body Area Network
BANs can be static and dynamic. When it comes to static BANs the BANs remain at fixed positions and the routes to sink are static in such cases, but in case of mobile nodes, the paths need to be decided dynamically. The author in [5] discusses the issues that arise due to node mobility such as energy consumption and packet loss. One way to lower the energy requirement of the nodes is by applying duty cycles that do not require all nodes to stay alive all the time. Another way is by using mobile sink [6].
deployed in the network have equal energies and are static. In reality, in some cases, nodes have different energies. If nodes in a network get their entire energy depleted, they need to be re-energized by adding new nodes. The new nodes added will have energy more than the existing nodes in the network making the network heterogeneous. Also in cases of the areas like battlefield and hospital. the BANs are mobile. So we have proposed a new clustering algorithm for inter-BAN communication which takes into consideration factors like heterogeneity, nodes’ mobility and also uses portable sinks which help in energy reduction in the network. Section I provides a brief introduction to BANs and discusses the related work. The remaining paper has been organized as- Section II includes the radio model, network model used in our work, along with the proposed work. Section III describes the results and section IV provides a conclusion to our work.
A. Literature review
Data can be sent to sinks directly by single hop or using multi-hop whereas data is first sent to the CHs and from the CHs it is sent to sink.
A new reliable Dual Sink approach using Clustering in Body Area Network (DSCB) is proposed in [7]. This clustering approach uses two sinks, and forwarder node is selected using cost function which is calculated using a distance of a node from the sink, transmission power, and its residual energy. This protocol proves to be better regarding network stability, an end to end delay and energy. The author in [8] proposes an energy efficient protocol in which the routing process is controlled by a mobile sink and finds the shortest route between several unequal clusters. This protocol ensures that energy hole problem does not occur in the network. Results show that it is energy efficient keeping the nodes alive for more extended periods of time. A load balanced [9] and position adaptive clustering method was proposed to improve the effectiveness of BAN clustering. The author used the probability distribution method for adequate selection of cluster-head. A time-static [10] and energy effective clustering method was proposed while considering the spatial distribution of mobile nodes. Chang et al. [11] have optimized the energy consumption by using the centralized cluster based routing method. The cluster tree based structure was generated to generate uniform clusters and to achieve balanced energy consumption.
In [12] a clustered routing protocol for BANs has been proposed. A Terahertz band wireless channel is used for assisting healthcare applications. A combined impact of spreading loss, shadowing and molecular absorption attenuation is considered for calculating the complete path loss. Results show that proposed protocol proves better than random forwarding scheme regarding outage probability. The author in [13] has come up with a clustering-based method for fault tolerance in WBANs. Nodes of single WBAN connect to their CH, and these CHs can communicate with other WBANs’ CHs. CHs are connected to Local Gateway which is finally connected to the Healthcare Server. The local sensors and nodes collect Fault-related information are assigned priorities for measuring fault tolerance level of each node. High priority nodes are processed first. The same feature is used by the central
mediator system model that lies between client and server. Load gets distributed over the server cluster thus, preventing a single server from overload.
Authors in [14] have proposed a dynamic CH selection method (DCHSM) for Wireless Sensor Networks in which clusters are generated using a Voronoi diagram. The Voronoi diagram divides the large network into small clusters to ensure maximum coverage. After the generation of clusters, the CHs are selected in two phases. The first phase includes CHs selection based on perceived probability and second phase is based on survival time estimation. DCHSM proves to be energy efficient than LEACH and increases the network lifetime. A new approach to optimize distributed cluster formation and reduce the problem of communication overhead has been proposed in [15]. In this approach, cluster formation is done using Fuzzy logic and optimized route formation towards BS is done using Ant Colony Optimization (ACO).
Authors in [16] have proposed a 3D clustering scheme to extend the network life of WSNs. In the proposed algorithm the deployment area is considered as a 3D grid. A load balanced optimal clusters are constructed at each grid with an initial CH. Energy conservation is done by providing substitute CHs to the energy suffering CHs and distributing the nodes independently among the CHs. In [17] a new energy efficient approach for clustered WSNs is proposed. The BSs are placed at appropriate locations such that the squared Euclidean distances from BSs to sensors are minimized. The concept of Hessian matrix of multivariable calculus is used to identify the BS locations in a way that energy consumption is minimized.
In intra-BAN and inter-BAN communications, the link-quality is affected by body movement and also by the mobility of BANs as a whole. Body movement causes a frequent change in topology of on-body sensors leading to the disconnection of nodes from the Local Processing Unit (LPU). Interference among coexisting BANs and other radio technologies leads to an increase in energy consumption of the nodes. Authors in [18] proposed a distributed network management and cost minimization algorithm which minimizes interference management, dynamic connectivity, and data dissemination costs for opportunistic BANs and is efficient regarding energy.
Authors in [19] propose a novel clustering protocol for Heterogeneous WSNs. The proposed protocol considers super, advanced and normal. Based on population density the network is divided into four sections based on population density of nodes. The selection of CH is done at runtime using hop count, initial energy and residual energy of the nodes. The proposed clustering protocol improves network throughput, lifetime and stability.
nodes is higher, all nodes will have different probabilities depending on their type, but when their energies fall below a threshold value all nodes will have the same probability to be CHs irrespective of their type. This protocol proves to be better in terms of stability, network lifetime. Packets sent to BS are also higher in this protocol as compared to the existing protocols.
Sink mobility helps in reducing the energy consumption of nodes. MIEEPB [22] which is a PEGASIS-Based routing protocol uses the concept of mobile sink in the multi-chain model. In this protocol, the sensor field is divided into four regions which lead to the formation of smaller chains and decreases the load on leader node. The sink follows its path and stays in each region for some fixed amount of time for data collection. A revised MIEEP protocol has been proposed by authors in [23]. Maximization of network lifetime is done by revising the mobile sink position. Results show that proposed protocol uses lower energy than existing MIEEPB protocol.
A clustering algorithm has been proposed for Homogeneous Wireless Sensor Networks in [24]. The nodes are selected as CHs randomly and this criterion of selecting CHs remains same from start to end (till network lifetime). The LEACH algorithm has been optimized in [25] and uses the mobile sink. This protocol reduces energy requirement of the network when the network area is large while preserving all benefits of LEACH protocol.
The authors in [26] proposed a new energy protocol for static Body Area Networks. This approach uses the intersection of nodes to find a path to sink. This protocol runs in three stages- In the first stage, a route is prepared by nodes and the neighbors are informed about it through advertisements, in the second stage the neighboring nodes decide if they have to reply or not, in third stage data is sent from source to sink. This protocol proves better in terms of energy but requires additional hardware, GPS. GPS helps the nodes in knowing their location as well as the location of the sink.
In case of EDEEC, normal nodes have a lower probability to be selected as CHs as compared to advanced and supernodes. Both super and advanced nodes are punished even when these nodes have the same energy as the normal nodes. This causes advanced and supernodes to die early as compared to normal nodes. So these are not the good ways to distribute the energy evenly over the network. EDDEEC has provided a mechanism which makes all nodes have the equal possibility to be a CH when their energies lie below a threshold value but before the threshold value the advanced and supernodes are punished to be CHs. In proposed work, some changes in probability function for CH selection have been made which makes the network much more energy efficient and also all nodes have equal possibility of becoming CHs leading to a reduction in energy consumed by nodes in the network.
II. MATERIAL AND METHOD
A. Radio Model
The Radio Energy Dissipation Model used in our work is the one described in [27]. This model uses two channel models which are based on the distance between transmitter
and receiver [24,28] one is free space (d2 power loss) and the other is multipath fading (d4 power loss). This loss can be reduced by setting the power amplifier appropriately. If the distance between transmitter and receiver is less than do (threshold distance) then free space model is used and if it is greater than do then the multipath model is used.
In order to transmit and receive a w-bit message over a distance, d the energy equations are as follows:
w*Eelec+w*Eamp*d4 if d≥do
=
) , (wd
ETx (1)
w*Eelec+w*Efs*d2 if d< do
w Eelec w
ERx( )= * (2) Here, ETx and ERx are the total energies consumed by the transmitter (Tx) and receiver (Rx) to send data over a distance. Elec is the energy required by the transmitter or receiver Rx hardware for sending and receiving per bit of data. The value of threshold distance, do used in (1) is given by:
Eamp Efs
do= (3)
B. Network Model
A sensor network with n BANs randomly deployed in an M x M region is shown in Fig. 2. The network follows a clustering hierarchy. Instead of performing single hop communication between the sensors and base station clusters are formed. Each cluster has a cluster head which collects data from the cluster members (sensor nodes) and sends it to the base station. We have taken a three-level heterogeneous network where the nodes have different initial energies. The three types of sensor nodes that we have considered are n*(1-m) normal nodes which have initial energy Eo, n*m*mo supernodes which have initial energy Eo*(1+b) and n*m*(1-mo) advanced nodes which have initial energy Eo*(1+a), where Eo is the initial energy [21].
For such heterogeneous network the initial energy is given by [20]:
) 1 ( * ) 1 ( * * ) 1 ( * * * * * ) 1 (
* m Eo n m mo Eo b n m mo Eo a
n
Et= − + + + − +
)) * ( * ) 1 (( *
*Eo m a mo b
n + +
= (4) Hence, in a three-level heterogeneous network, the total energy becomes ((1+m)*(a+mo*b) times the energy of a homogeneous network having n nodes. We have taken mo=0.4,m=0.5,a=1.5,b=3.
Fig. 2 Architecture of Inter-BAN communication
We are considering only the controller nodes of all the individual BANs here and perform communication (inter BAN communication) between them as in a BAN the nodes placed on human body sense and send data to the controller node which in turn send data to the BS.
C. Proposed work
The clustering is the core phenomenon applied in this work to achieve segmented communication separately for different geographical regions. In this architecture, the network is divided into two smaller regions and the information of each region is collected by the nearest sink. These controllers finally deliver the sensitive information to the base station.
The proposed algorithm is divided into four mains parts: division of the network into two virtual regions, deciding the probabilities of nodes and choosing the cluster head and choosing the nearest sink for data transmission
.
In our work since we are performing inter-BAN communication so we are considering only controller nodes of all individual BANs. So here the term nodes will refer to the controller nodes. Since one BAN usually has one controller node so we have used the term BAN, controller node and node interchangeably at times as one BAN means one controller node.
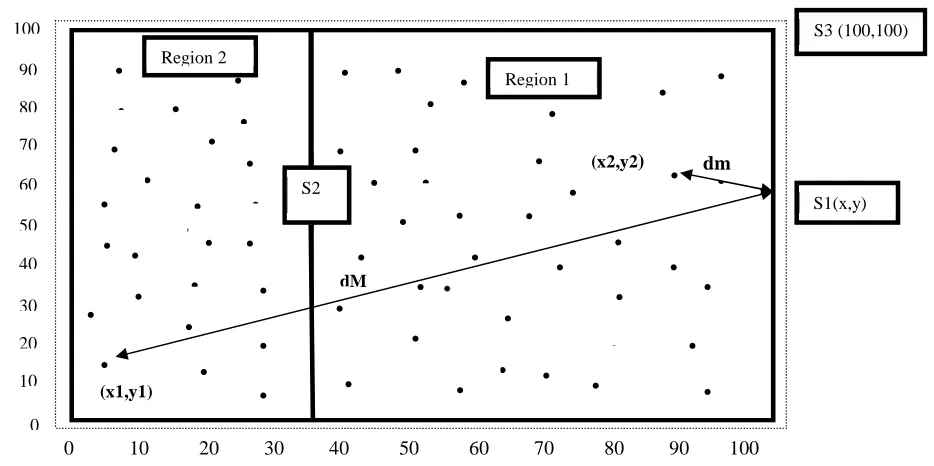
1) Network Division:
The network is divided into two virtual regions Region 1 and Region 2 as shown in Fig. 3. We have used two mobile sinks. One sink S1 moves along the boundary of the network field in which BANs are present whereas the second sink S2 will keep on moving randomly within the network field along with the BANs. Both sinks stay at each location for a fixed time to take data from the nodes. BANs are checked against their geographic location and their distance, di from Sink 1, S1 (x, y) is calculated using equation (5). If for a node i at location (x1, y1), di will be -
(
) (
2)
2 11 y y
x x
di= − + − (5)
After calculating the distance of each BAN’s controller from the base station the minimum and maximum values of among all these distances are calculated.
) ... 4 , 3 , 2 , 1
max(d d d d dn
dM= (6) )
... 4 , 3 , 2 , 1
min(d d d d dn
dm= (7) dM and dm represent the maximum and minimum distance among all the distances calculated as per equations (6) and (7).
Tdis=(dm+dM)/3 (8) CN of each BAN Cluster Head
Fig. 3 Cluster Head Selection Method
.
.
.
.
.
.
.
.
.
.
.
.
.
.
.
.
.
.
.
.
.
.
.
.
.
.
.
20
10
0 10 20 30 40 50 60 70 80 90 100 0
30 40 50 60 70 80 90 100
.
.
.
.
.
.
.
.
.
.
.
.
.
.
.
.
.
.
.
.
.
.
.
.
.
.
.
.
.
.
.
.
.
.
.
.
.
.
.
.
.
.
.
.
.
.
.
.
.
.
.
.
.
.
.
dM
dm
(x1,y1)
(x2,y2)
S
S1 (x,y)
S2
.
.
.
.
Region 1 Region 2
S2
Fig. 4 Flowchart of EDDEEC and proposed work Start
Calculate alivenodes
Calculate Ei and Er of every alivenode
Calculate average energy of the network at
present round
Receivin g energy
of node>Ta
Node has not been a
CH in previous
rounds Calculate probability of each node to become CH
for normal, super and advanced node
and then calculate itsprobability based on specific
type Modify
probability of node based on
Tabs
Node is a cluster member and sends appropriate datato
its CH Node belongs to set
G, G is set of nodes eligible to become CH and node chose arandom number between 0 and 1
Random Number chosen is less
than threshold
Node is CH for
currentround End
Calculate maximum and
minimum distance of nodes
fromBS
Threshold Distance >dis tance ofnode
fromS1
p(i)=(P/(1-P*(r*mod(1,P))))*(S(i).E/di))*(dm)^2;
p(i)=(P/(1-P*(r*mod(1,P))))*(S(i).E/di))*(dm)^4;
Flowchart of EDDEEC and proposed work
EDDEEC Proposed
Tdis is the threshold distance by which the network is separated into two layers.
:
Tdis
di≤ nodes fall in region 1
di>Tdis: nodes lie in region 2 (9) If the distance of a BAN from the base station is less than equal to the threshold distance then the BAN will fall in region 1, and if it is higher than Tdis then BAN will fall in region 2, and as per the regions, the probability of nodes to be selected as cluster heads will be decided.
2) Probabilities Selection:
In the existing work, the probabilities are chosen as per the absolute residual energy of a particular node [21] and nodes will have different probabilities as per their type but here the probabilities are chosen as per the two layers into which the entire network has been divided. The probabilities for cluster head selection in our proposed work are given as under:
(
(
( )
)
)
( )
2 * ). ( * , 1 mod * *1 di dm
E i S P r P P − = ) (i
p for all nodes if (
(
di≤Tdis)
(10)
(
(
( )
)
)
( )
4 * ). ( * , 1 mod * *1 di dm
E i S P r P P −
for all nodes if (
(
di>Tdis)
Where S(i).E is the residual energy of a node, dm is the minimum distance among distance of all sensors from the base station, and D(i) is the distance of a node from the base station. P is the optimum probability of a node to become CH, r is round number. Nodes nearer to sink1 will have higher possibility to get selected as CH.
So this can lead to energy hole problems in the network making the nodes near S1 run out of energy quickly, and no path is formed for far away nodes creating a hole in the network. For that, we have used mobile sinks, so that same nodes do not get forced to become CHs again and again.
3) Cluster Head Selection:
The LEACH algorithm [24] is iterative, and each iteration is called a round. At the beginning of every round, a random number is generated by each node and the basis of this random number the decision is taken whether the node will be selected as CH or not. This random number is checked against a threshold value T(ch) and if the value of this random number is less than T(ch) then the node becomes the CH for that particular round. T(ch) is calculated as:
(
)
− − P P r P P 1 mod ) 1if ch∈G
=
) (ch
T (11)
0 otherwise
Here r is the present round number, p the desired percentage of CHs and the G is the set of nodes not selected as CHs in last 1/p rounds.
In the proposed work we have three types of nodes. Each node having different initial energies and their probabilities are different based on their distance from the BS. The threshold calculated for these nodes will also be different in this case and will be calculated as:
=
) (chi
T (12)
Where G’ is set of nodes lying within Tdis and have not become CH in last 1/p rounds and G” represents set of nodes lying beyond Tdis and have not become CH in last 1/p rounds.
4) Data Transmission:
The mobile sinks spend enough time at one place so that they can collect data from the CHs. Nodes/CHs will measure their distance from the sink nodes S1 and S2. Data will be sent to the nearest CH. If the distance of a node from the CH is higher than the distance of the node from sink, then that node will send data directly to the sink instead of sending it to the CH. Both sinks after collecting data sent it to BS (Static sink S3) located at one end of the network field as shown in Fig 3. Fig. 4 shows the flow diagram of the proposed work.
III.RESULTS AND DISCUSSION
The performance of our proposed protocol is evaluated using MATLAB. We have considered 100 BANs distributed randomly in a 100m x 100m field randomly. All the nodes are mobile in nature, and their position changes continuously. The dual sink approach is used, and both sinks are mobile. The proposed protocol has been compared with existing EDDEEC protocol [21]. The parameters used for simulation are shown in Table 1. The simulation has been done for checking the protocol for scalability by taking in account different number of nodes in the network as well as the change in network size.
The parameters used to evaluate the performance of proposed clustering protocol are:
A number of alive nodes: This refers to the number of nodes which have not depleted all their energy.
Throughput: Throughput is taken regarding the number of packets sent to the BS by the controller nodes either via cluster heads or directly.
Residual energy: Whenever communication occurs between the nodes then some amount of energy is consumed in transmitting/receiving data along with the energy used by the sensor node circuitry.
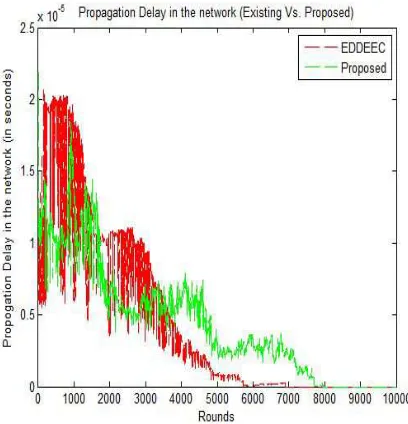
Propagation delay: This refers to the time taken by signal to travel from the transmitter to receiver.
(
)
− − pi pi r pi pi 1 mod1 if ch∈G'
(
)
− − pi pi r pi pi 1 mod1 if ch∈G" (12)
TABLEI SIMULATION PARAMETERS
Parameters Value Network Field Area (100,100) Number of nodes 100
Eo .5 J
Message Size 4000 Bits
Eelec 50 nJ/bit
Efs 10 nJ/bit/m2
Eamp 0.0013 pJ/bit/m4
EDA 5 nJ/bit/signal
do 87 m
P 0.1
Static Sink (BS) One (100,100) Dynamic Sinks 2
The above metrics help us in knowing about the stability period and network lifetime of the network. Stability period means the round at which the first node of the network dies. Higher the stability period more the network is stable. Network lifetime refers to some rounds from the start of the network till all nodes of the network die.
Fig. 5 Comparison of Alive Nodes in the network
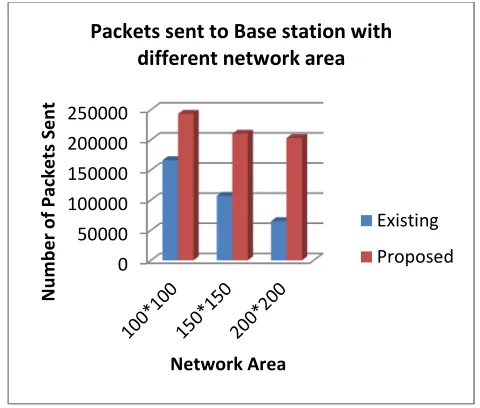
Fig. 6 Comparison of Packets sent to BS in the network
Fig. 7 Comparison of Propagation Delay in network
Fig. 8 Comparison of Residual Energy of the network
Fig. 9 Percentage of dead nodes vs number of rounds
0 2000 4000 6000 8000
R
o
u
n
d
s
Nodes dead
Percentage of nodes dead at
different rounds
The first node of EDDEEC dies at 810 and all nodes die at 6035 round whereas in proposed work first node dies at 1674 and the last node dies at 8004 round as shown in Fig. 5. The number of packets sent to BS is more in our proposed work as compared to the existing work as depicted in Fig. 6. We can see from Fig. 7 that delay is mostly low in our work except for a few places (between rounds 1000 to 2000 and after round 3000). The delay in our work is more at these places as the number of alive nodes in our work is more in our work during these intervals as shown in Fig. 9, whereas the nodes in existing work die out quickly. 75% of nodes in existing work die before 2000 rounds. Delay of the network is a cumulative result of the sum of the delay of all the individual nodes (per round). So greater will be the alive nodes higher will be the path loss. Higher the residual energy of nodes the greater will the time for which the network lasts. Fig. 8 shows that the total remaining energy of the network is higher in proposed work as compared to EDDEEC. The results clearly show that proposed protocol is better than EDDEEC in terms of stability, network lifetime, throughput, propagation delay and residual energy.
Scalability
The performance of the proposed protocol has also been evaluated against the increase and decrease of nodes in the network and also against the increase in the network area.
A. Change in number of nodes
Sometimes we need to add new nodes to a network or remove nodes which run out of battery. Therefore in order to check whether any addition or removal of nodes from the network has any effect on the performance or not we have taken 50, 70, 150 and 200 nodes in the network area (100m*100m).
1) Residual energy of network with a different number of controller nodes in the network: On checking the residual
energy of the network for both existing and proposed work at different rounds the graph shown in Fig. 10 clearly shows that in each case the network’s residual energy for the proposed protocol is higher than that of EDDEEC in all cases for the 3000th round.
Fig. 10 Residual Energy comparison for 50, 70,100, 150 and 200 BANs
2) Network lifetime with a different number of controller nodes in the network: To analyze the network lifetime we
have calculated the number of nodes which are alive at round 3000 when there are 50, 70, 100, 150 and 200 nodes in the network. A node is considered dead when the energy of the nodes becomes zero, and it can no longer receive or send data in the network anymore. Fig. 11 shows that the number of nodes which are alive is higher in proposed work hence it improves the network lifetime and is better than EDDEEC.
Fig. 11 Alive Nodes comparison for 50, 70,100, 150 and 200 BANs
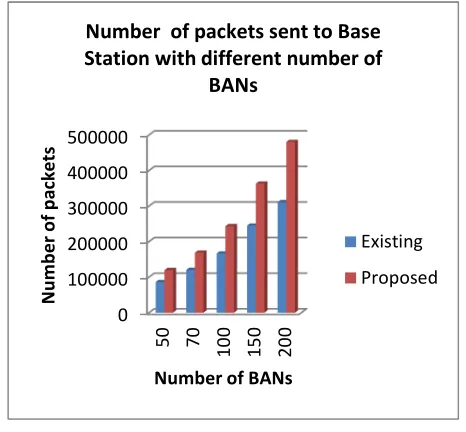
3) Packets sent to Base station in the network with a different number of controller nodes in the network: The
number of packets sent to Base Station is considerably higher in our work as compared to EDDEEC as shown in Fig. 12. With the increase in a number of nodes, the number of packets transmitted gets increased. Higher the number of packets sent higher will be the throughput of the network. Thus the proposed work is better regarding throughput than the existing protocol at round 3000.
Fig. 12 Number of packets sent to BS comparison for 50, 70,100, 150 and 200 BANs
0 20 40 60 80
50 70 100 150 200
R
e
si
d
u
al
E
n
e
rg
y
(
in
J
o
u
le
)
Number of BANs
Residual Energy of network with
different number of BANs
Existing Proposed
0 20 40 60 80 100
50 70 100 150 200
N
u
m
b
e
r
o
f
al
iv
e
n
o
d
e
s
Number of BANs
Number of alive nodes with different
number of BANs
Existing Proposed
0 100000 200000 300000 400000 500000
5
0
7
0
1
0
0
1
5
0
2
0
0
N
u
m
b
e
r
o
f
p
ac
k
e
ts
Number of BANs
Number of packets sent to Base
Station with different number of
BANs
4) Propagation Delay in the network with a different number of controller nodes in the network: Delay follows a
similar graph in all cases as shown in Fig. 7. Since delay per round (cumulative delay) is not stable and keeps on increasing and decreasing with the number of alive nodes in the network. So this cannot be used as a stable parameter for comparison and we are taking the total cumulative delay of the network for both existing and proposed protocol until round 3000. It can be seen from Fig. 13 that proposed work has the lower value of total delay till round 3000 as compared to the existing protocol.
Fig. 13 Propagation Delay comparison for 50, 70,100, 150 and 200 BANs
B. Change in Network Area
The size of network area is changed as (100x100) meter, (150x150) meter, (200x200) meter and the value of alive nodes, residual energy, packets sent to BS, path loss and delay is calculated in all cases for round 3000. The number of BANs taken here is 100.
1) Residual energy of the network with different network size: Fig. 14 depicts that energy consumption in EDDEEC is
more as compared to proposed algorithm. Thus our proposed protocol works better even if the network size changes.
Fig. 14 Residual Energy comparison for network areas 100m*100m, 150m*150m, and 200m*200m
2) Network lifetime with different network size: We can
see from Fig. 15 that with the increase in network area the number of alive nodes in the network reduces as compared to nodes placed in network area 100m*100m. Also, the number of existing nodes in existing work is less. Less than 10 nodes are alive at round 3000 in the existing work when network area is increased whereas the increase in network area seems to have very less effect on the proposed work. Alive nodes remain higher than EDDEEC.
Fig. 15 Number of alive BANs comparison for network areas 100m*100m, 150m*150m, and 200m*200m
3) Packets sent to BS different network size: Fig. 16
depicts that with the increase in network area the number of packets sent to BS decrease by a marginal amount every time. Though the number of packets sent to BS is less too for proposed with an increase in network size but still it is higher than the existing work. Greater the number of packets sent to BS greater will be the throughput. Hence, proposed protocol manages to maintain higher throughput even when network area changes.
Fig. 16 Packets Sent to BS comparison for network areas 100m*100m, 150m*150m and 200m*200m
0 0,02 0,04 0,06 0,08
50 70 100 150 200
D
e
lay
(
in
s
e
co
n
d
s)
Total Delay in Network with Different
number of BANs
Existing Proposed
0 10 20 30 40
R
e
si
d
u
al
E
n
e
rg
y
(
in
J
o
u
le
)
Network Area
Total Residual Energy of network with
different network area
Existing Proposed
0 10 20 30 40 50
N
u
m
b
e
r
o
f
C
N
s
al
iv
e
Network Area
Number of alive CNs with different
network area
Existing Proposed
0 50000 100000 150000 200000 250000
N
u
m
b
e
r
o
f
P
ac
k
e
ts
S
e
n
t
Network Area
Packets sent to Base station with
different network area
4) Propagation Delay different network size: We can see
in Fig. 17 that the total delay of network when area is 100m*100m and 150m*150m is low in proposed work. However, it increases when the area gets bigger this is due to the reason that till 3000 when area is 100m*100m the alive nodes in EDDEEC and proposed work are near about same. Nevertheless, when area is 150m* 150m then till 3000 rounds 9 nodes are alive in existing work as can be seen in Fig. 15 but in proposed work, the number of alive nodes is 49. So greater is the number of alive greater is the cumulative delay of all the nodes.
Fig. 17 Propagation Delay comparison for network areas 100m*100m, 150m*150m and 200m*200m
IV.CONCLUSION
In this paper, we have investigated the performance of Body Area Networks randomly moving in an open field based on residual energy, network lifetime, packets sent to the base station, propagation delay and path loss in two cases: by taking a different number of nodes in the network and by changing the network area. We have used two mobile sinks for efficient energy utilization in the network and also to make sure that the network is free from energy hole problems which arise when nodes near the BS die out, and the remaining nodes find no way to contact the BS through other nodes. Since the BS is mobile all nodes can easily transmit their data. Further, the heterogeneity of nodes has also been taken into consideration. The proposed protocol is an adaptive clustering protocol which changes the nodes’ probabilities to become CH dynamically based on the geographical location concerning one of the sinks and gives equal opportunity to all nodes to become CHs. The simulation results show that the proposed work proves to be better than the existing EDDEEC protocol based on the performance metrics that have been taken in both cases. Data in BANs is crucial hence this work can further be extended by securing it using some suitable cryptographic algorithm to save the network from attacks.
REFERENCES
[1] H. Javdani, H. Kashanian, “ Internet of things in medical applications with a service-oriented and security approach: a survey,” Health Technology. 2017. 1-12.
[2] M. Hämäläinen, X. Li, “Recent Advances in Body Area Network Technology and Applications,” International Journal of Wireless Information Networks. 2017, vol. 24, no. 2, pp. 63-64.
[3] M. Salayma , A. Al-Dubai , I. Romdhani, and Y. Nasser, “Wireless body area network (WBAN): a survey on reliability, fault tolerance, and technologies coexistence,” ACM Computing Surveys (CSUR) 50:3, 2017.
[4] A. Ali, F. A. Khan, “Energy-efficient cluster-based security mechanism for intra-WBAN and inter-WBAN communications for healthcare applications” EURASIP Journal on Wireless Communication and Networking, December 2013, 2013:216. [5] S AB Awwad, C. K. Ng, N. K. Noordin, and M. F. A. Rasid.
"Cluster-based routing protocol for mobile nodes in a wireless sensor network." Wireless Personal Communications 61, no. 2 (2011): 251-281.
[6] D. V. Jose, G. Sadashivappa, “Mobile Sink Assisted Energy Efficient Routing Algorithm for Wireless Sensor Networks,” World of Computer Science and Information Technology Journal (WCSIT), Vol. 5, No. 2, pp. 16-22, 2015.
[7] Z. Ullah, I. Ahmed, K. Razzaq, M. K. Naseer and N. Ahmed, “DSCB: Dual sink approach using clustering in body area network,” Peer-to-Peer Networking and Applications, pp. 1–14, Aug 2017. [8] S. Pr. Nayak, S.C. Rai and S. Pradhan, “A Multi-clustering Approach
to Achieve Energy Efficiency Using Mobile Sink in WSN,” Computation Intelligence in Data Mining, vol. 556, pp. 793-801, May 2017.
[9] D. Yadav and A. Tripathi, "Load balancing and position based adaptive clustering scheme for effective data communication in WBAN healthcare monitoring systems," Proc. IEEE 11th International Conference on Intelligent Systems and Control (ISCO), Coimbatore, Jan. 2017, pp. 302-305.
[10] T. Mukhtar and S. Chaudhary, "Energy-efficient cluster formation and secure data outsourcing using TEOSCC and ECDH-IBT technique in WBAN," in Proc. IEEE International Conference on Wireless Communications, Signal Processing and Networking (WiSPNET), Chennai, March 2016, pp. 596-602.
[11] Jau-Yang Chang and Pei-Hao Ju, “An energy-saving routing architecture with a uniform clustering algorithm for wireless body sensor networks,” Future Generation Computer Systems, vol. 35, June 2014, pp. 128-140.
[12] F. Afsana, N. Jahan, and M. S. Kaiser, “An energy-efficient cluster-based forwarding scheme for body area network using nano-scale electromagnetic communication,” in Proc IEEE International WIE Conference on Electrical and Computer Engineering (WIECON-ECE), Dhaka. 2015, p. 491-494.
[13] S. Saha and D. K. Anvekar, “Use of Central Mediator System and Cluster Head in Maintaining Fault Tolerance and Balancing the Load of Multithreaded Wireless Body Area Network (MWBAN) Data,” Indian Journal of Science and Technology. 2016; 9, 1-4.
[14] A. John, A. Rajput, and K V. Babu, “Dynamic Cluster Head Selection in Wireless Sensor Network for the Internet of Things Applications,” in Proc IEEE International Conference on Innovations in Electrical, Electronics, Instrumentation and Media Technology (ICIEEIMT 17), Coimbatore, India, 2017.
[15] M. Tamene and K. Nageswara, “Intelligent clustering protocol design and optimization in wireless sensor networks,” International Journal of Communication Networks and Distributed Systems, vol. 20, 2018, pp. 190-213.
[16] J. Naveen, P. J. A. Alphonse, Sivaraj Chinnasamy, “3D grid clustering scheme for wireless sensor networks”, The Journal of Supercomputing, 2018, pp. 1-13.
[17] G. Ramamurthy, “Energy Efficient Design of Wireless Sensor Network: Clustering,” in Proc International Conference on Recent
Trends in Engineering Sciences, 2018.
[18] A. Samanta and S. Misra, “Energy-Efficient and Distributed Network Management Cost Minimization in Opportunistic Wireless Body Area Networks,” IEEE Transactions on Mobile Computing, vol. 17, Feb 2018, pp. 376-389.
[19] S. V. Purkar and R. S. Deshpande, “Energy Efficient Clustering Protocol to Enhance Performance of Heterogeneous Wireless Sensor Network: EECPEP-HWSN,” Journal of Computer Networks and Communications, Volume 2018.
[20] P. Saini and A. K. Sharma, “E-DEEC-enhanced distributed energy efficient clustering scheme for heterogeneous WSN,” in Proc 1stInternational Conference on Parallel, Distributed and Grid Computing (PDGC-2010), Solan, India, Oct. 2010.
0 0,005 0,01 0,015 0,02 0,025 0,03 0,035 0,04
D
e
lay
(
in
s
e
co
n
d
s)
Total Delay in network with different
network area
[21] N. Javaid, M. B. Rasheed, M. Imran, M. Guizani, Z. A. Khan, T. A. Alghamdi and M. Ilahi, “An energy-efficient distributed clustering algorithm for heterogeneous WSNs,” EURASIP Journal on Wireless Communications and Networking (2015) 2015:151.
[22] M. R. Jafri, N. Javaid, A. Javaid, Z. A. Khan, “Maximizing the lifetime of multi-chain pegasis using sink mobility” World Applied Sciences Journal, vol. 21, no. 9, pp. 1283-1289, March 2013. [23] D. Sethi, P. P. Bhattacharya, “Revised Multi-Chain PEGASIS for
Wireless Sensor Networks,” International Journal of Sensors, Wireless Communications and Control, vol.6, Issue 1, 2016, pp. 12-17.
[24] W. R. Heinzelman, A. P. Chandrakasan, H. Balakrishnan, “Energy-efficient communication protocol for wireless microsensor networks,” in Proc 33rd Hawaii International Conference on System
Sciences (HICSS-33), Maui, HI, USA, Jan 2000.
[25] S. Mottaghi and M. R. Zahabi. “Optimizing LEACH clustering algorithm with mobile sink and rendezvous nodes”,
AEU-International Journal of Electronics and Communications 69, 2 (2015): 507-514.
[26] K. Kim, Ick-Soo Lee, M. Yoon, J. Kim, H. Lee, and K. Han. "An efficient routing protocol based on position information in mobile wireless body area sensor networks," in Proc First International Conference on Networks and Communications (NETCOM'09),
Chennai, India, pp. 396-399, Dec 2009.
[27] F. M. Al-Turjman, H. S. Hassanein, and M. Ibnkahla. “Quantifying connectivity in wireless sensor networks with grid-based deployments.” Journal of Network and Computer Applications, vol. 36, no. 1 (2013): 368-377.