58
A Comparative Study of Rural Entrepreneurial Challenges: Towards Rural Economic Development and a Policy Framework
Albert Tchey Agbenyegah
Durban University of Technology (DUT), Riverside Campus, Pietermaritzburg, Durban South Africa [email protected]
Abstract: The primary purpose of this rural study was to compare the challenges that impede successful operations of entrepreneurial activities and small businesses. Through quantitative design, a seven-point Likert-scale questionnaire was utilized to gather primary data. Two sampling techniques, namely simple random and purposive, were applied to select the research participants. Based on a Likert spectrum, 267 questionnaires were administered to SME owners by the researcher, assisted by two research trainees. These questionnaires were ranked from (1) strongly disagree to (7) strongly agree. Two main questions, which provided guidance to this study, were certified reliable by the Cronbach alpha coefficient of 0.768 and 0.976. Data analysis was possible through the descriptive and inferential tools supported by the independent t-test, Pearson’s chi-square test, and cross-tabulation. The final outcomes demonstrate higher levels of challenges in the Frances Baard (FB) District than in the John Taolo Gaetsewe (JTG) District. This implies that owner-managers of small businesses in the FB District experienced more challenges in operating their businesses. The study recommends SME Policy Framework (SPF) training and intensifying the existing processes of monitoring after training to justify the owner-managers’ moral commitments.
Keywords: Entrepreneurial activities, SME owners, John Taolo Gaetsewe District, Frances Baard District.
1. Introduction
Academic literature suggests strong and positive association between entrepreneurial activities and economic fortunes (Acs, Desai and Hessels 2008; Bosma and Levie 2010). Through successful entrepreneurial activities and SME operations, rural economies are diversified to a lesser dependency on a mono-industrial base (Bryden and Hart 2005). Furthermore, other studies revealed that entrepreneurial activities are perceived worldwide to strongly influence economic potential and provide job opportunities (Marshall and Samal 2006). Due to its importance, the South African government has provided assistance over the years, especially to SMEs in rural areas (Fatoki and Smit 2011). However, scientific evidence from rural areas suggests there is growing concern about the rapid decline in entrepreneurial activities (Sternberg 2009). Besides, SMEs in South Africa lack the potential to expand their operations from the survival stage to become large entities (Fatoki 2014). Simply put, across the country, the SME sector was unable to proceed from the stage of survival to the status of maturity (Fatoki and Garwe 2010). In the past, several researchers were of the view that in South Africa up to 75% of newly established SMEs were unable to grow into operational businesses of sustained substance (Fatoki and Garwe 2010). According to Adeniran and Johnston (2011), SMEs failure has increased to between 70% and 80% in the country. The inability of SMEs in South Africa to attain the level of maturity has reached alarming proportions; thus a major concern for all spheres of government.
59
business success. (Frynas and Mellahi 2015) describe globalisation as a combination of economic, political, as well as cultural shift events, which bring into the business focus the political interconnection among nations.
Through globalisation, various form of world business activities become integrated in line with economics, culture industries and the global market, besides policy decision-making. SMEs, as part of entrepreneurial activities, function on a small scale due to funding and other business related constraints. Operating businesses in the global arena creates fierce competition among small and “big businesses” for the same markets and resources opportunities (Cronje et al., 2000). Within the global environment, “big businesses” and SMEs share and provide products to similar markets and under similar marketing conditions. Due to a lack of resources and given the role players on the global stages, entrepreneurial activities and operating SMEs face challenges. A study by (April 2005) found that the general lack of managerial skills adds to other factors that contribute to business failures. However, the traits of different cultural practices and principles drive entrepreneurial activities (Venter, Urban and Rwigema 2008), which fuel the uncertainties of SMEs, and is largely influenced by cultural events. This study was conducted in rural settings, as such cultural events across communities are likely to influence SME operations in terms of the values, knowledge and experiences of individuals (Yew Wong 2005). Although it was not easy to make predictions regarding how and when SMEs will survive or fail, comparing the entrepreneurial challenges is likely to provide policy experts with answers to make credible and sustainable policy decisions.
This study is designed to identify some of the challenges that undermine the success of SME in certain business climates so as to shed light on the phenomena. Through this study, the author planned to explore four areas of entrepreneurial challenges to make comparisons in rural districts. The most cited challenges, according to the literature, include business and operational (BOP), specific (SCs), personal (PCs), and typical challenges (TCs). This empirical study sought to identify the most significant challenges that impact on SMEs operations in two rural districts of South Africa, namely the Frances Baard (FB) and John Taolo Gaetsewe (JTG) districts. In line with the objectives of comparing entrepreneurial challenges, the study could as well add significant insights to existing literature by providing answers to some of the difficult questions relating to the growing entrepreneurship failures. Moreover, the cultural beliefs of communities contribute to business failures. For the simple reason that this empirical study was conducted in two rural settings, the concepts “SMEs”, “entrepreneurial activities” and “small businesses” are used interchangeably as mostly applied in the South African context (Love and Roper 2015) to mean rural businesses that are capable of employing not more than 50 local individuals with existing business assets valued below one million rand. Research by Le Fleur et al. (2018) indicated that countrywide SMEs are characterised as unregistered entities with less than 250 employees.
60
2. Theoretical BackgroundThe central precept of entrepreneurship as a concept is the profit-making motive that encompasses high-level risks based on the personal willingness to embark on unceasing future innovation. Further extant literature add that through entrepreneurship, individuals are encouraged to pursue more innovative paths to provide more risky decisions for entrepreneurial gains (Petuskiene and Glinskiene, 2011). Entrepreneurship is a concept of various processes that seeks to create values through the integrating of scarce resources with the aim to explore opportunities (Stevenson, Roberts and Grousbeck 1989). Jones (1999) posits that through entrepreneurship, individuals are able to recognise opportunities that satisfy their expectations. Wennekers and Thurik (1999) explained entrepreneurship in simple terms – a concept that creates economic potential, combines new product markets, and establishes fresh markets in a climate of uncertainty and barriers. It is a process that is influenced by the existing economic and physical environment, besides other social variables (Stathopoulou, Psaltopoulos and Skuras 2004). According to Barth, Yago and Zeidman (2006), small businesses are stimulated through entrepreneurial activities for job opportunities, as well as to create the necessary avenues to encourage self-employment. Various researchers have studied the challenges of small businesses and entrepreneurial activities in developed and developing countries (Klapper, Laeven and Rajan 2004; Lan and Wu 2010; Fatoki and Garwe 2010; Nawaser et al., 2011; Singh Sandhu, Fahmi Sidique and Riaz 2011; Zamberi Ahmad and Xavier 2012). The survival of SMEs in developing countries is severely threatened by a series of hurdles that are known to be relates to operational, as well as management, issues.
Past evidence indicated barriers such as the lack of funding and opportunities, inadequate business and technical owner-manager acumen, in addition to the inability to provide credible records for planning purposes (Dabson 2001; Baron and Shane 2007; Schwartz and Hornych 2010; Saxena 2012). Similar studies confirmed that small businesses in South Africa and elsewhere failed due to certain challenges, including the lack of technical and management knowledge to successfully manage them (Omerzel and Antoncic 2008; Mbonyane and Ladzani 2011). It was found that more than 70% of entrepreneurial activities and SME operations failed within the first three years (ocBiyase 2009; Fatoki and Smit 2011). According to Martinsons (2008); (Okpara 2011), one of the primary reasons for failed small business operations was due to the inability by authorities to formulate proper macro-economic regulatory and policy frameworks to guide SME owners in developing countries. Moreover, the inability of banks to provide adequate funding, and the lack of education and training contribute to the failure of small businesses (Cassar 2004; Herrington, Kew and Kew 2009; Fatoki and Garwe 2010). Other researchers suggest that rural SME owners are unable to understand the procedures of accessing bank loans and other related information. According to (Agyapong, Agyapong and Darfor 2011) and (Storey 1994), small scale business owners are not closely assessed by financial houses; thus, most of these businesses overstate their businesses viability to access finance.
61
Conceptualising Business Failure: Business failures, no matter the size or scope, mean different things to researchers and academics depending on the type of business, failure takes place in various forms. SMEs fail if the owner is unable to attain the set revenue standards or growing expenditure levels, which result in insolvency (Shepherd, 2005). This implies incompetence to pursue economic operations due to certain limitations. In the past several researchers have provided extensive evidence in entrepreneurship literature on business failures (Hussain 2003; Ucbasaran et al., 2010; Cope 2011; Mantere et al., 2013; Jenkins, Wiklund and Brundin 2014). Extant literature further asserts that business failures occur at different stages, such as at the design, staff and facility, or customer stages (Cronje et al., 2000). According to Venter, Urban and Rwigema (2008), business failure can be due to other external variables, such as the inability to mobilise resources and the lack of active participation in the consumption patterns of products and services. Other external causes of business failures, based on the views of several researchers, are factors relating to industries, the environment, interest rates and industry recession (Ooghe and De Prijcker 2008; Holt 2013; Frynas and Mellahi 2015).
Conceptual Framework: This study sought to compare the entrepreneurial challenges of two rural districts. To accomplish the stated objective, the relevant entrepreneurial challenges were conceptualised into a framework. These challenges were business and operational (BOP), specific (SCs), personal (PCs) and typical (TCs). BOP challenges in this study entailed difficulties in funding, fluctuating interest rates, issues of collateral, lack of SME support, lack of resources, and scarcity of business opportunities. SCs involved location problems, infrastructure difficulties and the inability to apply technology, supplier problems, inadequate cash flow, and older employees. PCs in this study were defined as the fear of failure, lack of confidence, education and training, sub-standard competency, scarce information, unable to plan, family pressures and lack of financial knowledge. TCs entailed administration problems, legislative flaws, an over-competitive climate, growing crime levels, distance market conditions, the inability to retain a younger population, and high business costs. These challenges were described and identified throughout the theoretical framework above as SME challenges that impede success. Furthermore, these challenges formed the core of secondary data that the author used with options to gather data from SME owner across the two rural districts of JTG and FB.
Formulated Hypotheses: Drawing from various inter-disciplinary literatures and in line with stated objectives, the author utilised null and alternate hypotheses to determine the significant differences between the dependent and independent variables in the study areas as indicated in the conceptual framework above. Regarding the size of the District, the JTG District is the second smallest district in the Northern Cape Province and covers about 6% of the Province’s geographic area, which translates into 16% of the Province’s entire population. The District provides employment to 4.67% of the population through agricultural activities. Two primary reasons underpinned the author’s decision to utilise these hypotheses. These reasons entail validation of relevant scientific theories and to make logical assessments regarding the dependent and independent variables. Below are the formulated hypotheses that steered this empirical study:
H10: There is no significant difference between BOP challenges in terms of the FB and the JTG districts.
H1A: There is a significant difference between BOP challenges in terms of the FB and the JTG districts.
H20: There is no significant difference between SCs in terms of the FB and the JTG districts.
H2A: There is a significant difference between SCs in terms of the FB and the JTG districts.
H30: There is no significant difference between PCs in terms of the FB and the JTG districts.
H3A: There is a significant difference between PCs in terms of the FB and the John JTG districts.
H40: There is no significant difference between TCs in terms of the FB and the JTG districts.
H4A: There is a significant difference between TCs in terms of the FB the JTG districts.
3. Research Method
62
which were to be tested. During the process, the independence of the author was critical to attain the stated objectives.
Design Approach and Sampling: The primary aim of this study was to compare the significant differences between the dependent and independent variables in two rural districts, namely the Frances Baard (FB) District and the John Taolo Gaetsewe (JTG) District of the Northern Cape Province of South Africa. This study was quantitatively designed in order to allow easy generalisation of its outcomes to benefit other rural districts country-wide. The author employed a cross-sectional design as primary data was gathered within a specific timeframe of approximately three weeks intervals without the author manipulating the entrepreneurial challenges as the independent variables (Lavrakas 2008; Cherry 2017). Being empirical rural study, the target population entailed SME owners from the JTG District and the FB District in the Northern Cape Province of South Africa. The author approached two informants each from the research areas that assisted in selecting SME owners according to the set requirements. Primary dataset was available only from SME owners, based on strict requirements. The final research participants of 267 SME owners assisted in providing data by means of simple random and purposive sampling techniques. The purposive sampling technique was preferable as the author was able to select only SME owners who were knowledgeable on the phenomena to attain the research objectives, as well as knowing that the relevant data was provided for inferences.
Research Instrument: A prior academic study by Lebakeng (2008), which validated a seven-point Likert scale questionnaire was adapted by the author and applied to collect the primary data for this study. The instrument was designed with clarity to achieve constant results (Kothari 2004). More alterations of relevant questions were performed to the original instrument to suit the current study objectives. A statement such as
“business success”, as part of the original questionnaire, was deleted and replaced by more relevant and useful information. Section A of the adapted questionnaire gathered demographic information, while Sections B, C, D and E were designed to focus on the challenges. All the applicable questions were ranked on a seven-point Likert scale questionnaire, ranging from 7=strongly disagree to 1=strongly agree. Some amendments were made; thus, the final measuring instrument consisted of 48 statements relating to the challenges. In order to attain valuable insights and to realise the objectives, the questionnaire featured some open and closed-ended questions, based on extant literature. But also to evaluate the control variables (the entrepreneurial challenges) as indicated by the null and alternate hypotheses.
The overall Cronbach’s alpha of this instrument was over 0.70. This implies that the instrument employed was reliable. To ensure an error free research instrument, the author conducted a pre-test of the instrument using fewer SME owners for final modifications to items on the research instrument (Cooper and Schindler 2008). Furthermore, the research instrument was pre-tested to ascertain the level of understanding by SME owners and interpretations of each item, as stated by the instrument. The author performed pre-testing of the instrument to determine that expectations were met in relation to every score that formed part of the research instrument (Schwab 2013). To ensure that the research instrument was valid and reliable, specific measures were taken by the author. Arasti (2011) states that business failure occurs because set objectives were not achieved; thus, the business’s operations and activities close down. To counter this an extensive literature search and pre-testing of the instrument by conducting a pilot study to assess the internal validity. In addition, the author involved experts and statisticians with the relevant knowledge to ensure that the research instrument attained face, content, construct and criterion validity.
4. Data Analysis
63
tools, were employed to highlight empirical data interconnection for concluding meaningful information on underlining research issues (Denscombe 2007). Being a quantitative study, the author used descriptive and inferential statistical tools aided by cross-tabulation, an independent t-test and Pearson’s chi-square test to make a determination on the significant differences between the dependent and independent variables the Pearson chi-square test was not only conducted for meaning on the primary dataset.
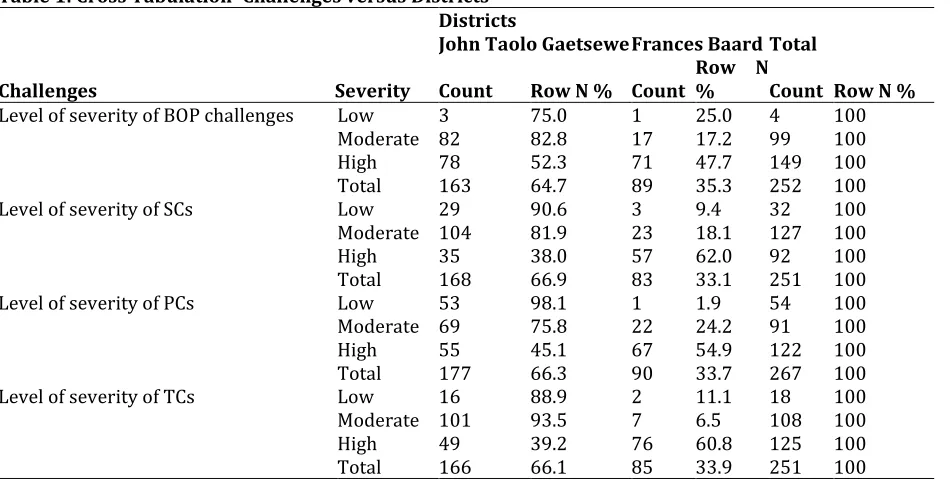
Testing Formulated Hypotheses: The formulated hypotheses were scientific theories of assumptions applied to understand the characteristics of population at the time of the study (McDaniel and Gates 2013). Testing the hypotheses in this study, the author conducted Pearson’s chi-square test; a lesser p-value of 0.05 that depicts strong scientific evidence in relation to the stated hypothesis – as such, the null hypothesis is rejected (McDaniel and Gates 2013). On the other hand, cross-tabulation was employed to determine the severity of challenges in each district. Besides the agricultural and mining sectors, tertiary industry adds 68.2% to the local economy. Similar socio-economic conditions are experienced by the population of the JTG District. The rural nature of the JTG District is of concern; an estimated 80% of the inhabitants reside in rural areas. Hence, a larger p-value of 0.05 represents that the null hypothesis, as formulated in this study, is accepted (Pallant 2010) in sum, a p-value lesser than 0.05 means that the hypothesis (H1 or H2) is accepted, and vice versa. In order to test the formulated hypotheses, statistical tools of Pearson’s chi-square test was utilised and the final outcomes are presented in the tables below.
Table 1: Cross Tabulation–Challenges versus Districts
Challenges Severity
Districts
John Taolo Gaetsewe Frances Baard Total
Count Row N % Count Row N % Count Row N % Level of severity of BOP challenges Low 3 75.0 1 25.0 4 100
Moderate 82 82.8 17 17.2 99 100
High 78 52.3 71 47.7 149 100
Total 163 64.7 89 35.3 252 100
Level of severity of SCs Low 29 90.6 3 9.4 32 100
Moderate 104 81.9 23 18.1 127 100
High 35 38.0 57 62.0 92 100
Total 168 66.9 83 33.1 251 100
Level of severity of PCs Low 53 98.1 1 1.9 54 100
Moderate 69 75.8 22 24.2 91 100
High 55 45.1 67 54.9 122 100
Total 177 66.3 90 33.7 267 100
Level of severity of TCs Low 16 88.9 2 11.1 18 100
Moderate 101 93.5 7 6.5 108 100
High 49 39.2 76 60.8 125 100
Total 166 66.1 85 33.9 251 100
64
Table 2: Pearson Chi-Square Tests-Challenges versus Districts
Level of severity of BOP challenges Chi-square 24.378
Df 2
P-value .000
Level of severity of SCs Chi-square 55.644
Df 2
P-value .000
Level of severity of PCs Chi-square 52.785
Df 2
P-value .000
Level of severity of TCs Chi-square 80.812
Df 2
P-value .000
The analysis, according to SME owners’ viewpoints, as stated in Table 2 indicated significant differences in term of BOP challenges, SCs, PCs and TCs. The p-values=0.000 are less than 0.05. Thus, the null hypotheses in this study were rejected, implying significant differences between the JTG District and the FB District in terms of the four challenges under investigation. As the Pearson chi-square test is designed to show statistical significance, not the severity of the challenges, the group statistics (Table 3 below) were applied to determine the level of severity regarding the various challenges across the two districts.
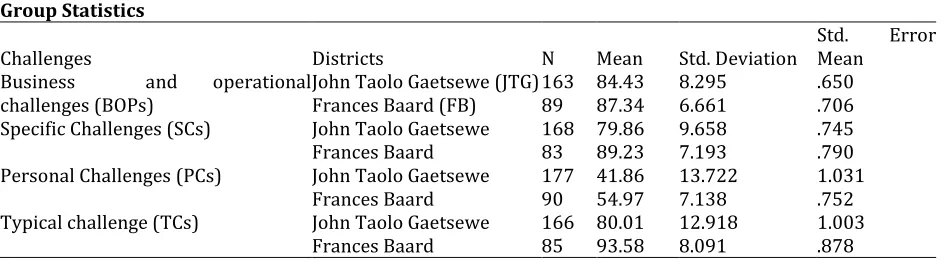
Table 3: Descriptive Statistics of Challenges by Districts (JTG and FB) Group Statistics
Challenges Districts N Mean Std. Deviation Std. Mean Error
Business and operational
challenges (BOPs) John Taolo Gaetsewe (JTG) 163 84.43 Frances Baard (FB) 89 87.34 8.295 6.661 .650 .706 Specific Challenges (SCs) John Taolo Gaetsewe 168 79.86 9.658 .745
Frances Baard 83 89.23 7.193 .790
Personal Challenges (PCs) John Taolo Gaetsewe 177 41.86 13.722 1.031
Frances Baard 90 54.97 7.138 .752
Typical challenge (TCs) John Taolo Gaetsewe 166 80.01 12.918 1.003
Frances Baard 85 93.58 8.091 .878
Based on statistical explanations in Table 3 above, the mean BOP challenges for the FB District (87.34) were greater than the mean (84.43) BOP challenges for the JTG District. Regarding SCs, the mean (89.23) was much greater in the FB District in comparison with the mean (79.86) in the JTG District. It further revealed that the mean (=54.97) was greater in the FB District in terms of PCs in contrast to the mean (41.86) in the JTG District. According to Table 3, the FB District showed a mean (=93.58) on TCs that was greater than the mean (=80.01) for TCs as experienced in the JTG District.
Table 4: Independent Sample T-Test for Challenges by Districts
Challenges
Levene's Test for Equality of Variances
F Sig. T df p-value
Business and Operational
65
In order to test the homogeneity of variances between two districts for BOP challenges, a Levene’s Test was conducted. Table 4 depicts BOP to be statistically significant (Sig=0.024<0.05); thus, the data revealed non-homogeneity of variances between the two districts. Therefore, the variances cannot be assumed to be equal. The t-test result corresponded to “Equal variances not assumed”. An independent sample t-test was conducted for significant differences between two districts on BOP challenges at 5% level of significant (alpha of 5%). There are significant differences between the districts in terms of BOP challenges – a p-value less than 0.05, t (216) =3.031, p-value=0.003. Therefore, the stated hypothesis was not rejected at 5% level of significance. However, Table 3 above showed that the FB District (mean=87.33) appeared to experience more BOP challenges than the JTG District (mean=84.42). In order to test the homogeneity of variances between the two districts for SCs, a Levene’s Test was conducted. Table 4 depicts SCs to be statistically significant (Sig=0.001<0.05); thus, the data revealed non-homogeneity of variances between the two districts. Therefore, the variances cannot be assumed to be equal. The t-test result corresponded to “Equal variances not assumed”.
An independent sample t-test was conducted for significant differences between the two districts on SCs at 5% level of significance (alpha of 5%). There were significant differences between the districts in terms of SCs, with a p-value less than 0.05, t (210.95) =8.63, p-value=0.000. Therefore, the stated hypothesis was not rejected at 5% level of significance. However, Table 3 above showed the FB District (mean=89.23) appeared to experience more SCs than the JTG District (mean=79.86). In order to test the homogeneity of variances between two districts for PCs, a Levene’s Test was conducted. Table 4 depicted PCs to be statistically significant (Sig=0.000<0.05); thus, the data revealed non-homogeneity of variances between the two districts. Therefore, the variances cannot be assumed to be equal.
The t-test result corresponded to “Equal variances not assumed”. An independent sample t-test was conducted for significant differences between the two districts on PCs at 5% level of significance (alpha of 5%). There are significant differences between the districts in terms of PCs, with a p-value less than 0.05, t (265) =10.262, p-value=0.000. Therefore, the stated hypothesis was not rejected at 5% level of significance. However, Table 3 above showed that the FB District (mean=54.96) appeared to experience more PCs than the JTG District (mean=41.86). In order to test the homogeneity of variances between two districts for TCs, a Levene’s Test was conducted. Table 4 indicated the TCs to be statistically significant (Sig=0.000<0.05); thus, the data revealed non-homogeneity of variances between the two districts. Therefore, the variances cannot be assumed to be equal. The t-test result corresponded to “Equal variances not assumed”. An independent sample t-test was conducted for significant differences between the two districts on TCs at 5% level of significance (alpha of 5%). There are significant differences between the districts in terms of TCs, with a p-value less than 0.05, t (239) =10.180, p-value=0.000. Therefore, the stated hypothesis was not rejected at 5% level of significance. However, Table 3 above showed that the FB District (mean=93.58) appeared to experience more TCs than the JTG District (mean=80.01).
Discussion: The primary objective of this empirical study was to explore the entrepreneurial challenges between two rural areas in South Africa. Having conducted thorough analyses to explore the entrepreneurial challenges between the two rural districts of JTG and FB, it is significant to provide an in-depth discussion on the empirical outcomes by means of different statistical tools. This discussion also includes testing formulated hypotheses using the Pearson chi-square test. Generally, the analysis revealed that FB experienced high levels of entrepreneurial challenges. Accordingly, all four entrepreneurial challenges were obstructive to SMEs operations FB district. This revelation bears similarities to past empirical studies that small businesses are confronted by several challenges (Biggs and Shah 2006; Barnard, Kritzinger and Kruger 2011; Salleh and Sidek 2011; Tahir, Mohamad and Hasan 2011; Stroyan and Brown 2012). In hierarchical order, entrepreneurial challenges that hinders SMEs are TCs (mean=93.58), SCs (mean=89.23), BOP (mean=87.33) and PCs (mean=54.96). Of the four entrepreneurial challenges, PCs were the least detrimental to SMEs success.
66
instead they provided a more favourable business climate than other entrepreneurial challenges in the JTG District. This finding that these challenges enabled successful operations is not in support of a survey by Schwartz and Hornych (2010) that confirmed that entrepreneurial challenges are stumbling blocks to business success. It emerged from Table 1 that SCs in FB (62%) were high, indicating the severity of SCs as impediments to SME owners across the District. (Ocloo, Akaba and Worwui-Brown 2014) reiterate that SCs, namely the lack of sufficient applications of technologies, create severe business constraints.
This implied that the SMEs in the FB District that experienced business failures were unable to utilise technology. Results to this effect have shown that in the FB District the existing business climate of SCs was exceptionally high (62%) in comparison with 38% in the JTG District. The results shown in Table 1 were as high as 54.9% in terms of PCs in the FB District, indicating more PCs for SME owners compared to SME businesses in the JTG District. Simply put, SME owners in the FB District operated in a highly constrained business climate. Should these challenges be left unchecked in the environment, SME owners will struggle to operate successful businesses (Fumo and Jabbour 2011). In a situation such as this, more is required from SME owners in the FB District in return for SME success. Regarding TCs, cross tabulation indicated 60.8% constraint for SME owners in the FB District. The result indicated that in the JTG District SME owners were more likely to operate successful businesses. Through the first hypothesis, an analysis was conducted on BOP challenges aided by the Pearson chi-square tests. The findings revealed (see Fable 2) significant differences on the four challenges in the two rural districts. In both JTG and FB it was found that challenges of BOP, SC, PC and TC impede SMEs’ operations. Nonetheless, the level of severity differed among the districts. These findings are congruent with other empirical evidence (Fatoki and Garwe 2010 ; Agyapong, Agyapong and Darfor 2011).
The authors opines that the different challenges that SME owners experience are inhibiting factors in operating successful businesses. Based on the Pearson chi-square test, it emerged that the impact of entrepreneurial challenges differed (p-values=0.000 was lesser than 0.05) – thus, a rejection of the null hypotheses. Further revelations pointed to group statistics (refer to Table 3), which described the level of severity pertaining to these challenges across the two rural districts. It emerged that BOP challenges were more severe in FB (mean=87.34) than in JTG (mean=84.43). SCs were also more pronounced in FB (mean=89.23) than in JTG (mean=79.86), and PCs (mean=54.97) harshly impacted on SME owners in FB in comparison to PCs (mean=41.86) in JTG. Equally TCs (mean=93.58) in FB were found to be more severe than in JTG, where the TCs (mean=80.01) were less severe. In summary, the group statistics found that all the challenges, BOP, SCs, PCs and TCs, affected entrepreneurial activities and SMEs success in the FB District. Simply put, the implications were that SMEs were more likely to experience failures in FB than in JTG. Aside these challenges, SMEs failures in the FB District could be attributed to other environmental variables (Ooghe and De Prijcker 2008; Holt 2013), social variables (Arasti 2011), economic variables (Everett and Watson 1998; Hussain 2003), and political variables (Barringer and Ireland 2010; Frynas and Mellahi 2015).
Some of the key entrepreneurial challenges that obstructed SMEs’ success in the FB District related to the fear of business failure referred in this study as PCs, which received extensive scientific coverage in the past (Singh Sandhu, Fahmi Sidique and Riaz 2011). The outcomes of this study are consistent with similar empirical evidence by Stewart and Roth (2001), which found high levels of business risks as one of the fundamental contributors to business failures. The findings by this study further confirmed (Timm 2011) that in an environment, such as the FB District, it is impractical to institute an effective policy framework to offer sufficient SME support systems. Further statistical tool namely the T-test was applied to analyse the significant differences between the districts in terms of BOP challenges. In line with earlier revelations, there is significant difference between the districts. The FB District emerged as the hardest hit by all the challenges stated in this study. Previous work resonates with the current study that SMEs lack adequate growth due to poor capital funding in South Africa. A similar empirical study by the WorldBank (2006) found that challenges, such as high business costs and inadequate collateral by SME owners, ruined their chances of receiving the necessary support from banks.
67
opportunities (Kelly, Singer and Herrington 2016). Several empirical studies have indicated high levels of subdued entrepreneurial activities due to these challenges (Bretschger and Smulders 2007; Bear, Rahman and Post 2010; Chiloane and Mayhew 2010; Agbenyega 2013). Despite these problems, the focal point of the current study was to compare the entrepreneurial challenges in two rural districts of the Northern Cape Province. The result suggested that almost all the entrepreneurial challenges impacted adversely on entrepreneurial activities and SMEs’ operations in the FB District in comparison to the same activities in the JTG District.
While these challenges could be attributed to several factors, entrepreneurial activities can do well when there are adequate infrastructure facilities and a conducive operating environment (Emery, Fey and Flora 2006; Audretsch and Belitski 2017; Roundy, Bradshaw and Brockman 2018). This implies that more attention must be paid to upgrade existing infrastructure to promote a healthy business climate in the FB District. Drawing from the empirical outcomes, important recommendations were put forward to minimise the entrepreneurial challenges in the FB District in order to alleviate the failure of entrepreneurial activities and SMEs’ operations. Initially the study recommended that entrepreneurial activities in developing countries such as South Africa should be governed through “centralised policy systems” (CPSs). Challenges such as a lack of capital, insufficient collateral for funding, and high interest rates contributed to the failure of SMEs. This would enable more attention to be focused on the various challenges and provide relevant support systems.
Moreover, various stakeholders, including role players at national, provincial and local authorities, should create the necessary policy and regulatory frameworks in support of rural areas. This should be geared towards solving the rural entrepreneurial challenges across South Africa. The establishment of a more supportive entrepreneurial environment by local municipal authorities (LMAs) is essential for the survival of entrepreneurial activities. LMAs should be empowered through legislative instruments to provide educational materials in local languages to facilitate better understanding of policy on small businesses with the view of minimising the failure of entrepreneurial activities in the FB District. This means the general simplification of legislative materials in order to clarify the TCs in the District. Lastly, the national government should prioritise rural entrepreneurship education (REE) through local authorities as key rural intervention systems (RISs) in order to motivate rural owner-managers the services of community-based role models is very critical especially in FB district.
Ethical Considerations: The author was critical of every aspect of the study’s ethical issues. Thus, every level of ethical standards relating to this empirical study was taken into account. The dataset for this study was kept confidential with further stricter measures of not revealing the participants’ identities during the reporting phase. The author obtained written and signed consent forms from the SME owners prior to the commencement of the study. The SME owners were also provided with all the information and procedures leading up to the processes.
Study Limitations: This study was conducted in two rural settings. Similar to other empirical work, there were countless limitations to be taken into account in order to understand the findings. Initially, the population characteristics were very small. As a result, care had to be taken in the interpretation of the results. This empirical study involved only two rural districts; thus, it would be improper to generalise the results to broader rural districts in South Africa. Finally, the data obtained was of a cross-sectional nature. As such, there were limitations in terms of the specific time-frame within which the primary data was collected.
5. Conclusion
68
and SME failures in South Africa, but also advanced in broad terms how entrepreneurial challenges impacted more negatively on SMEs’ operations in some areas than others. Thus, intervention programmes are highly critical in the management of SMEs (FinScope, 2010). The empirical outcomes of this study suggested that the different entrepreneurial challenges, including TCs, BOP challenges, SCs and PCs, severely constrained entrepreneurial activities and SMEs’ operations. Moreover, the distinctive nature of rural environments could contribute either negatively or positively to entrepreneurial activities. The entrepreneurial challenges were highlighted through formulated hypotheses, in addition to statistical mean analysis.
The central objective of this study was to compare entrepreneurial challenges in the JTG District and the FB District. These challenges were probed extensively through formulated hypotheses in line with a conceptual framework. The findings that emerged from this study bore similarities to previous entrepreneurship research, which stated that entrepreneurial challenges negatively affected the operations of SMEs (Haron et al., 2013). This study concluded that entrepreneurial activities experienced increasingly higher levels of entrepreneurial challenges in the FB District. In line with this finding, specific recommendations in terms of policy implications were detailed to address these challenges and improve entrepreneurial activities in the FB District.
References
Acs, Z. J., Desai, S. & Hessels, J. (2008). Entrepreneurship, economic development and institutions. Journal of Small Business Economics, 31(3), 219-234.
Adeniran, T. & Johnston, K. (2011). Investigating the level of internet capabilities of South African small and medium enterprises in changing environments. In: Proceedings of 2011 Conference.
Agbenyegah, A. T. (2013). Challenges facing rural entrepreneurship in selected areas in South Africa. Potchefstroom: North-West University, Unpublished thesis for the award of Doctor in Business Administration, 1-521.
Agyapong, D., Agyapong, G. K. & Darfor, K. N. (2011). Criteria for assessing small and medium enterprises 'borrowers in Ghana. International Business Research, 4(4), 132.
Amra, R., Hlatshwayo, A. & McMillan, L. (2013). SMME employment in South Africa. In: Proceedings of biennial Conference of the Economic Society of South Africa, Bloemfontein.
April, W. I. (2005). Critical factors that influence the success and failure of SMEs in Namibia in the Khomas Region. Stellenbosch: University of Stellenbosch.
Arasti, Z. (2011). An empirical study on the causes of business failure in Iranian context. African Journal of Business Management, 5(17), 7488-7498.
Audretsch, D. B. & Belitski, M. (2017). Entrepreneurial ecosystems in cities: establishing the framework conditions. The Journal of Technology Transfer, 42(5), 1030-1051.
Baliyan, S. P. & Baliyan, P. S. (2013). Institutions and organisations contributing to entrepreneurship education and skill development in Botswana. Journal of Sustainable Development in Africa, 15(5), 1-6.
Barnard, S., Kritzinger, B. & Kruger, J. (2011). Location decision strategies for improving SMME business performance. Acta Commercii, 11(1), 111-128.
Baron, R. & Shane, S. (2007). Entrepreneurship: A process perspective. Nelson Education.
Barringer, B. R. & Ireland, D. (2010). Entrepreneurship: Successfully launching new ventures, global ed: New Jersey: Pearson Higher Education.
Barth, J. R., Yago, G. & Zeidman, B. (2006). Barriers to entrepreneurship in emerging domestic markets: Analysis and recommendations. Santa Monica, CA: The Milken Institute,
Bear, S., Rahman, N. & Post, C. (2010). The impact of board diversity and gender composition on corporate social responsibility and firm reputation. Journal of Business Ethics, 97(2), 207-221.
Biggs, T. & Shah, M. K. (2006). African small and medium enterprises, networks, and manufacturing performance. The World Bank.
Biyase, L. (2009). DTI to look at how crisis hurts small enterprises. The Star, 23 Bosma, N. & Levie, J. (2010). Global Entrepreneurship Monitor: 2009 Global Report.
69
Bryden, J. & Hart, K. (2005). Why local economies differ: the dynamics of rural areas in Europe: Edwin Mellen Press Celedigion.
Cassar, G. (2004). The financing of business start-ups. Journal of business venturing, 19(2), 261-283.
Cherry, K. (2017). What is a cross-sectional study? Available: https://www.verywell.com/social-psychology-research-methods-2795902. (Accessed, 5th March 2019)
Chiloane, G. & Mayhew, W. (2010). Difficulties encountered by black women entrepreneurs in accessing training from the Small Enterprise Development Agency in South Africa. Gender and Behaviour, 8(1), 2590-2602.
Cooper, R. D. & Schindler, S. P. (2008). Business Research Methods 10th ed. Singapore: McGraw-Hill.
Cope, J. (2011). Entrepreneurial learning from failure: An interpretative phenomenological analysis. Journal of business venturing, 26(6), 604-623.
Cronje, G., Du Toit, G., Marais, A. & Motlatta, M. (2000). Introduction to business management. Cape Town: Oxford University Press.
Dabson, B. (2001). Supporting rural entrepreneurship. Exploring Policy Options for a New Rural America, 35-48.
Denscombe, M. (2007). The good research guide for small-scale social projects. Maidenhead, England: McGraw Hill,
Easterby-Smith, M. T. & Thorpe, R. (2002). R. & Lowe, A. (2002). Management research: An introduction, 2, 342.
Emery, M., Fey, S. & Flora, C. (2006). Using community capitals to develop assets for positive community change. CD Practice, 13, 1-19.
Everett, J. & Watson, J. (1998). Small business failure and external risk factors. Small Business Economics, 11(4), 371-390.
Fatoki, O. (2014). The causes of the failure of new small and medium enterprises in South Africa.
Mediterranean Journal of Social Sciences, 5(20), 922.
Fatoki, O. & Garwe, D. (2010). Obstacles to the growth of new SMEs in South Africa: A principal component analysis approach. African Journal of Business Management, 4(5), 729- 738.
Fatoki, O. O. & Smit, A. V. A. (2011). Constraints to credit access by new SMEs in South Africa: A supply-side analysis. African Journal of Business Management, 5(4), 1413-1425.
Fraenkel, J. R., Wallen, N. E. & Hyun, H. H. (2011). How to design and evaluate research in education. New York: McGraw-Hill Humanities/Social Sciences/Languages.
Frynas, J. G. & Mellahi, K. 2015. Global strategic management. Oxford University Press, USA.
Fumo, N. D. G. & Jabbour, C. J. C. (2011). Barriers faced by MSEs: Evidence from Mozambique. Industrial Management & Data Systems, 111(6), 849-868.
FinScope. (2010). Survey highlights. South Africa 2010.
Haron, H., Said, S. B., Jayaraman, K. & Ismail, I. (2013). Factors influencing small medium enterprises (SMES) in obtaining loan. International Journal of Business and Social Science, 4(15).
Herrington, M., Kew, J. & Kew, P. (2009). Global Entrepreneurship Monitor. South Africa Report. Available: Available: http://www.gbs.nct.ac.za/gbswebb/userfiles/gemsouthafrica2000pdf. (17 Nov 2018) Holt, G. D. (2013). Construction business failure: conceptual synthesis of causal agents. Construction
Innovation, 13(1), 50-76.
Hussain, M. (2003). The impact of economic condition on management accounting performance measures: experience with banks. Managerial Finance, 29(7), 43-61.
Jenkins, A. S., Wiklund, J. & Brundin, E. (2014). Individual responses to firm failure: Appraisals, grief, and the influence of prior failure experience. Journal of Business Venturing, 29(1), 17-33.
Jones, G. R. (1999). Organizational theory. MA: Addison-Wesley
Kelly, D., Singer, S. & Herrington, M. (2016). GEM 2015/2016 Global Report. Global Entrepreneurship Monitor. Retrieved April,
Kennickell, A. B., Kwast, M. L. & Pogach, J. (2015). Small businesses and small business finance during the financial crisis and the great recession: New evidence from the survey of consumer finances. Available at SSRN 2620748,
Klapper, L., Laeven, L. & Rajan, R. (2004). Barriers to entrepreneurship. NBER Working Paper, 10380 Kok, P. & Collinson, M. (2006). Migration and urbanisation in South Africa. Statistics South Africa.
70
Lager, P. M. (2015). The route to capitalization: The transcendent registration exemptions for securities offerings as a means to small business capital formation. TEx. L. REv, 94, 567.
Lan, Q. & Wu, S. (2010). An empirical study of entrepreneurial orientation and degree of internationalization of small and medium-sized Chinese manufacturing enterprises. Journal of Chinese Entrepreneurship, 2(1), 53-75.
Lavrakas, P. J. (2008). Encyclopedia of survey research methods. Sage Publications.
Le Fleur, H., Koor, J., Chetty, V., Ntshangase, S., Mackenzie, R. & Rawoot, F. (2018). Informal Small Medium and Micro Enterprises (SMME) retailers in South Africa.
Lebakeng, M. A. (2008). An exploration of women entrepreneurship in Lesotho. North-West University. Love, J. H. & Roper, S. (2015). SME innovation, exporting and growth: A review of existing evidence.
International Small Business Journal, 33(1), 28-48.
Mantere, S., Aula, P., Schildt, H. & Vaara, E. (2013). Narrative attributions of entrepreneurial failure. Journal of Business Venturing, 28(4), 459-473.
Marshall, M. I. & Samal, A. (2006). The effect of human and financial capital on the entrepreneurial process: an urban-rural comparison of entrepreneurs in Indiana.
Martinsons, M. G. (2008). Relationship‐based e‐commerce: theory and evidence from China. Information Systems Journal, 18(4), 331-356.
Mbonyane, B. & Ladzani, W. (2011). Factors that hinder the growth of small businesses in South African townships. European Business Review, 23(6), 550-560.
McDaniel, C. & Gates, R. (2013). Marketing research: Student version, 9th ed. Hoboken, N: Wiley,
Nawaser, K., Khaksar, S. M. S., Shakhsian, F. & Jahanshahi, A. A. (2011). Motivational and legal barriers of entrepreneurship development. International Journal of Business and Management, 6(11), 112. Ocloo, C. E., Akaba, S. & Worwui-Brown, D. K. (2014). Globalization and competitiveness: Challenges of small
and medium enterprises (SMEs) in Accra, Ghana. International Journal of Business and Social Science, 5 (4).
Okpara, J. O. (2011). Factors constraining the growth and survival of SMEs in Nigeria: Implications for poverty alleviation. Management Research Review, 34(2), 156-171.
Omerzel, D. G. & Antoncic, B. (2008). Critical entrepreneur knowledge dimensions for the SME performance
Industrial Management & Data Systems, 108(9), 1182-1199.
Ooghe, H. & De Prijcker, S. (2008). Failure processes and causes of company bankruptcy: a typology.
Management Decision, 46(2), 223-242.
Pallant, J. (2010).SPSS survival manual. 3rd ed. New York: McGraw-Hill.
Petuskiene, E. & Glinskiene, R. (2011). Entrepreneurship as the basic element for the successful employment of benchmarking and business innovations. Engineering Economics, 22(1), 69-77.
Roundy, P. T., Bradshaw, M. & Brockman, B. K. (2018). The emergence of entrepreneurial ecosystems: A complex adaptive systems approach. Journal of Business Research, 86, 1-10.
Salleh, M. & Sidek, N. (2011). Rural entrepreneurship: a challenges and opportunities of rural micro enterprise (RME) in Malaysia. Interdisciplinary Journal of Contemporary Research in Business, 2(11), 573-585.
Saxena, S. (2012). Problems faced by rural entrepreneurs and remedies to solve it. Journal of Business and Management, 3(1), 23-29.
Schwab, D. P. (2013). Research methods for organizational studies. Psychology Press.
Schwartz, M. & Hornych, C. (2010). Cooperation patterns of incubator firms and the impact of incubator specialization: Empirical evidence from Germany. Technovation, 30(9-10), 485-495.
Singh Sandhu, M., Fahmi Sidique, S. & Riaz, S. (2011). Entrepreneurship barriers and entrepreneurial inclination among Malaysian postgraduate students. International Journal of Entrepreneurial Behavior & Research, 17(4), 428-449.
Stathopoulou, S., Psaltopoulos, D. & Skuras, D. (2004). Rural entrepreneurship in Europe: a research framework and agenda. International Journal of Entrepreneurial Behavior & Research, 10(6), 404-425. Sternberg, R. (2009). Regional Dimensions of Entrepreneurship. Foundations and Trends® in
Entrepreneurship, 5(4), 211-340.
Stevenson, H. H., Roberts, M. J. & Grousbeck, H. I. (1989). Business Ventures and the Entrepreneur. Irwin: Homewood.
71
Stroyan, J. & Brown, N. (2012). Using Standards to Support Growth, Competitiveness and Innovation: a smart guide on promoting and facilitating SME competitiveness through the development and use of standards with the help of EU structural funds. European Union.
Tahir, P. R., Mohamad, M. R. & Hasan, D. (2011). A short review of factors leading to success of small medium enterprises. Interdisciplinary Journal of Contemporary Research in Business, 2(11), 519-529.
Timm, S. (2011). How South Africa can boost support to small businesses: Lessons from Brazil and India. Pretoria, Trade and Industrial Policy Secretariat,
Ucbasaran, D., Westhead, P., Wright, M. & Flores, M. (2010). The nature of entrepreneurial experience, business failure and comparative optimism. Journal of Business Venturing, 25(6), 541-555.
Van Wyk, H. M. (2010). The impact of BBBEE on small and medium–sized businesses in the Sedibeng region. North-West University.
Venter, R., Urban, B. & Rwigema, H. (2008). Entrepreneurship: theory in practice. 2nd ed. Cape Town: OUP. Wennekers, S. & Thurik, R. (1999). Linking entrepreneurship and economic growth. Small Business Economics,
13(1), 27-56.
Wiklund, J. & Shepherd, D. (2005). Entrepreneurial orientation and small business performance: a configurational approach. Journal of business venturing, 20(1), 71-91.
WorldBank. (2006). World Bank indicators. Washington, DC: World Bank.
Yew Wong, K. 2005. Critical success factors for implementing knowledge management in small and medium enterprises. Industrial Management & Data Systems, 105(3), 261-279.