Journal of Mathematics and Informatics Vol. 11, 2017, 131-141
ISSN: 2349-0632 (P), 2349-0640 (online) Published 11 December 2017
www.researchmathsci.org
DOI: http://dx.doi.org/10.22457/jmi.v11a17
Journal of
Reliability Availability and Maintainability Analysis of
the Systems
Ramesh Kumar. A1 and Krishnan. V2
1
Department of Mathematics
Srimad Andavan Arts and Science College (Autonomous) T.V. Kovil, Trichy-620005, Tamilnadu, India. 2
Department of Mathematics, Jamal Mohamed College (Autonomous) Trichy-620020, Tamilnadu, India.
E-mail: [email protected]; [email protected] Received 25 November 2017; accepted 7 December 2017
Abstract. In this paper, is to permit the system reliability analysts/managers/engineers/ practitioners to conduct RAM analysis of the system which may help them to model, analyze and predict the behavior of industrial systems in a more realistic and consistent manner. Markovian approach is used to model the system behavior. For carrying out study, Root Cause Analysis (RCA) of the subsystems is carried out and transition diagrams for various subsystems are drawn and differential equations associated with them are formulated. After obtaining the steady state solution the corresponding values of reliability and maintainability are estimated at different mission times. With RAM analysis of the system key performance metrics such as Mean Time between Failure (MTBF), Mean time to Repair Time (MTTR) and System availability values are ascertained.
Keywords: system failure, reliability, maintainability, Markov, process industry AMS Mathematics Subject Classification (2010): 60K10
1. Introduction
Ramesh Kumar. A and Krishnan. V
132
processes [1-3]. But there is no doubt that the success of these innovative programs mainly depends upon the reliable operation of production systems.
A company cannot achieve success if its systems are unavailable and unreliable. Increasingly, companies are viewing reliability and maintainability issues as part of the corporate quest to improve quality by imbibing lean manufacturing, just in time, six-sigma mantras to achieve customer satisfaction and remain competitive [2,4]. The management is highly concerned with reliable operation of production systems. To this effect the knowledge of behavior of system, their component(s) is customary in order to plan and adapt suitable maintenance strategies. For the last 04 decades reliability analysis has been established as a useful tool for risk analysis, production availability studies and design of systems [6-9]. Reliability techniques have been applied in three main areas in process industry(i) production availability studies in conceptual design (RAM analysis) (ii) safety (risk analysis) (iii) maintenance (criticality analysis, lifecyclecost) [10]. Much effort has been made to compile and analyze reliability data for generic use. For instance, Cochran et al. [7] presented a practical case study of reactor regenerator system in Fluid Catalytic Cracking Unit of a petroleum refinery using generic Markov models to estimate system availability. Libero Poulos and Tsarouhas [8] presented a statistical analysis of failure data of an automated pizza production line.
The analysis includes identification of failures, computation of statistics of the failure data, and parameters of the theoretical distributions that best fit the data, and investigation of the existence of autocorrelations and cross correlations in the failure data. The analysis is meant to guide food product machinery manufacturers to improve the design and operation of the production lines. Dai and Jia [11] collected failure data of vertical machining center, analyzed it and based on the analysis provided ways to improve the reliability of machining centre. Schoenig et al., [12] presented an aggregation method using markov graphs for the reliability analysis of hybrid systems. The method allows the designers to have an exact representation and better overview of the system states. Gupta et al., [13] analyzed reliability and availability of serial processes of plastic-pipe manufacturing plant. In the study they computed reliability, availability, and mean time before failure of the process of a plastic-pipe manufacturing plant consisting of a (K, N) system for various choices of failure and repair rates of sub-systems by setting up Chapman-Kolmogorov differential equations. Pair et al., [14] conducted reliability improvement study of electronics standby display system of modern aircraft. Through this analysis they made an attempt to improve the reliability of an electronic stand by display system (ESDS) used in the cockpit.
Reliability Availability and Maintainability Analysis of the Systems
modeled to obtain RAM indices for measuring the system performance so that a companywide maintenance planning system could be made for effective maintenance and operation of system.
2. System description and assumptions
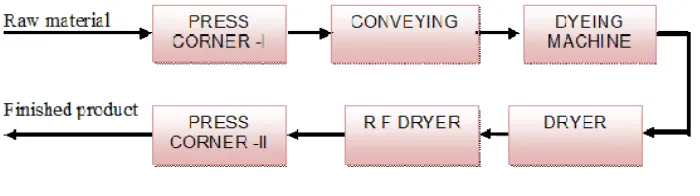
Study is undertaken for garment manufacturing company with a present annual turnover of500 crores. The company considered in the study currently manufactures readymade garments for kids, women and men, in addition to yarn for other manufacturers. Its product range includes thermal wear, T-shirts, trousers, track suits, pullovers, shorts, casuals andjackets. These products are manufactured from raw material like cotton, fiber. First the thread is manufactured in the spinning mill & then dyeing is done in the Dyeing unit and after that garments are manufactured in the next unit. At present the company has a capacity of 90000 spindles, dyeing capacity of 14 tones and yarn making capacity of 92 tons per day. Company is embarking upon a major expansion plan enhancing its spindle & dyeing capacities and setting up a 15 MW power generation plant. Figure 1 shows system configuration with variousunits.
Figure 1: System units.
The raw material for this system is thread which passes through the following six stages:
Stage 1. Rolling of thread on spring
The raw product for the plant is thread, which is mounted on the paper cones. These threads from the cones are mounted on the stainless-steel springs also called ‘soft packages’ with the help of press corner machine. This is done so that when dyeing is done then these springs would be able to withstand high temperature andpressure.
Stage 2. Loading of spring on carrier
Springs (Soft packages) are then loaded on the individual spindle of the carrier of Dyeing machine and these packages are pressed to make uniform column to get even dyeing Then, this carrier is carried to the Dyeing container through a conveying system which is remote operated.
Stage 3. Dyeing of threads
Ramesh Kumar. A and Krishnan. V
134 inside for uniform dyeing.
Stage 4. Drying of spring
The dyed yarn soft packages are put in Hydro Extractor which removes moisture by the centrifugal process, but still some moisture is left in the threads. So, these threads are dried in the Radio FrequencyDryer.
Stage 5. Radio frequency drying
Moisture content of the yarn after passing through Hydro Extractor is about 54 – 58% and such packages are then passed through RF Dryer to remove the balance moisture of the package. The resultant moisture after passing through RF Dryer is about 6-7%. Drying is done with the help of microwaves.
Stage 6. Rolling of threads on paper cones
As the thread is dry now so springs are put again on the press corner machine and then thread is mounted again on the paper cones. Finally, each individual cone is checked for any quality defects by visual inspection under light and then it is packed for final shipment.
Assumptions
For the purpose of modeling to obtain RAM indices, following assumptions were taken into account
1. Failure rates & repair rates for all the units of thread dyeing plant sub-systems are constant overtime.
2. Mean Time Between Failure (MTBF) & Mean Time To Repair (MTTR) data are exponentially distributed. So, there are no simultaneous failures of units in sub-system or among the sub sub-systems & probability of more than one failure or repair in a time interval iszero.
3. The repaired units are as good as new one. Repair or replacement carried out in case of failureonly.
4. There are separate repair facilities for each subsystem.
5. Any sub system of the thread dyeing plant remains only in only two of the states: operating andnon-operating.
The study described in the paper is for the steady state period i.e. during which the failure rate of the system can be considered as constant (as shown in Figure 2 by the Bath-tub curve).
R O C O F
Time
Burn-in period Wear out period
Reliability Availability and Maintainability Analysis of the Systems
Figure 2: Bath-tub curve.
3. System analysis
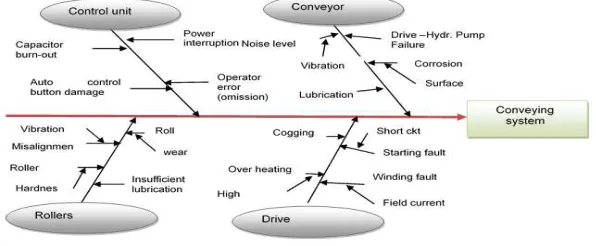
Before conducting quantitative analysis to determine the RAM indices, qualitative analysis of the system is carried out using Root Cause Analysis. Figure 3 shows RCA diagram for conveying sub-system. Similarly, RCA is carried out for other subsystems i.e. Dyeing Machine, Spin Dryer, Radio Frequency Dryer and Press Corner-II.
Figure 3: Root cause analysis for conveying sub-system
Conveying subsystem is considered for quantitative analysis. Figure 4 shows reliability block diagram for Conveying Sub system
Figure 4: RBD for Conveying System.
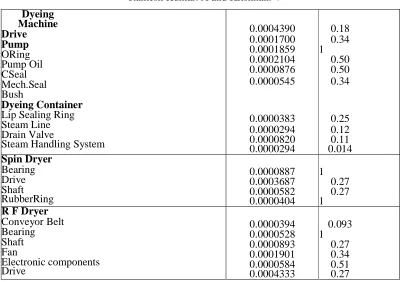
Table I: Failure and Repair Rates of different Components.
Sub Systems Failure Rate(λ) Repair Rate(µ)
Press corner
Spindle bearing
Drive 0.0001472 0.0006107 1 0.27
Conveying System
Drive Rollers Control Unit Conveyor
0.0002370 0.0000502 0.0000470 0.0000260
0.27 0.51 1 0.34 Conveyers Control Unit
Ramesh Kumar. A and Krishnan. V 136 Dyeing Machine Drive Pump ORing Pump Oil CSeal Mech.Seal Bush Dyeing Container
Lip Sealing Ring Steam Line Drain Valve
Steam Handling System
0.0004390 0.0001700 0.0001859 0.0002104 0.0000876 0.0000545 0.0000383 0.0000294 0.0000820 0.0000294 0.18 0.34 1 0.50 0.50 0.34 0.25 0.12 0.11 0.014 Spin Dryer Bearing Drive Shaft RubberRing 0.0000887 0.0003687 0.0000582 0.0000404 1 0.27 0.27 1
R F Dryer
Conveyor Belt Bearing Shaft Fan Electronic components Drive 0.0000394 0.0000528 0.0000893 0.0001901 0.0000584 0.0004333 0.093 1 0.27 0.34 0.51 0.27
3.1. Quantitative analysis
For carrying out quantitative analysis to determine system RAM indices failure and repair data of different system components is collected by taking into account company’s historical records and maintenance logs (Table I)
Reliability for Conveying System: RCS=
RD*RR*RC*RC Reliability of Drive, RD = e-λt Reliability of Rollers,
RR = e-λt
Reliability of Control Unit, RCU= e-λt Reliability of Conveyer ,RC = e-λt
Table II presents values of reliability for all the components of conveying subsystem. Table II: Computed Reliability Values of units.
Time (hrs.) Drive Rollers Control Unit Conveyors R
conveying system
0 1 1 1 1 1
100 0.97657 0.99499 0.99531 0.99744 0.96688
200 0.95370 0.99001 0.99064 0.99489 0.93485
300 0.93136 0.98505 0.98599 0.99222 0.90389
Reliability Availability and Maintainability Analysis of the Systems
q
500 0.88825 0.97521 0.97687 0.99870 0.84501
600 0.86744 0.97032 0.97219 0.99844 0.81702
700 0.84713 0.96547 0.96763 0.99818 0.78997
800 0.82728 0.96063 0.96309 0.99792 0.76380
900 0.80791 0.95582 0.95858 0.9976 0.73851
1000 0.78899 0.95103 0.95408 0.99740 0.70405
1100 0.77051 0.94627 0.94961 0.99714 0.69040
1200 0.75246 0.94153 0.94516 0.99688 0.66753
Availability
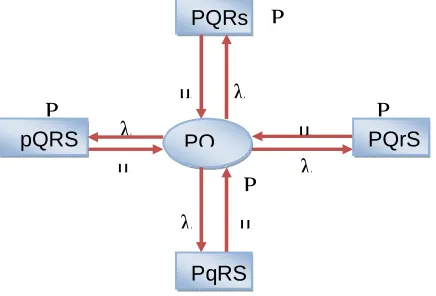
From the transition diagram (Figure 5) the equations derived are as follows: Pp*µp = P0*λp
Pq*µq= P0*λq Pr*µr = P0* λc Ps*µs = P0*λs Since the sum of the probabilities will be unity, then Pp + Pq + Pr + Ps + P0 = 1
Solving for P0; P0 = 1/(1+∑λi/µi)
Substituting the values of λi and µi, the steady state availability of the Conveying System P0 = 0.999932
Reliability of the Conveying System R = e-(∑λ*t
Figure 5: Transition diagram of Conveying System.
Failure rate of the Conveying System (λ) = ∑λi Conveying System MTBF = 1/ λ
= 2969.12hr.
It is known that availability of the Conveying System = MTBF/(MTBF+MTTR) Where, MTTR is the mean time to repair
MTTR of the Conveying
P
µ λ
P P
λ
PQ µ
µ λ
P
λ µ
PqRS
PQrS pQRS
Ramesh Kumar. A and Krishnan. V
138 System = 0.47hrs. Hence repair
rate (µ) = 1/MTTR = 2.11 / hr.
Therefore, the maintainability of the Conveying System = 1 – e-µt Table III: Maintainability Estimation of Conveying System.
Time(hrs.) Drive Rollers Remot
e
Conveye rs
Conveying system
0 0 0 0 0 0
1 0.23662 0.39950 0.6321
2 0.28228 0.40992
2 0.41725 0.63940 0.8646 7
0.49338 0.6518
3 0.55514 0.78346 0.9502 1
0.63940 0.79453
4 0.66040 0.86997 0.9816
8 0.74333 0.87876
5 0.74075 0.92198 0.9932
6 0.81731 0.92846
6 0.80210 0.95311 0.9975
2 0.86997 0.95778
7 0.84892 0.97184 0.9990 8
0.90744 0.97509
8 0.88467 0.98309 0.9996
6 0.93412 0.9853
9 0.91191 0.98984 0.9998
7 0.95311 0.99132
10 0.93272 0.99390 0.9999
6 0.96662 0.99488
11 0.94869 0.99633 0.9998
2 0.97624 0.99698
12 0.96081 0.99780 0.9999 1
0.98309 0.99821
3. Results
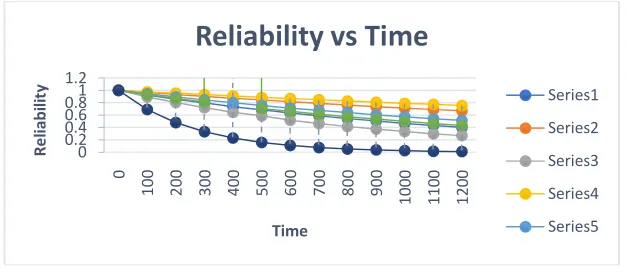
The reliability and maintainability results for all the sub-systems are calculated at different mission times (i.e. t =0, 100, 200,…,1200 hrs.). Table IV (a) and (b) presents systems reliability and maintainability values. The graphical results are shown in Figure 6 (a) and (b) respectively.
Table IV: (a) Computed reliability values.
Time RSubsys tem1
RSubsyst em2
RSubs ystem3
RSubs ystem4
RSubsyste m5
RSubs ystem6
Rsystem
0 1 1 1 1 1 1 1
Reliability Availability and Maintainability Analysis of the Systems
600 0.63461 0.81702 0.51905 0.86921 0.71634 0.66024 0.11064 700 0.58829 0.78997 0.46531 0.84914 0.67759 0.6161 0.07666 800 0.54535 0.7638 0.41714 0.82954 0.64095 0.57492 0.05311 900 0.50554 0.73851 0.37395 0.81038 0.60628 0.53648 0.03681 1000 0.46684 0.71405 0.33524 0.79167 0.57349 0062 0.02549 1100 0.43444 0.6904 0.30053 0.77339 0.54248 0.46715 0.01766 1200 0.40273 0.66753 0.26942 0.75554 0.51314 0.43592 0.01224
Availability
Availability = Apc1*Ac*Adm*Asd*Arfd*Apc2
= 0.999*0.999833*0.992859*0.9998872*0.99796*0.999 = 0.988576 Failure rate of System (λS) = ∑λi
Mean time between failures (MTBF) = 1/λS = 272.241 hrs.
It is known that availability = MTBF/(MTBF+MTTR) So, MTTR of system = 2.772hrs
Repair rate of system = 0.3673 / hr.
Maintainability
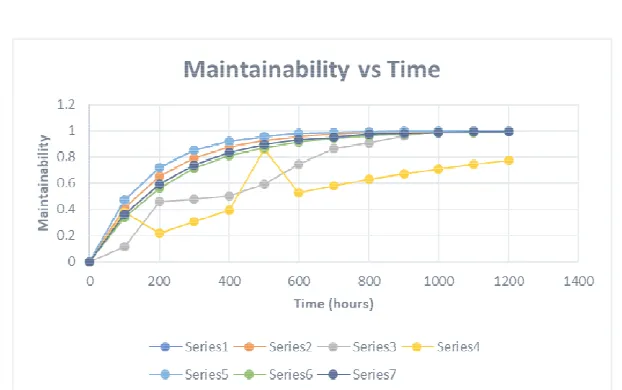
Maintainability of system = 1- e-µt
Figure 6: Reliability curves
Table IV (b) Computed maintainability values.
Tim e (hrs.
)
MSubsy stem1
MSubsy stem2
MSubsyst em3
MSubsy stem4
MSubsyst em5
MSubsy stem6
M System
0 0 0 0 0 0 0 0
100 0.47006 0.40992 0.11617 0.3791 0.47006 0.33886 0.36237 200 0.71916 0.6518 0.45773 0.21885 0.71916 0.5629 0.59343 300 0.85117 0.79453 0.47769 0.30961 0.85117 0.71102 0.74075 400 0.92113 0.87876 0.49936 0.38981 0.92113 0.80894 0.8347
0 0.2 0.4 0.6 0.81 1.2
0
100 200 300 400 500 600 700 800 900
100
0
110
0
120
0
R
e
li
a
b
il
it
y
Time
Reliability vs Time
Series1
Series2
Series3
Series4
500 0.9582 0.92846 600 0.97785 0.95778 700 0.98826 0.97509 800 0.99378 0.9853 900 0.9967 0.99132 1000 0.99825 0.99488 1100 0.99907 0.99698 1200 0.9995 0.99821
4. Discussion
From Figure 7 it is observed that probability of system non
and for subsystems the corresponding values of reliability at mission time t = are, Rss1 =0.68, Rss2 =0.8
corresponding subsystems the maintainability values are M =0.58; Mss4 =0.86Mss5=0.
are found to be low, therefore the performance of SS
careful observation. Hence, it is concluded that a preventive maintenance and repair action for the above subsystem should be strengthened to improve the overall system reliability. Reliability and Maintainability curves indica
Dyeing Machine & Radio Frequency Dryer
attention for higher performance of Dyeing Unit as a whole. The maintainability of Press Corner -I & Press Corner
calls for adopting new maintenance strategies. The availability indices for different subsystems are 0.999(SS
0.99796(SS5) and 0.999(SS
Based on the above analysis, maintenance schedule
Ramesh Kumar. A and Krishnan. V
140
0.92846 0.58963 0.8607 0.9582 0.87368 0.95778 0.7427 0.52336 0.97785 0.91649 0.97509 0.8628 0.57873 0.98826 0.94478 0.9853 0.90725 0.62767 0.99378 0.96349 0.99132 0.96442 0.67093 0.9967 0.97586 0.99488 0.99148 0.70916 0.99825 0.98404 0.99698 0.99471 0.74295 0.99907 0.98945 0.99821 0.99671 0.77281 0.9995 0.99302
Figure 7: Maintainability curves
From Figure 7 it is observed that probability of system non-failure for 500 hrs is and for subsystems the corresponding values of reliability at mission time t =
=0.84, Rss3 =0.59, Rss4 =0.88, Rss5 =0.75 and Rss6 =0.7 subsystems the maintainability values are Mss1 =0.95, Mss2
=0.95 Mss6 =0.87 respectively. As the reliability values for unit 3 , therefore the performance of SS3 needs special attention and careful observation. Hence, it is concluded that a preventive maintenance and repair action for the above subsystem should be strengthened to improve the overall system reliability. Reliability and Maintainability curves indicates that the performance of Dyeing Machine & Radio Frequency Dryer is to observed carefully & need special attention for higher performance of Dyeing Unit as a whole. The maintainability of
I & Press Corner -II is found better as compared to SS3 and SS
calls for adopting new maintenance strategies. The availability indices for different subsystems are 0.999(SS1), 0.999833(SS2), 0.992859(SS3), 0.999
0.999(SS6).
Based on the above analysis, maintenance schedule can be prepared which might 0.87368 0.8946 0.91649 0.93279 0.94478 0.95147 0.96349 0.97267 0.97586 0.98157 0.98404 0.98887 0.98945 0.99291 0.99302 0.99548
00 hrs is 0.159 and for subsystems the corresponding values of reliability at mission time t = 500 hrs =0.71 and for ss2 =0.92, Mss3 respectively. As the reliability values for unit 3 needs special attention and careful observation. Hence, it is concluded that a preventive maintenance and repair action for the above subsystem should be strengthened to improve the overall system tes that the performance of to observed carefully & need special attention for higher performance of Dyeing Unit as a whole. The maintainability of and SS4 which calls for adopting new maintenance strategies. The availability indices for different ), 0.9998872(SS4),
Reliability Availability and Maintainability Analysis of the Systems
help the maintenance managers to improve the system effectiveness by adopting suitable preventive maintenance actions. FMEA analysis of the system can be carried out by listing all possible failure modes with reference to different sub-systems.
REFERENCES
1. R.J.Arid, Application of reliability engineering to process plant maintenance, The Chemical Engineer, 74 (1980) 301-311.
2. J.A.Buzacott, Markov approach to find failure times of repairable systems, IEEE Transactions on Reliability, 19 (1970).
3. C.N.Madu, Strategic value of reliability and maintainability management, Int J Qual Reliab. Management, 22 (3) (2005) 317–328.
4. J.K.Cochran, A.Murugan and V.Krishnamurthy, Generic Markov models for availability estimation and failure characterization in petroleum refineries, Computers and Operations Research, 28(1) (2000) 1-12.
5. Y.Dai and y.Jia, Reliability of a VMC and its improvement, Reliability Engineering and System Safety, 72(1) (2001) 99-102.
6. P.Gupta, A.Kumar, R.K.Sharma and J.Singh, Analysis of reliability and availability of serial processes of plastic-pipe manufacturing plant: A case study, Int J Qual Reliab Management, 24(4) (2007) 404-419.
7. U.Hauptmann’s, Semi-quantitative fault tree analysis for process plant safety using frequency and probability ranges, Journal of Loss Prevention in the Process Industries, 17(5) (2004) 339-345.
8. G.Libero Poulos and P.Tsarouhas, Reliability analysis of an automated pizza production Line, Journal of Food Engineering, 69(1) (2005) 79-96.
9. M.Oystein, Use of reliability technology in the process industry, Reliab Eng Syst Saf, 60 (1998) 179–181.
10. G.Pari, S.Kumar and V.Sharma, Reliability improvement of electronics standby display system of modern aircraft, Int J. Qual Reliab Management, 25 (9) (2008) 955–967.
11. R.Sharma, D.Kumar and P.Kumar, Manufacturing excellence through TPM implementation– a practical analysis, Industrial Management and Data Systems, 106 (2) (2006) 256–280.
12. R.Sharma and S.Kumar, Performance modeling in critical engineering systems using RAM analysis, Reliability Engineering & System Safety, 93(6) (2008) 913-919. 13. R.Schoenig, J.F.Aubry, T.Cambois and T.Hutinet, An aggregation method of Markov
graphs for the reliability analysis of hybrid system, Reliability Engineering & System Safety, 91(2) (2006) 137-148.
14. S.Saraswat and G.S.Yadava, An overview on reliability, availability, maintainability and supportability (RAMS) engineering, Int J Qual Reliab Management, 25 (3) (2008) 330– 344.