Topic: Current Concepts in Wound Healing
Computer assessment of the composition
of a generic wound by image processing
Rohit Nayak
1, Pramod Kumar
2,3, Ramesh R. Galigekere
41Department of Electrical and Computer Engineering, University of Rochester, Rochester, NY 14623, USA. 2Department of Plastic Surgery, King Abdulaziz Specialist Hospital, Sakaka 42421, Al‑Jouf, Saudi Arabia. 3Department of Plastic Surgery and Burns, Kasturba Medical College, Manipal 576104, Karnataka, India.
4Department of Biomedical Engineering, Manipal Institute of Technology, Manipal University, Manipal 576104, Karnataka, India.
Address for correspondence: Dr. Ramesh R. Galigekere, Department of Biomedical Engineering, Manipal Institute of Technology, Manipal University, Manipal 576104, Karnataka, India. E‑mail: [email protected]
ABSTRACT
Aim: This paper addresses the assessment of the composition of a general wound, in terms of all identifiable categories of tissue and pigmentation in an attempt to improve accuracy in assessing and monitoring wound health. Materialsand Methods: Aknowledgebase of clusters was built into the hue, saturation and intensity (HSI) color space and then used for assessing wound composition. Based on the observation that the clusters are fairly distinct, two different algorithms, that is, Mahalanobis distance (MD) based and the rotated coordinate system (RCS) method, were used for classification. These methods exploit the shape, spread, and orientation of each cluster. Results: The clusters in the HSI color space, built from about 9,000 (calibrated) pixels from 48 images of various wound beds, showed 8 fairly distinct regions. The inter‑cluster distances were consistent with the visual appearance. The efficacy of the MD and RCS based methods in 120 experiments taken from a set of 15 test images (in terms of average percent‑match) was found to be 91.55 and 93.71, respectively. Conclusion: Our investigations established eight categories of tissue and pigmentation in wound beds. These findings help to determine the stage of wound healing more accurately and comprehensively than typically permitted through use of the 4‑color model reported in the literature for addressing specific wound types.
Key words:
Wound composition, color‑image processing, hue, saturation and intensity model, classification, Mahalanobis distance, rotated coordinate system method
INTRODUCTION
Accurate assessment of wound health is essential in the reduction of morbidity and mortality, which in turn reduces the cost of health care. Factors characterizing the health of a wound include its composition in terms of tissue type, pigmentation (with a one‑to‑one correspondence to distinct colors), size (area, depth, and volume), shape, regularity and texture. Traditionally, wound composition has been assessed by visual inspection, which is subjective, tedious
and limited in precision and consistency. A computerized system for assessment and documentation of the evolution of a wound is useful in providing a better understanding of wounds, the healing process, and validation of treatment protocols, and wound care products.
Color composition is the most important factor in determining the status of a wound, and its computerized
Access this article online
Quick Response Code:
Website: www.parjournal.net
DOI:
10.4103/2347-9264.165444
This is an open access article distributed under the terms of the Creative Commons Attribution-NonCommercial-ShareAlike 3.0 License, which allows others to remix, tweak, and build upon the work non-commercially, as long as the author is credited and the new creations are licensed under the identical terms.
For reprints contact: [email protected]
How to cite this article: Nayak R, Kumar P, Galigekere RR. Computer assessment of the composition of a generic wound by image processing. Plast Aesthet Res 2015;2:261-5.
assessment has been an active area of research. Arnqvist et al.[1] addressed segmenting secondary healing
ulcers based on the 3‑color (RYK) model: red (R) granulation, yellow (Y) necroses and black (K) necrotic eschar. Herbin et al.,[2] in their study on the effect of a
new drug on wound kinetics, used color information (red and green) to distinguish a wound from normal skin in estimating the area of the wound, and proposed a color index to quantify healing on uniformly colored, artificially created blisters. However, natural wounds are generally more complex with highly variegated coloring.[3]
The use of color information, rather than size, to assess healing and guide clinicians in their choice of wound care products, was stressed by Mekkes and Westerhof.[4] The
approach taken by Mekkes and Westerhof[4] in their study
of wound debridement based on video images, uses the RYK model. Jones and Plassmann[5] used the same model
along with an “unclassified” category in their description of skin ulcers. Hansen et al.[6] applied the hue, saturation
and intensity (HSI) model to classify wound severity in an animal model within 30 min following injury. Wounds were classified as mild, moderate or severe, based on differences in color. Berris and Sangwine[7] used the
RGB model, in a study of pressure ulcers, to assess the content in terms of the three tissue types (BYR model). Hoppe et al.[8] highlighted the inadequacy of the RGB
model, and used the HSI model to grade leg ulcers in terms of the quantity of slough. They also investigated the variability of color attributes (only red was considered) due to differences in lighting conditions and found hue to be the least variant. Oduncu et al.[9] also used the
HSI model to assess the amount of slough in leg ulcers. Varedas et al.[10] developed a method very specific to
pressure ulcers for classifying healthy and nonhealthy skin, with four tissue types for the latter, their method involves several preprocessing steps for the extraction of color and texture parameters. Wannous et al.[11] studied
the variability arising from image capture from different sources under different conditions, they too considered only three tissue types. Dorileo et al.[12] added white
(W, representing hyperkeratosis) to the RYK model, for analyzing dermatological ulcers. In the same context, the use of texture parameters was proposed by Pereira etal.[13]
to improve the performance of classification. The authors previously presented initial results showing the presence of eight tissue types and pigmentation, with a one‑to‑one correspondence to distinct colors.[14] Subsequently,
Veredas et al.,[15] in their elaborate work on pressure
ulcers based on four tissue‑types (with the skin regarded as the fifth), have emphasized the necessity for precise evaluation. Recently, Mukherjee etal.[16] presented
results using a three‑color model with textures.
Thus, while the importance of color in representing wound composition is well‑recognized, only three to four categories and colors have been used to date in the analysis of specific types of wounds. However, wounds evolve over time, with specific types of tissue and pigmentation with eight identifiable colors which represent healing, necrosis and/or infection.[14] This theory
is also supported by observations in a recent paper by
Veredas et al.[15] Finally, other authors have indicated that
an unaccounted color may appear in a wound bed and affect classification.[17]
The current study proposes that an eight‑color model would more comprehensively represent wound composition, evolution and changes due to infection. This would assist in the development of a comprehensive algorithm for all wounds, rather than a specific wound type (e.g. pressure ulcers). Thus, in the interest of improving the accuracy of assessment for general wounds, the authors discuss a knowledge base of clusters associated with the eight categories in an appropriate color space. The results of a classification algorithm which take into account the information about the shape, spread and orientation of each cluster, through its covariance matrix, are presented.[18] In addition, the results of the
“rotated coordinate system (RCS)” method, which also makes use of cluster shapes, are delineated.[19]
MATERIALS AND METHODS
The procedure for computer assessment of wound composition based on colors of tissue and pigmentation involves (a) choosing an appropriate color model, (b) building the knowledge base in the chosen space, and (c) classification of regions in the given wound.
The color model
Although R, G and B are the considered the “primary colors” of light, the RGB model is more useful in the generation of color rather than analysis.[18] An alternative is the HSI
model, wherein hue (H) describes pure color, saturation (S) is the “degree of dilution from purity” by white light, and I is the intensity (decoupled from color information). Color in RGB‑format can be converted to the HSI version by suitable transformations.[18] Since hue is quantified in
terms of the angle from the “red”‑axis in the HSI space, it suffers discontinuity at 0 (located at the mid‑point of the interval representing the red hue). To circumvent this problem, the hue range was shifted, as was suggested in the previous study.[20]
− ∈
= + ∈
[250, 360) [0, 250)
360 H, H H
H 110, H
(1)
The choice of the origin at H = 250 is guided by the fact that minimal tissue was found in the range of 250 ± 60. We refer to this as the modified HSI space.
Procedure for assessing wound composition The algorithm for determining the wound status in terms of tissue types and pigmentation consists of two phases, as described in the following.
Building the knowledge base
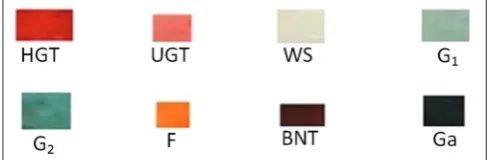
The eight categories of tissue and pigmentation of interest include: (1) healthy granulation tissue (HGT), (2) unhealthy granulation tissue (UGT), (3) whitish slough, (4) yellowish‑green pigmentation (G1), (5) bluish‑green
pigmentation (G2), (6) fat (F), (7) brown necrotic tissue (BNT),
selected randomly from various wounds and is displayed in Figure 1 for the purpose of illustration.
The concept of identifying the tissue types based on pigmentation involves first building a reference base, that is, a labeled set of clusters in the HSI space, based on a large number of pixels per category from many wound images as judged by an experienced plastic surgeon. Prior to calculating the HSI parameters, the RGB components must be calibrated to account for variations due to “local” or “global” factors.[11] Local variations occur due
to variations in the angle and the distance of the camera from the wound. Global variation arises due to factors like ambient light. All of the wound images were taken by the same camera under similar conditions. Ignoring local variations, the RGB components have been calibrated for global variations, as suggested by Wannous et al.[11] by
exploiting the white patches available in the vicinity of the wound in some of the images. The corrected values were used to compute the values of H, S, and I. Each pixel within the wound is represented by a 3‑element vector (a point) in the HSI space. Points corresponding to a given tissue type or pigmentation, as decided by an expert based on its color, form a cluster.
Classification
Classification by distance‑based approaches is considered as the clusters were found to be fairly distinct.
The first approach is based on the Mahalanobis distance (MD).[21] This measure recognizes that some
variables may suffer larger variance than the others due to differences in numerical values, variances and their inter‑relationships (if any). Indeed, MD takes into account the shape of each of the clusters, information about which is embedded in the covariance matrix. The expression for MD between the observation vector x and a cluster “i” with mean µi and covariance matrix Ci, is given by:
2 -1
i i i i
( , ) ( ) ( )
d xµ = x−µ C x−µ (2)
Note that the contours of constant density (three‑dimensional histogram) are hyperellipsoids of constant MD from µi.[22]
Another method, the RCS method, is considered based on its philosophy, its success in machine vision applications,[19]
and for the sake of comparison. It uses a metric derived by transforming the coordinates of the cluster space, such that the intra‑class samples are clustered closely, and inter‑class samples are separated. The transformation involves rotation and scaling of the axes, such that one
axis lies along that of minimum variance and another along that of the maximum. The optimum rotated coordinate axes may be shown to lie in the directions of the orthogonal eigenvectors of Ci, and scaled by the inverse of the respective eigenvalues. The theoretical considerations outlined in the preceding result in the following distance metric between the observation‑vector x and a cluster “i” with mean µi:
λ λ
=
= − µ
µ = Π 2
∑
3 2 +2 3 3 i
i 1
1
[( ) ] ( , ) ( ) { 3}
T k
j j
k k
x
d x e (3)
Where ek and γk are the kth eigenvectors and the
eigenvalue of Ci. Note that γk happens to be the variance
of the sample points in the direction of ek. Scaling the transformed axes by the inverse of the respective eigenvalues is, therefore, logical. The relation of this approach to statistical decision theory is seen when one notes that the minimum (Euclidean) distance classification in the new space amounts to maximum likelihood classification after fitting Gaussian density to the data.[19]
Classification of a color pixel specified by the vector x of HSI values is performed by assigning it to the cluster having the smallest value of d (x, µi)
RESULTS
The reference clusters were built by using 48 reference images of chronic wounds of various types, acquired under daylight, by a digital camera (Sony DSC P9) with flash. About 9,000 pixels (>1,000/category) were assigned to one of the eight categories. Samples of the eight types of tissue and pigmentation are displayed in Figure 1. The calibrated RGB values of each of the pixels were recorded against the category. The calibration factors were 1.0162 (red), 1 (green) and 1.016 (blue). After rejecting the pixels (with I > 233) associated with reflections from flash, the values of H, S and I, associated with each pixel, were computed, and that of H was modified (as per Equation 1).
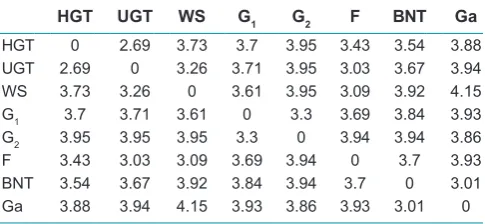
Views of the clusters in two different orientations are displayed in Figure 2. It is very important to observe the presence of eight clusters and that they are fairly distinct. HGT and UGT lie within a narrow hue (red) but spread only over saturation. Not surprisingly, they are close to each other. In fact, the appearance or disappearance of various colors over time allows one to assess the evolution of the wound toward a state of healing or otherwise. To assist in a quantitative understanding of the clusters, the values of inter‑cluster distance are displayed in Table 1. The inter‑cluster distance,[23] based on the MD
measure, between clusters i and j, is given by: −
− 1 −
i j i j ij i j
( , ) ( ) ( )
2 T
ij
d x x = x x C x x (4)
where xi and xj are the means of the clusters i and j, respectively, and Cij is the pooled covariance matrix. The pooled covariance matrix was computed based on the data associated with both of the clusters iand j (considered as one group), rather than considering it to be a weighted average of the covariance matrices associated with the
Figure 1: A sample each, of the eight categories of tissue
individual clusters, as suggested by Hertzog period.[24] The
distances agree with the visual (geometric) separations. The distance between HGT and UGTs is the smallest. The cluster associated with UGT appears to consist of two lobes, though over a narrow range of hue, because the color associated with the unhealthy bed can vary slightly due to poor vascularity, infections, etc. Clinically, considering UGT to consist of two clusters is therefore unnecessary. Instead, this is addressed mathematically through an algorithm that exploits cluster shape.
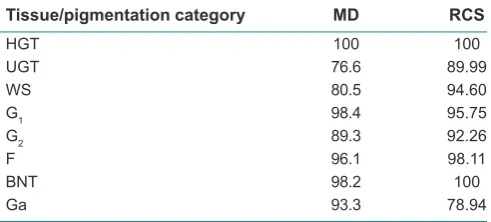
To test the efficacy of the proposed algorithms, a set of 15 test images were used to perform 120 experiments (15/category). Each experiment began with the selection of a relatively homogenous region of interest (ROI), selected randomly from the test images. A visual estimate of the composition (in terms of the percentage of the main tissue/pigmentation) was declared by one author who was blinded to the selection of the ROI. The ROI was subjected to estimation of its composition by the algorithms described in this paper. The performance of the algorithm in terms of accuracy of the estimates is defined by:
= − ∑ −
=
exp
1
1
%Match [ 1 v c | ] ×100 i i
exp
N
| E E
N i (5)
where EVi and ECi are the fractional estimates (visual and computer‑assisted) of the tissue and pigmentation composition, and Nexp is the number of experiments
(15 in this case). The values of %Match were computed using both methods and Table 2 lists the values obtained. The relatively poor performance with respect to UGT and Ga may be attributed to the absence of a tight cluster in the first case, and a large spread in the second. Indeed, both are difficult to judge visually; UGT is close to HGT in color, and Ga is very dark to allow easy identification of its hue. To understand the behavior quantitatively, the inter‑cluster MDs were calculated as listed in Table 1. One may observe that the distances between HGT and UGT, Ga and BNT, are relatively small.
DISCUSSION
In this paper, there was no attempt to refine the cluster structure in the HSI space, by breaking apparently disjointed clusters or joining those close to each other, as reported by Nayak et al.[14] Modifying the clusters is
not meaningful, as some color spread is natural.[2] Such
variations are captured in the cluster shapes and are incorporated in the algorithms proposed in this paper. Although we experimented with the inter‑quartile range, retaining central tendencies, and the improvement in the accuracy of classification was not significant.[20]
There are some limitations in the presented study. As reported, a modified HSI space was used, which involves a shift of the origin. This approach suggested by Hoppe et al.[8] ensures a continuous value for hue, which
is used as a parameter. The choice of the origin and the minimal range of hues was based on empirical observations of data involving nearly 9,000 pixels. While there could be some change in the precise values attributed to the camera and ambience, color calibration can account for such variations. Indeed, variation associated with the range of hues is minimal in comparison with the other parameters.[8] However, it would be interesting to find an
approach to determine the values of the parameters to facilitate a shift of the origin. Further, simulated images and varying ambience could be used to test the efficacy of the values derived by such a method.
To validate the algorithms, randomly selected and blinded ROIs were used to mitigate bias. Nevertheless, the approach presented has limitations; specifically, it
Table 1: Values of inter-cluster MD in the HSI space
HGT UGT WS G1 G2 F BNT Ga
HGT 0 2.69 3.73 3.7 3.95 3.43 3.54 3.88
UGT 2.69 0 3.26 3.71 3.95 3.03 3.67 3.94
WS 3.73 3.26 0 3.61 3.95 3.09 3.92 4.15
G1 3.7 3.71 3.61 0 3.3 3.69 3.84 3.93
G2 3.95 3.95 3.95 3.3 0 3.94 3.94 3.86
F 3.43 3.03 3.09 3.69 3.94 0 3.7 3.93
BNT 3.54 3.67 3.92 3.84 3.94 3.7 0 3.01
Ga 3.88 3.94 4.15 3.93 3.86 3.93 3.01 0
HIS: Hue, saturation, and intensity, MD: Mahalanobis distance, HGT: Healthy granulation tissue, UGT: Unhealthy granulation tissue, WS: Whitish slough, G1: Yellowish green pigmentation, G2: Bluish green
pigmentation, F: Fat, BNT: Brown necrotic tissue, Ga: Gangrene
Figure 2: (a) A view of the three‑dimensional clusters in the hue, saturation, and intensity space, showing various tissue‑categories; (b) another view
of the clusters in the hue, saturation, and intensity space from a different orientation. These two views show all the tissue categories, and that the clusters are fairly distinct
would be useful to take a consensus of multiple operators for segmenting clusters for training, and use different operators for selecting ROIs for a more robust validation of the algorithms.
In conclusion, this paper establishes eight categories of color due to tissue types and pigmentation, more than those based on the commonly used 4‑color model. The results were based on a knowledge base built using the one‑to‑one correspondence between tissue types pigmentation, and color. The (modified) HSI model was used because it better represents the physician’s perception of color, in addition, to resolving the information into eight useful categories. The resulting eight categories provide a better representation and assessment of wound health and minimize error in judgment due to misclassification of unidentified tissue types and pigmentation. Segmentation of wounds would be very useful for monitoring and objective recording of various phases of wound healing and the response to treatment protocols.
Acknowledgments
We are grateful to the critical remarks and suggestions of the reviewers, who have gone through the material in great detail. The data reported in this paper were collected by the second author while he was the Head of the Department of Plastic Surgery and Burns, Kasturba Medical College, Manipal University, Manipal.
Financial support and sponsorship Nil.
Conflicts of interest
There are no conflicts of interest.
REFERENCES
1. Arnqvist J, Hellgren L, Vincent J. Semiautomatic Classification of Secondary Healing Ulcers in Multispectral Images. Proceedings of 9th International Conference on Pattern Recognition, 1988 November, 14‑17. Rome, New York: IEEE; 1988. p. 459‑61.
2. Herbin M, Bon FX, Venot A, Jeanlouis F, Dubertret ML, Dubertret L,
Strauch G. Assessment of healing kinetics through true color image
processing. IEEE Trans Med Imaging 1993;12:39‑43.
3. Berris WP, Sangwine SJ. Automatic Quantitative Analysis of Healing Skin
Wounds Using Colour Digital Image Processing. World Wide Wounds,
1997; Available from: http://www.worldwidewounds.com/1997/july/Berris/ Berris.html. [Last accessed on 2015 Apr 12].
4. Mekkes JR, Westerhof W. Image processing in the study of wound healing.
Clin Dermatol 1995;13:401‑7.
5. Jones BF, Plassmann P. An instrument to measure the dimensions of skin
wounds. IEEE Trans Biomed Eng 1995;42:464‑70.
6. Hansen GL, Sparrow EM, Kokate JY, Leland KJ, Iaizzo PA. Wound
status evaluation using color image processing. IEEE Trans Med Imaging
1997;16:78‑86.
7. Berris WP, Sangwine SJ. A Colour Histogram Clustering Technique for Tissue Analysis of Healing Skin Wounds. Proceedings of the 6th International Conference on Image Processing and its Applications, 1997 July 14‑17. Vol. 2. Dublin, New York: IET; 1997. p. 693‑7.
8. Hoppe A, Wertheim D, Melhuish J, Morris H, Harding KG, Williams RJ. Computer Assisted Assessment of Wound Appearance Using Digital Imaging. In: Proceedings of the 23rd Annual International Conference of the IEEE Engineering in Medicine and Biology Society, 2001 October, 25‑28. Istanbul, Turkey; 2001. p. 2595‑7.
9. Oduncu H, Hoppe A, Clark M, Williams RJ, Harding KG. Analysis of
skin wound images using digital color image processing: a preliminary
communication. Int J Low Extrem Wounds 2004;3:151‑6.
10. Varedas FJ, Mesa H, Morente L. A hybrid learning approach to tissue recognition in wound images. Int J Intell Comput Cybern 2009;2:327‑47. 11. Wannous H, Trelluillet S, Lucas Y. Robust tissue classification for reproducible
wound assessment in telemedicine environments. J Electron Imaging
2010;19:1‑9.
12. Dorileo EAG, Frade MAC, Rangayyan RM, Azevedo Marques PM. "Segmentation and Analysis of Tissue Composition of Dermatological Ulcers", Proceedings of the Canadian Conference on Electrical and Computer Engineering, Calgary, Canada, May 2010. p. 1‑4.
13. Pereira SM, Frade MA, Rangayyan RM, Marques PM. Classification of
Dermatological Ulcers Based on Tissue Composition and Color Texture
Features. Proceedings of the 4th International Symposium on Applied
Sciences in Biomedical and Communication Technologies, 2011 October
26‑29. Barcelona, Spain. New York: ACM; 2011. http://dl.acm.org/citation. cfm?id=2093766&preflayout=tabs. [Last accessed on 2015 Aug 27]. 14. Nayak R, Kumar P, Galigekere RR. Towards a Comprehensive Assessment
of Wound Composition by Color Image Processing. Proceedings of the 4th International Conference on Image Processing, 2009 November 7‑10. Cairo, Egypt, New York: IEEE; 2009. p. 4185‑8.
15. Veredas F, Mesa H, Morente L. Binary classification on wound images with neural networks and bayesian classifiers. IEEE Trans Med Imaging
2010;29:410‑27.
16. Mukherjee R, Manohar DD, Das DK, Achar A, Mitra A, Chakraborty C. Automated tissue classification framework for reproducible chronic wound
assessment. Biomed Res Int 2014;2014:851582.
17. Kolesnik M, Fexa A. How Robust is SVM Wound Segmentation? Proceedings of the 7th Nordic Symposium on Signal Processing, 2006 June, 7‑9. Rejkjavik, New York: IEEE; 2006. p. 50‑3.
18. Gonzalez RC, Woods RE. Digital Image Processing. 3rd ed. Delhi: Prentice Hall; 2007.
19. Dubois SR, Glanz FH. An autoregressive model approach to two‑dimensional shape classification. IEEE Trans Pattern Anal Mach Intell 1986;8:55‑66.
20. Herbin M, Venot A, Devaux JY, Piette C. Color quantitation through image
processing in dermatology. IEEE Trans Med Imaging 1990;9:262‑9.
21. Raykov T, Marcoulides GA. An Introduction to Applied Multivariate Analysis. New York: Routledge Taylor and Francis Group; 2008.
22. Duda RO, Hart PE, Stork DG. Pattern Classification. 2nd ed. Hoboken:
Wiley; 2001.
23. Gashaw A, Mohammed H, Singh H. Genetic divergence in selected durum wheat genotypes of Ethiopian plasm. Afr Crop Sci J 2007;15:67‑72. 24. Hertzog C. On pooling covariance matrices for multivariate analysis.
Educ Psychol Meas 1986;46:349‑52. Table 2: %Match of the visual and computer assessments,
for various categories of tissue and pigmentation
Tissue/pigmentation category MD RCS
HGT 100 100
UGT 76.6 89.99
WS 80.5 94.60
G1 98.4 95.75
G2 89.3 92.26
F 96.1 98.11
BNT 98.2 100
Ga 93.3 78.94
MD: The method based on Mahalanobis distance, RCS: The rotated coordinate