Vol. 14, 2018, 1-10
ISSN: 2349-0632 (P), 2349-0640 (online) Published 6 August 2018
www.researchmathsci.org
DOI: http://dx.doi.org/10.22457/jmi.v14a1
1
Journal of
On Languages Distribution
Bi-chuan JiangDepartment of Applied Mathematics, Chongqing University of Posts and Telecommunications
Chongqing 400065, Chongqing, China. E-mail: [email protected]
Received 20 June 2018; accepted 31 July 2018
Abstract. In this paper, we studied the distribution of global languages; we set up a
multivariate prediction model to predict the number distribution of languages. A multivariate dynamic rough model was used to predict the geographic distribution of languages, and predict the distribution of language in the next 50 years.
Keywords: Wavelet neural network; rough set; prediction; gray technology AMS Mathematics Subject Classification (2010): 00A71
1. Introduction
There are currently about 6,900 languages spoken in the world. The trend of globalization not only profoundly changes the economy and society, but also affects the trend of language development. Currently, more than 90% of Internet information is in English; More than 60 countries make English the official or semi-official language; It is also the main language of diplomatic and international trade. These factors, coupled with economic development, geographical endowments, government promotion and other factors, Make English to world lingua franca. However, some languages have disappeared. The number of languages has been constantly decreasing. Therefore, in our globalized world, it is of great research significance that people study the changes in the distribution pattern of languages.
2
In this paper, we set up a multivariate prediction model to predict the number distribution of languages. A multivariate dynamic rough model was used to predict the geographic distribution of languages. To better study the distribution of global language in changing trends.
2. Population distribution
In order to simulate the distribution of various speakers according to the forecasting trend, we describe the number distribution and spatial distribution. As the population growth rate of the birthplace of language directly affects the number of people, this factor has a direct relationship with the distribution. The more developed the economy of origin is, the more traffic there will be in the region and the closer the economic exchanges will affect the language distribution. The larger the number of language learners, the more closely it is distributed. The larger the number of people who move into the language in each year, the greater the number of people who study the language, thus these are affecting the distribution of the language. Large companies play a crucial role in international exchanges, language requirements are also very strict. Therefore, the proportion of the members of a large corporation is also related to the language distribution.
Through the above description, we extract the impact of five major factors on language distribution: population growth rate, GDP, number of language learners, number of residents who move in, and composition ratio of language of large-sized companies.
2.1. Improved wavelet neural network structure
We first consider the BP neural network three-tier structure, the data are trained to achieve the trend prediction of various languages. Because the historical data of the influencing factors have the characteristics of randomness and non-linearity, and the importance of each factor on the predictive objects is also different, with gray causality, and the original sequence of the predicting objects is concrete and has the ginkgo character. In the sample Small capacity and small sample information will reduce the prediction accuracy of the wavelet network model, so we embed the ashing layer at the input end to weaken the randomness of the observed data and enhance the regularity of the data.
In order to describe the quantitative distribution of various languages, we establish the following multi-factor prediction model of fusion of gray technology and wavelet neural network.
2.1.1. Build wavelet neural network
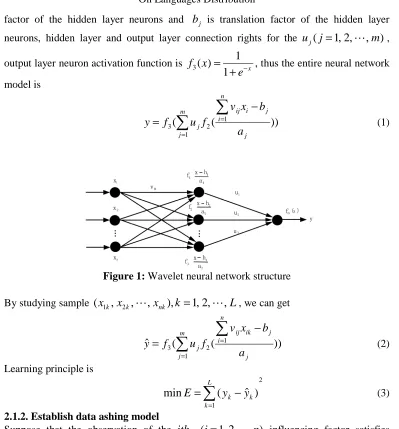
We are considering the three-layer structure of BP neural network, thus we construct a neural network that uses wavelet bases instead of neuron activation functions, input variable is X =(x1,x2,⋯,xn) and output variable Y,the neuron activation function of
the input layer is set as a linear function f1(x)=x, input layer and hidden layer
connection rights for the vij(i=1,2,⋯,n; j=1,2,⋯,m), the hidden layer neuron
activation function is set to Morlet function
) 2 ( 2
2 ) 75 . 1 cos( ) (
x
e x x
3
factor of the hidden layer neurons and bj is translation factor of the hidden layer
neurons, hidden layer and output layer connection rights for the uj(j=1,2,⋯,m),
output layer neuron activation function is x
e x f − + = 1 1 ) (
3 , thus the entire neural network
model is ( ( )) 1 1 2 3
∑
∑
= = − = m j j n i j i ij j a b x v f u fy (1)
Figure 1: Wavelet neural network structure
By studying sample (x1k,x2k,⋯,xnk),k=1,2,⋯,L, we can get
ˆ ( ( )) 1 1 2 3
∑
∑
= = − = m j j n i j ik ij j a b x v f u fy (2)
Learning principle is
2 1 ) ˆ ( min
∑
= − = L k k k y yE (3)
2.1.2. Establish data ashing model
Suppose that the observation of the ith (i=1,2,...,n) influencing factor satisfies
N t
Xi,t ≥0,=1,2,⋯, , the data is ashed using the first-order accumulation technique, the data ashing model is A.
N i X X t k k i t
i 1,2,..., 1 , ) 1 ( , =
∑
= =Then we can get
N t n i X X t k k i t
i 1,2, , ; 1,2, , 1 , ) 1 ( , =
∑
= ⋯ = ⋯ = n i XXi i,1 1,2, , ) 1 ( 1 , = = ⋯ N t n i X X
4
the prediction object original data sequence Yt t=1,2,⋯,N remains unchanged.
2.1.3. Establish wavelet neural network model
The gray data of the influencing factors and the original value of the forecasting object
) , , 2 , 1 ( ) ; , , ,
(X1(,1t) X2(1,t) ⋯ Xn(1,t) Yt t= ⋯ N are used as learning samples to train the above wavelet neural network and we can get the wavelet network model:
) ) ˆ ˆ ˆ ( ˆ ( 1 1 ) 1 ( 2 3 ) 1 (
∑
∑
= = − = m j j n i j i ij j a b X v f u fY (4)
2.1.4. Establish a predictive model
Using the ashing model, ashing of the raw data X =(x1,N+1,x2,N+1,⋯,xn,N+1) of the
influencing factor N + 1 is as follows:
n i
X X
XˆiN iN i,N 1 1,2, , ) 1 ( , ) 1 ( 1 , + = + + = ⋯
The ashed data (Xˆ1(,1N)+1,Xˆ2(1,)N+1,⋯,Xˆn(1,)N+1) is substituted into the wavelet neural network to obtain the gray prediction value:
)) ˆ ˆ ˆ ˆ ( ˆ ( ˆ 1 ) 1 ( 1 , 2 1 3 1 j n i j N i ij m j j N a b X v f u f Y
∑
∑
= + = + −= (5)
That Y in the N + 1 period of the forecast value.
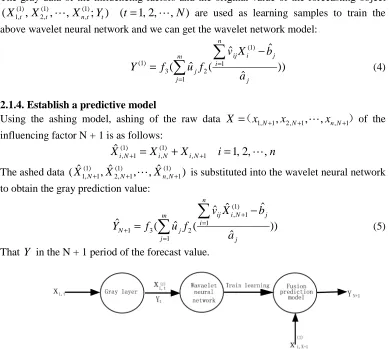
Figure 2: Multi-factor Forecasting Model on the Integration of Grey
Technology and Wavelet Network
Using the multivariate prediction model established above, we can predict the 26 languages using MATLAB. First, we predict the influencing factors and then substitute the predicted influencing factors into the model, so we can predict the number of native speakers and total language speakers in the next 50 years respectively, and we have carried on the screening to the earliest language kind, to some commercial communicative language and the local dialect because they have not the language form essentially. Therefore, we eliminated these languages and did not participate in the rankings, that is, the number distribution trend in 19 languages was obtained.
5
Table 1: The total number of native speakers of English and Mandarin each year
years 2019 2020 2021 2022 2023 2024 2025 2026 2027 2028 number1 387 418 415 474 482 481 492 499 521 535 number2 896 902 913 911 923 934 931 974 958 997 years 2029 2030 2031 2032 2033 2034 2035 2036 2037 2038 number1 576 572 610 647 641 684 685 721 741 762 number2 1018 1023 1075 1103 1175 1215 1347 1399 1405 1426
years 2039 2040 2041 2042 2043 2044 2045 2046 2047 2048 number1 755 784 799 797 801 827 833 829 855 867 number2 1445 1472 1497 1503 1529 1542 1554 1558 1562 1577
years 2049 2050 2051 2052 2053 2054 2055 2056 2057 2058 number1 873 884 892 901 923 944 956 949 959 967 number2 1578 1642 1588 1692 1726 1842 1833 1876 1992 1997
years 2059 2060 2061 2062 2063 2064 2065 2066 2067 2068 number1 987 996 1001 1018 1026 1084 1160 1247 1289 1302 number2 2103 2127 2247 2274 2310 2341 2394 2394 2401 2441
Number1 indicates the number of native speakers in English, number 2 indicates the number of native speakers in Mandarin Chinese. Other results can be obtained in the same way. Thus, we can get the change of the number of native speakers in the next 50 years.
From the above results we can see that most languages will increase over time, with fewer languages going down. Due to local economic conditions and the war and other reasons, leading to fewer and fewer speakers. And we can conclude that in the short term, any of the top ten lists will not be replaced by other languages, but for a long time there will be situations in which the language will be replaced by the latter.
We can then use the same model to get the total number of speakers in each language (Unit: million):
Table 2: The total number of people who speak English and mandarin each year
Years 2019 2020 2021 2022 2023 2024 2025 2026 2027 2028
6
Number 1 indicates the number of native speakers in English, number 2 indicates the number of native speakers in Mandarin Chinese.
From the above results, we can see that most of the languages will increase over time, fewer languages will be declining, and the number of native speakers will be much smaller than that of the second language. For example, the number of people who predict English is more and more. Although the number of people who learn Mandarin is also steadily rising, those who may learn English may get more and more after long-term prediction More, leading to more people than mandarin. And we can also conclude that in the short term, any of the top ten lists of languages will not be replaced by other languages, but for a long time there will be cases where the language will be replaced by a later language.
To sum up, we can conclude that, the top ten list languages will be replaced by other languages, we have to consider the above factors, to find out why:
(1) Due to the respective policies of the country, or the social environment of the country, the conditions of war and other factors, the population growth rate in the area will cause significant differences or negative growth, resulting in a decrease in the number of people learning the language.
(2) For GDP, showing the country's economic status, etc., it has a direct impact on the country's exchange and development.
(3) The rate of studying abroad and the rate of population migration also lead to cultural exchanges and affect the ranking of languages.
2.2. Multifactor dynamic prediction models based on rough sets
Due to the great incompleteness and uncertainty of the geographical distribution itself, we introduce a rough set to predict the geographical distribution trend of the language. Combining the dynamic characteristics of geographical distribution and the data analysis techniques of the rough set, we obtain the following geographical distribution Multi-factor Dynamic Rough Prediction Model:
We assume that the ratio of a language in the region isy, influenced by m factors, which isX =(x1,x2,⋯,xm).ut =(x1,t,x2,t,⋯,xm,t;yt),t=1,2,⋯,nis composed of the ratio value of language in the t period and the value of its influencing factors.
Based on the principle of pattern recognition, we can assume that there is an indeterminate relationship between variables X and Y:
) ( X
F Y =
X and Y are discrete random variables, and we can get
) , , , (
, N 1 2 N
M
M y X x x x
Y = = ⋯
2.2.1. Create a decision data table
We regard the factors that influence the geographical distribution of language as the condition attributes of rough set theory, that is, C={x1,x2,⋯,xm};Language area
7
Thus, we can get xi,t as the condition attribute xi on the attribute value of the object
t
u . yt is the decision attribute y on the attribute value of the object ut. The decision
table S=<U,C,∪D> is obtained, which is the decision data table model.
2.2.2. Attribute value characterization, reduction condition attribute set C
According to the attribute dependency calculation formula, you can get the dependency degree of the decision attribute dependent on the condition attribute:
) ( )) ( ( ) ( U card D POS card D C C =
γ
(6)if x0 is the redundant attribute D of C. As a result, we have achieved the impact of the
geographical distribution of abbreviated languages.
2.2.3. Extract decision rules
Suppose that the condition attribute reduction set is C∗. From the corresponding decision table U available classification set and basic decision rule set, which
} Y , , Y , {Y / }, X , , X , {X
/ = 1 2 ⋯ N = 1 2 ⋯ M
∗ D U C U } , , 2 , 1 ; , , 2 , 1 | ) , )( ( ) ( :
{ 0 (0) (0)
) 0
( r Des X Des Y V i N j M
G = ij C∗ i → D j i
µ
ij = ⋯ = ⋯ )( i C X
Des ∗ is the pattern description of attribute C∗ for pattern Xi,DesD(Yj) is the
pattern description of attribute D for pattern Yj,
µ
ij(0) represents the confidence of adecision rule established estimates, vi(0) represents the coverage of the corresponding
conditional attribute pattern in the decision table.
2.2.4. Establish a multi-factor dynamic rough forecasting model
We characterize x1,(n+1),x2,(n+1),⋯,xm,(n+1). The corresponding object in the decision data
table is set to un+1, we are using the closeness between the object u(n+1) and the influencing factors of the decision rules
γ
C∗,i(u(n+1)), and make use of the uncertain lawbetween the mode of influence and the problem, we can build predictive models. So we set up the following forecasting model:
ˆ ( ) ( ) 1 ) 0 ( , 1 ) 1 ( , ) 1
( D j
M j j k N k n k C
n u Des Y
y =
∑
∑
×=
= +
+
λ
∗µ
(7)and k N v u v u u N i i n i C k n k C n i
C , 1,2, , ) ( ) ( ) ( 1 ) 0 ( ) 1 ( , ) 0 ( ) 1 ( , ) 1 ( , = = ⋯
∑
= + + + ∗ ∗ ∗γ
γ
8
Indicates the weight of the forecast mean ( ) 1
) 0 (
, D j
M
j j
k ×Des Y
∑
=
µ
to which the influencingfactor pattern Xk responds.
) ( )
( 1
1 )
(
) 1 ( )
1 ( ,
i C n
C n
i C
X Des u
Des u
∗ ∗
∗
− +
=
+ +
γ
(9)Through the above-mentioned multi-factor dynamic rough forecasting model, we can predict the geographic distribution of languages and get the geographical distribution trend of languages. We conclude the following factors: population growth, GDP , number of language users, area moved into the number and area moved out.
We consider two aspects of the geographical distribution of languages: the description of the proportion of language in seven continents and the proportion of languages in a country. So as to carry on the description of the linguistic geographical distribution tendency through these two aspects.
In the first case, we choose to analyze English and use the data from 2010 to 2017 to divide the continents into regions. We predict the proportion of the total number of people who use English in each of the next few years. Based on the above multi-factor dynamic The rough prediction model has the following results:
Table 3: The distribution of English in seven continents in 2018
island Asia Europ e
North America
South America
Africa Oceania Antarctic a
proportion 0.75 0.90 0.78 0.62 0.37 0.93 0
Table 4: The distribution of English in seven continents in 2019 island Asia Europ
e
North America
South America
Africa Oceania Antarctic a
proportion 0.72 0.89 0.78 0.62 0.35 0.92 0
9
For the second case, we take the region to conduct an analysis for China. Based on the estimates of the languages in the top 10 lists in 2018, we predict the proportion of the total number of people in each of the next few years and get the following results:
Table 5: The distribution of the top ten languages in China in 2018
Mandrin Chinese
Spanish English Hindustani Arabic
0.97 0.21 0.72 0.23 0.12
Bengali Portuguese Russian Punjabi Japnese
0.14 0.09 0.29 0.1 0.23
Figure 5: The distribution of the top ten languages in China in 2018
We can get the above chart, most commonly used in China is the Mandarin, followed by the most commonly used is English, the other ten languages on the list of languages in China there is a certain percentage, with a certain diversity, and more diverse languages.
To sum up, we predict and study the number distribution and geographical distribution of languages respectively, and get the development trend of each language in the world.
3. Test: test difference test
1. The basic test process is as follows: x(0)is the original sequence, ˆx(0) is the model simulation sequence, and
ε
is the residual sequence. In whichε
(k)=x(0)(k)−xˆ(0)(k),the relative error sequence is∆=(∆1,∆2,⋯,∆n) , and
) (
) (
) 0 (
k x
k
k
ε
=∆ and ∆k are the
relative error of the K point, and the
∑
− ∆ =
∆ n
k k
n 1 1
is the average relative error, and
∆ − =1
10
We use the data after the test for three years to get C=0.1790969, P=1, due to
95 . 0 ,
35 .
0 >
< P
C , so the prediction result is excellent.
2. We also get from the above residual analysis C=0.3217, P=0.9514, because of
95 . 0 ,
35 .
0 >
< P
C , so the forecast result is qualified.
Acknowledgements. This work is supported by the National Natural Science Foundation
of China (No. 70471057) and the Natural Science Foundation of Education Department of Shaanxi Province (No. 03JK065).
REFERENCES
1. Lei An, Optimization of corporations in enterprise value assessment, Capital
University of Economics and Business, 72 (2017) 51-61.
2. X.C.Deng, Vector optimization problems: all-round stability, good qualitative and sensitivity analysis, Guizhou University, 191(6) (2016) 37-68.
3. Jiang Guo, Based on the distribution of cross-language cross-task natural language analysis, Harbin Institute of Technology, 391(2) (2017) 324-681.
4. Changzhu Huang, Global languages in the context of globalization: changes in the use and distribution pattern, Foreign Social Sciences, 7(6) (2009) 4-17.
5. Jie Jie, 75 years of China's population distribution of time and space and changes.
Beijing University of Architecture, 3(4) (2015) 384-395.
6. Ruliang Liu, Renan Jia and Qiuxian Dong, Improvement of population migration model and simulation of system dynamics simulation, Mathematics and Practice, 2(18) (2008) 128-133.
7. Baojia Li, On the historical evolution of the dialect pattern of Chinese dialect,
Journal of Jilin Normal University, 7(3) (2004) 53-58.
8. Deqin Liu, Yu Liu and Xinyu Xue, Population distribution and spatial correlation analysis in China, Science and Geomatics, 2004 (S1) 76-79.
9. Bin Li, Population migration algorithm based on artificial fish swarm algorithm,
Wuhan University of Technology, 2(4) (2008) 28-75.
10. Xiaoqing Su, Jinggong Xu, The influence of geographical changes on the dialect distribution pattern-take pizhou dialect in Jiangsu as an example, Journal of Xuzhou
Institute of Technology, 7(7) (2015) 293-304.
11. Zhi Xiao and Yulan Ye, A multi-factor dynamic prediction model for tourism demand, Statistics and Decision, 7(12) (2005) 33-34.
12. Lei Yan, Bo Zhong, Huiliang Luo and Bangjun Lei, Multifactor prediction model of fusion of gray technology and wavelet network, Journal of Shanxi Normal University, 28(6) (2012) 215-210.
13. Shanshan Zhang, Classification of spatio-temporal data model of geographic information system, Proceedings of Surveying and Mapping Science, 37(4) (2012) 215-217.
14. Qun Zong, Model checking based on residual analysis Chinese, Journal of Control