Interactive Visualisation of Water Distribution
Network Optimisation
Matthew B. Johns
1, David J. Walker
1, Edward Keedwell
1and Dragan
Savić
11Centre for Water Systems, University of Exeter, Exeter, UK.
[email protected], [email protected], [email protected], [email protected]
Abstract
Evolutionary algorithms have been used to optimize water systems in the literature for over three decades. However, their use for solving real-world water system problems in industry is still very limited. The work presented in this paper details the development of an interactive visualisation client for water distribution network design, which is part of a larger project to bring EAs closer to practicing engineers. The system aims at engaging engineers by actively involving them in the optimization process through the use of advanced visual analytics and novel interactive evolution techniques.
1
Introduction
Water Distribution Networks (WDNs) are complex systems that are hard to model and optimise as they consist of many interacting components each with a set of considerations to address, hence it is important for the engineer to understand and assess the behaviour of the system to enable its effective design and optimisation. A common approach to the optimisation of WDNs is to apply an automated technique such as an Evolutionary Algorithm (EA) to generate solutions. However, it is often difficult to effectively generate solutions suitable to real-world application without substantial intervention on the part of the engineer. The Human-Computer Optimisation for Water Systems Planning and Management (HOWS) project* aims to address this by actively involving the engineer in the
optimisation process through a combination of interactive optimisation, visualisation and machine learning techniques. This paper presents the Interactive VISualisation (IVIS) component of the HOWS platform and demonstrates how it can be employed by the engineer to visualise and interact with an EA.
* See http://www.howsproject.uk for more details.
Volume 3, 2018, Pages 995–1003
2
Background
It is evident from the literature that the use of evolutionary algorithms to solve real-world water systems engineering problems is a growing area of focus. However, as a number of researchers have highlighted (Marchi, Salomons, Ostfeld, Kapelan, & Simpson, 2014), as problem complexity grows so does the need for the inclusion of domain specific knowledge to ensure high quality practical solutions. Although some researchers in the field of Hydroinformatics have started to explore the use of water systems knowledge to aid in the optimisation of water distribution network design problems, the focus of knowledge application is mainly concentrated on the generation and variation of solutions using predefined heuristics.
Another hurdle facing the application of EAs to real-world WDN problems is industry uptake, which lags behind progress in the academic field. Although practising engineers have started to utilise techniques such as EAs for the optimisation of real-world problems, they often see the EA as a “black box” that generates solutions to aid in the design process, with little scope for input from the engineer on how that solution is reached. It is proposed that providing engineers with a greater insight into how an EA operates in the design space will result in better understanding and pave the way for greater interaction between engineer and algorithm.
Much research has been conducted into the visualisation of objective and decision spaces (Keedwell, Johns, & Savic, 2015) however, less research has been conducted into the visualisation of the design space, especially with the view to engaging the end user; this is particularly apparent in the field of Hydroinformatics.
3
Interactive Visualisation of Water Distribution Network
Optimisation
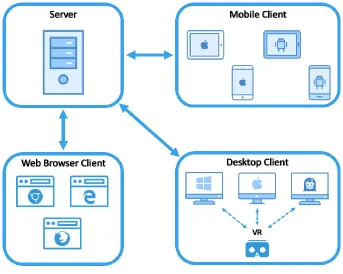
The HOWS platform consists of two core components, the Interactive Visualisation (IVIS) client and the Server. The system is designed to enable an engineer to actively participate in the optimisation of Water Distribution Network design and operation problems, effectively putting an experienced engineer in the loop, with the view of promoting engineering feasible solutions which have increased real-world application potential. In addition to this the system is designed to actively learn from the actions of the engineer using a host of pattern matching and machine learning techniques to further the effectiveness of optimisation algorithm and engineer.
3.1
HOWS System Architecture
3.2
Water Distribution Network Visualisation
The HOWS interactive visualisation client provides the engineer with the ability to view and interact with three-dimensional representations of pipe-based water systems. The system employs a range of innovative methods to convey information to the user resulting in the ability to simultaneously display more useful information than traditional two-dimensional plan view network representations.
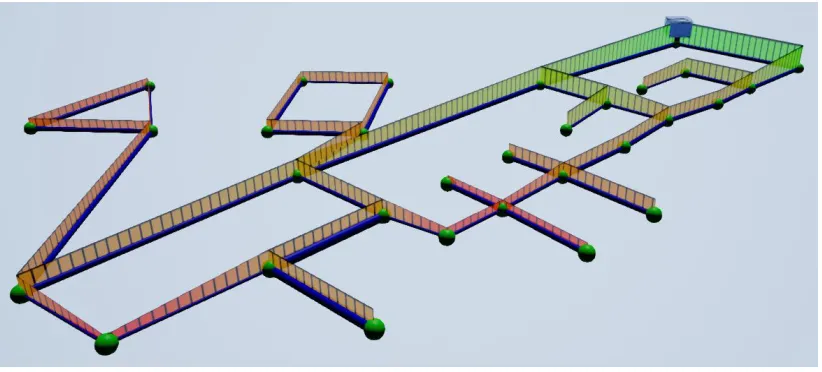
Figure 2a shows a plan view visualisation of the Exnet network produced by EPANET 2 which utilises colour coding to show a selected aspect of the network, e.g. diameter, elevation, velocity, pressure etc. Although more sophisticated visualisations exist within commercial packages in the industry, this plan view of the network is typical of the visualisations of water distribution networks. Unlike in 2D plan view visualisations, the use of a 3 dimensional domain ensures spatial elements such as distances, pipe diameters, lengths and crucially the elevation of elements, are visualized implicitly without recourse to colour coding or other artificial mechanisms. This effect is illustrated in Figure 2b, a 3D visualisation of the Exnet network produced by HOWS IVIS. When viewing this network in 3D, elevation information becomes immediately apparent. Also notable is that the diameters of the pipes can be seen in the visualisation. This implicit visualisation allows the user to immediately identify elements in the network such as the trunk mains running from the two reservoirs and although this information can be seen in the EPANET 2 visualisation, the colour of the junctions and pipes is still available to convey addition network functionality to the user.
It is vital that system information is conveyed to the engineer in an effective way. To enable this, the key principles of display design presented by Wickens et al. (Wickens, Lee, Liu, & Gordon-Becker, 2003) were used when designing the geometry that would represent the network elements and variable visualisation methods. It is acknowledged that the user’s perception and interpretation of signals is based on past experiences. Therefore, the main network elements were primarily inspired by the classic network component representation utilised in EPANET’s 2D graphical display. It was important to keep the elements simple but distinct so that specific components of a complex network could be identified quickly and with ease. As with other WDN mapping software such as EPANET 2, HOWS IVIS utilises a node & link based representation method where all network elements fall into the category of either a node or link.
3.2.1. Pipe Fins
Hydraulic values and other network parameters can be displayed to the user using a variety of methods, such as element colour, size, texture and movement. Additional geometry is employed to augment network information, one such example is ‘pipe fins’, a novel approach to visualising hydraulic parameters in three-dimensional space.
Figure 2: Network Visualisation - EPANET 2 (a) & HOWS Interactive Visualisation Client (b) - Exnet
These ‘fins’ (Figure 3) run the length of each pipe and can be used to show a variety of variables simultaneously. For example, the height at each end can represent hydraulic head, the colour gradient can show water quality and the vertical lines can be moved in the direction of flow with a speed relative to water velocity. The inclusion of such powerful visualisation tools allows the engineer to gain greater insight into the performance of a network with the view to helping them make more informed decisions.
3.2.2. Virtual Reality
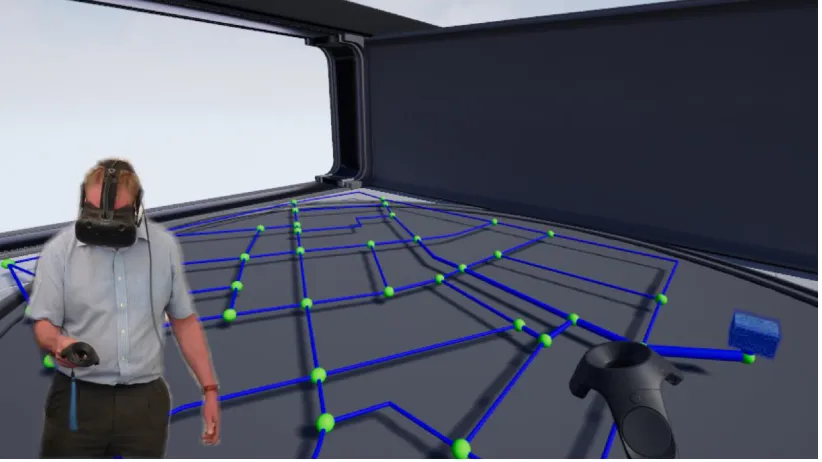
In addition to the standard 3D visualisation of water distribution networks, a Virtual Reality (VR) version of the HOWS IVIS client is in development. HOWS IVIS VR allows the user to observe and interact with a WDN model in an intuitive manner by placing them in a fully immersive virtual environment. The user navigates the space by simply walking around and manipulates the model using hand held motion controllers instead of using standard mouse and keyboard controls. The HOWS IVIS VR client will have the same underlying functionality of the standard version, allowing the engineer to directly assess and interact with an EA.
Although a comprehensive user study of the system has not been conducted, several water systems engineers have experienced HOWS IVIS VR and have given positive feedback with regards to the appearance of the WDN visualisation and the intuitive nature of the system. HOWS IVIS VR is still in the early stages of development and further visualisation and interaction techniques which utilise the unique capabilities of VR are being explored. These include the use of non-visual forms of data communication using auditory and haptic feedback. It is hoped that the use of VR can further aid the interaction between engineer and optimiser in a way that is both intuitive and productive.
3.3
Visualisation of Optimisation
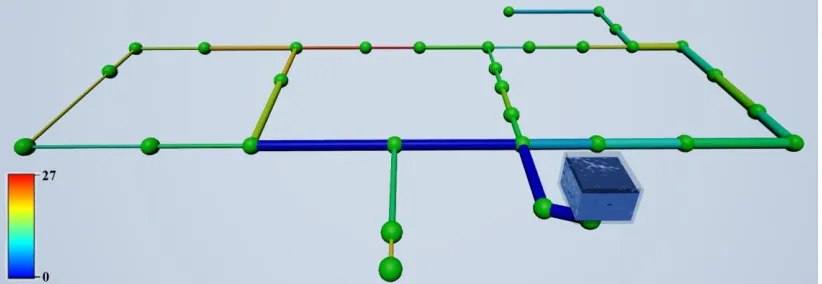
The HOWS interactive visualisation client not only allows the engineer to visualise the various parameters of a network but also allows the user to observe the behaviour and progress of an optimisation method, such as an EA. Combining such an optimisation method with this visualisation system enables the user to track and visualise the actions of the algorithm down to an individual pipe diameter change. To achieve this, the system aggregates changes made to the network over an EA run and displays them on the network model using a colour scale (figure 2), this technique was first presented in (Johns M, Keedwell EC, 2014).
It can be observed that pipes closest to the reservoir are not frequently altered (blue) in the fittest solution during the optimisation process whereas pipes towards the extremities of the network have their diameters varied more frequently (red). This behaviour is anticipated as diameter changes to pipes near the reservoir have a more significant impact on the hydraulic performance of the network than changes further down-stream. The ability to display aggregate changes to the network over an evolutionary algorithm run effectively ‘lifts the lid’ on the operations of an EA as it is optimising a network. The system also allows the engineer to view other important optimisation-related information such as the extent to which constraints have been violated in the current design.
3.4
Interactive Optimisation
Although interactive evolution has been studied in the wider field of computer science, these techniques have primarily been applied where the fitness function is unknown or at least hard to define, often when subjective evaluation is required. The most common form of interactive evolution is the aforementioned objective function replacement, where a human replaces the objective function of the algorithm, less common is the replacement of evolutionary variation operators, such as mutation and crossover, with human input. Currently the HOWS IVIS client enables the user to directly perturb solutions produced by the evolutionary algorithm and pass them back to the server to be reintegrated into the algorithm’s population. At a high level this process temporally substitutes the algorithm’s variation operator with the engineer. The potential benefits of doing so are multifaceted, firstly the engineer is not bound by the number of changes they can make to a solution, thus they can make large changes to a solution, introducing new genetic material to the EA population, effectively guiding the search in a favourable direction from the engineer’s perspective. Secondly the interactions and changes the engineer makes to a solution can be logged and it is envisaged this information can
making process, generating new heuristics during the optimisation process that the EA can continue to employ throughout the search.
At the start of the optimisation process the user is presented with a randomly generated solution which they can alter by changing pipe diameters. Upon selecting a pipe, the HOWS IVIS client sends a request to the HOWS server for the available diameters for that pipe. Upon receipt of the request, the server calculates the objective values, in this case, network cost and total head deficit, for each potential diameter change. This data is passed back to the client and the user is presented with a list of available diameters (Figure 6), their corresponding costs and relative change in objective values if selected. Figure 6 shows an example of how this system can be used to make educated decisions using this feature. The current diameter of the selected pipe is highlighted in blue (1,016mm) and it can be instantly seen that decreasing the diameter to 508mm (highlighted in green) will decrease network cost by $629,627 whilst not incurring any additional head deficit. Each available diameter in this dialog also has an active for optimisation check box, this allows the engineer to select which diameters are available for consideration by the optimisation algorithm, effectively restricting the range of diameters a pipe can be changed to by the EA. After the engineer has made the desired changes to the network their solution is sent to the server where it is placed in the EA’s population and the algorithm is run for a designated number of iterations. Upon completion, the best solution is sent back to the IVIS client and presented to the engineer, highlighting the changes made from the last solution the client sent to the server using the technique detailed in section 3.3. The engineer is then free to make further changes and the process is repeated until the user is satisfied with the solution.
3.5
Search Space Reduction
From observations made when visualising pipe diameter variation during an optimisation run it was noted that a large proportion of pipe diameters in a network are decided in the relatively early stages of the search. As a result, many solution evaluations are potentially wasted in the later parts of the search.
The new system allows the user to address this issue by interacting directly with network components during an EA optimisation run. For example, the user would pause the run, select a pipe and choose to fix a diameter; this could be a single diameter or a smaller range of diameters from the available set. Such an action applies a hard constraint to the problem through manipulation of the solution representation to ensure no violation of the user-imposed rules occurs during the remainder of the optimisation. Limiting the search space of the algorithm by reducing the number of decisions (constraining pipe diameters) has the direct effect of improving algorithm performance by reducing the number of solution evaluations required to reach a valid solution.
3.5.1. Experimentation
The HOWS interactive visualisation system is being tested on a number of least-cost water distribution network design benchmark problems from the literature including the Hanoi (Fujiwara & Khang, 1990) and New York Tunnels (Savic & Walters, 1997) problems. The optimisation algorithm linked to the tool is a Genetic Algorithm (GA) in this case. However, the HOWS framework allows for any iterative optimisation method to be linked with the visualisation client. Users are asked to fix or constrain pipe diameters of pipes they deem acceptable, based on optimisation information presented by the visualisation system. For this set of experiments the GA is paused at regular intervals to enable user evaluation and interaction However, in later versions it is envisaged that the user will be given more control over when interaction occurs. Every interaction made by the user is logged for further analysis. It is envisioned that this data could be used in the future to build heuristics through pattern matching or machine learning techniques.
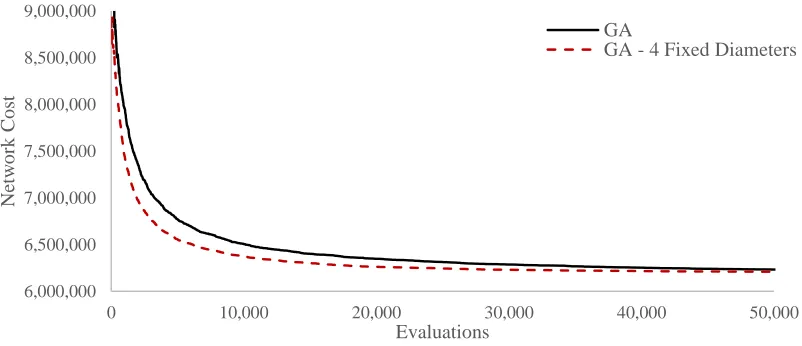
Using the diameter change information for the Hanoi problem (figure 5), the diameters of four pipes (dark blue) close to the reservoir were fixed in the early stages of the GA’s search. Figure 7
Figure 7: Network cost over evaluations for the Hanoi problem – Standard vs Fixed Diameters
6,000,000 6,500,000 7,000,000 7,500,000 8,000,000 8,500,000 9,000,000
0 10,000 20,000 30,000 40,000 50,000
Netw o rk C o st Evaluations GA
convergence and better solution quality compared to the standard GA. This preliminary experimentation suggests that user driven pipe diameter fixing leads to a reduction of the fitness evaluations needed to obtain a good solution. However, ultimate solution quality is highly dependent on the user making informed decisions early in the search process.
4
Conclusion
The HOWS interactive visualisation client is able to run complex hydraulic simulations and visualise the resultant data directly on the 3D network model in a manner such that an engineer is able to quickly assess the water system and easily identify any issues with the network. In addition, the system enables the user to observe the behaviour and progress of an iterative optimisation method, facilitating the direct interaction between engineer and optimiser. It does this by aggregating changes made to the network during an optimisation algorithm run and displaying them on the network model using a colour scale. By manipulating problem parameters during the optimisation process an engineer can influence the search of an Evolutionary Algorithm with the aim of reducing the necessary solution evaluations to achieve highly optimal solutions.
The HOWS interactive visualisation client opens the potential for greater interaction between the human expert and evolutionary optimiser. The visualisation methods presented here point to new human-machine interfaces for optimisation that can improve the real-world feasibility of water distribution network designs.
5
Acknowledgements
The HOWS platform has been developed as part of the Human-Computer Optimisation for Water Systems Planning and Management (HOWS) project funded by the Engineering and Physical Sciences Research Council (EPSRC) - grant EP/P009441/.
References
Fujiwara, O., & Khang, D. (1990). A two-phase decomposition method for optimal design of looped water distribution networks. Water Resources Research, 26(4), 539–549.
Johns M, Keedwell EC, S. D. (2014). Interactive 3D Visualisation of Optimisation for Water Distribution Systems. In 11th International Conference on Hydroinformatics. New York, USA. Keedwell, E., Johns, M., & Savic, D. (2015). Spatial and Temporal Visualisation of Evolutionary
Algorithm Decisions in Water Distribution Network Optimisation. In VizGEC Workshop,
Genetic and Evolutionary Computation Conference. Madrid, Spain.
Marchi, A., Salomons, E., Ostfeld, A., Kapelan, Z. S., & Simpson, A. R. (2014). Battle of the Water Networks II. Water Resources Planning and Management, 140(7).
Savic, D. A., & Walters, G. A. (1997). Genetic Algorithms for Least-Cost Design of Water Distribution Networks. Journal of Water Resources Planning and Management, 123(2), 67–77. Retrieved from http://cedb.asce.org/cgi/WWWdisplay.cgi?104031