THERMAL DECOMPOSITION AND KINETIC STUDIES OF TANNIC ACID USING MODEL FREE-METHODS
NAUSHAD AHMAD
1*, MANAWWER ALAM
2, MU. NAUSHAD
1ANEES A. ANSARI
3BASEL F. ALRAYES
4MSHARI
A. ALOTAIBE
5 ,1Department of Chemistry, College of Science, Riyadh-11451, King Saud University, Kingdom of Saudi Arabia 2Research Centre, College of Science, Riyadh-11451, King Saud University, Kingdom of Saudi Arabia 3King Abdullah Institute for Nanotechnology, Riyadh-11451, King Saud University, Kingdom of Saudi Arabia
4Central Laboratory, College of Science, Riyadh-11451, King Saud University, Kingdom of Saudi Arabia
5Department of Chemistry, College of Science, Prince Sattam bin Abdulaziz, Alkharj-11942, University, Kingdom of Saudi Arabia
ABSTRACT
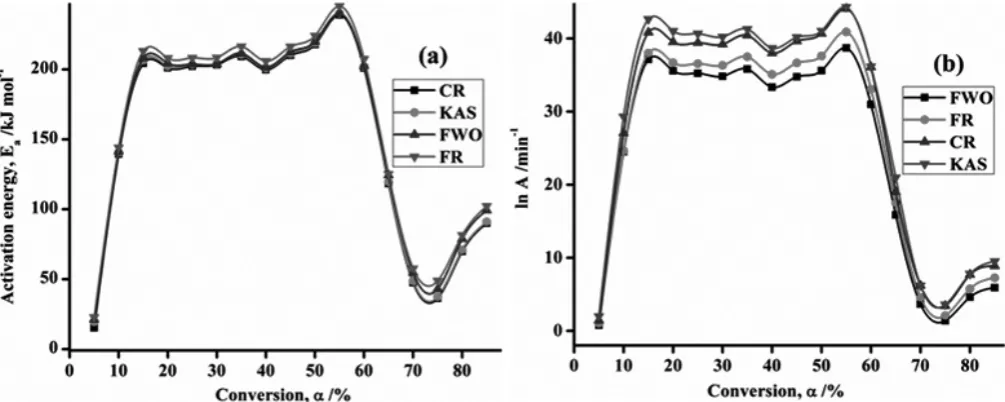
In this manuscript, thermal and kinetic features of a tannic acid was studied by simultaneous TG-DTA techniques in the nitrogen atmosphere at four heating rate. It was observed that thermal decomposition of its constituents occurred in two steps. Model free isoconversional methods namely modified Coast-Redfern (CR), Kissinger-Akahira-Sunose (KAS), Flynn-Wall-Ozawa (FWO) and Freidman (FR) were used for revelation of decomposition kinetics (Ea and lnA) on the whole range of temperature. Mechanisms of decomposition process have been found to follow first order of decomposition rate. Reaction order does not have a substantial effect on the process because of the high value of pre-exponential factor. It was observed that, at the last stage of decomposition process, value of activation energy and pre-exponential factor increased. Decomposition of tannic acid was confirmed by IR spectroscopy.
Keywords: Tannic acid; Thermal decomposition; kinetics; Isoconversional methods
INTRODUCTION
The study about the decomposition and thermal stability of solid materials either inorganic or organic is of wide technological importance for investigating reaction mechanisms and kinetic triplet (Ea, lnA and f(α) or g(α)) [1-3]. Broadly, thermal study can provide important facts on temperature dependent properties of materials, thermally induced processes; and theoretical information of reaction mechanism and kinetics of solid state decompositions [4-6]. Kinetic triplets predict how a system approaches equilibrium and also help to understand the mechanism of the decomposition steps [7]. Numerous researchers have accentuated the practical and theoretical significance on these processes [8-11]. A systematic understanding of decomposition kinetics can be useful in elucidating reaction mechanism, transformations (melting, sublimation, and polymorphic transformation), quality of products, optimization of process parameters and the course of reaction. Numerous solid-state kinetic reactions are substantially differing from homogenous reaction like solution or gases. These differences include experimental procedures like pre-treatments, sample amounts and length of induction period employed for their research and computation approaches for evaluating data [12]. Therefore, it has become essential to understand the environmental influence of material properties and its decomposition mechanism. If the rate of decomposition can be measured precisely, then it becomes possible to reveal the material properties. Solid-state kinetics and thermal behavior have been elucidate many forms but they involve mass or enthalpy changes (TGA, DTA and DSC) are of high attention of scientist since a long time [13]. The thermal decomposition data generated from thermogravimetric analytical (TGA) technique have been extensively used to determine the composition of materials, kinetic and thermodynamic parameters (Ea, A, ∆H, ∆S and ∆G) and lifetime predictions, which are practical applications for large number of processes [14,15]. TGA can be monitoring by mass changes in different stages that occurs at given temperature or temperature range of controlled heating rate [16]. The decomposition process by TG technique can be influenced by experimental conditions [17, 18] like temperature, gas flow rate, heating rate (isothermal and non-isothermal), the nature of gas flowing, sample mass or material properties (composition, shape and size of particles), moisture content as well as the mathematical methods used to calculate data. Solid-state thermal kinetics can be mechanistically classified as diffusion, geometrical contraction, nucleation and applied reaction order models. Many studies of TG data have been used for determination of kinetic parameters, such as isothermal and non-isothermal methods. Numerous mathematical approaches have been established to deduce experimental data for heating procedures, isothermal and non-isothermal. These methods generally fall into two categories: model-fitting and model-free.
In this article, we have reported the decomposition and kinetic parameters of tannic acid examined by thermogravimetric-derivative (TG-DTA) technique in the presence of nitrogen gas at heating rate of 5, 10, 20 and 25oC min-1using
non-isothermal isoconversional (FWO, KAS, modified CR and FR) methods. Briefly, tannic acid is a polymer of gallic acid and glucose (Figure 1) and found in woods like oak, walnut, seeds, bark, cones and heartwood. It has anti-bacterial, anti-enzymatic, anti-oxidant, anti-mutagenic and astringent properties and provides natural defense for woods against wildfire, decomposition and infestation by insects and an important ingredient in food, medicines and wine.
Fig. 1. Structure of tannic acid
EXPERIMENTAL
Methods of Kinetic parameter estimation
TG-DTA method is very important for the determination of decomposition temperature/steps and kinetics parameters for solid materials. The present work reports the estimation of kinetic parameters by model free isoconversional methods. The basic proclamation of these methods is that the rate of reaction for a constant degree of conversion depends only on temperature and a series of experiments has to be measured at multiple heating rates. The knowledge of Eα and lnA versus α allows detecting multi step processes and reaction mechanism over a wide temperature range.
The kinetic equation of thermal decomposition process can be written as:
For constant α, a plot of ln β/T2 versus 1/T is a straight line whose slope
is Ea / RT.
Friedman method [26] is an isoconversional differential method, relates the logarithm of rate of reaction with the inverse temperature for a constant α, based on the following equation:
(1)
where α is a fraction decomposed at time t, k(T) is temperature dependent function, f(α) is conversion function(α) which depends on the mechanism of decomposition, A is frequency factor, T is absolute temperature, R gas constant (8.314 J mol-1 K-1) and E
a is activation energy.
Introducing the linear heating rate (β) in non-isothermal conditions Eq. (1) can be expressed as:
(2)
Thus, activation energy of a thermal process under linear heating rate would be estimated from the plot of the left hand side verses T-1of Eq. (2). On integration and approximation, Eq. (2) leads to
(3)
g(α) is integral form of the f(α), which is the reaction model that depends on reaction mechanism. This equation permit direct evolution of experimental data by mass-loss recorded in a thermogravimetric analysis under a linear heating rate.
In the present study, the non-isothermal kinetics for thermal decomposition were evaluated according to Kissinger-Akahira-Sunose (KAS), Flynn-Wall-Ozawa (FWO), modified Coasts-Redfern (CR) and Friedman (FR) methods.
Flynn-Wall-Ozawa (FWO) is an isoconversional method that can determine activation energy without knowledge of reaction order [19, 20]. Integration and taking natural logarithms of eq (2) by using Doyle approximation [21] is written as:
(3)
where Ea, A, β and T have the known denotations. The Ea at various degree conversions can be obtained from lnβ versus 1/T plot. In this method, conversion dependence function (f (α) or g(α)) are not required.
The modified CR method [22] is a multi-heating rate model-free isoconversional approach. It is based on the equation:
(4)
where To is temperature at onset of reaction. This equation on integration for the first order of reaction (n=1) gives,
(5)
To use this equation at a selected common value of conversion degree for different heating rates, the left-hand side should be plotted against 1/T and giving a straight lines of slope –Ea/R while A from intercept value. If the values of Ea vary with the variation of α, the data should be interpreted in terms of multi-step process [23].
Kissinger-Akahira-Sunose (KAS) method is based on the Coats-Redfern approximation and similar to the FWO method [24, 25], which is described by the following equation:
(6)
(7)
The plot of left hand side versus 1/T allows estimation of the activation energy.
RESULTS AND DISCUSSION
Nonisothermal decomposition of Tannic acid (TG-DTA)
TG and its corresponding DTA curves of tannic acid are shown in Figure 2 and decomposition data are summarized in Table1. The TG curves are characterized by two mass losses during decomposition. The DTA curves also shows splitting, confirming the two step process. The values of initial temperature (Ton), temperature of completion (Tend), and maximum temperature
(Tmax) acquired from TG and DTA for the thermal decomposition of tannic
acid show that these values increases as the heating rate increased. The shift of TG curves with increasing heating rate to higher temperature could be ascribed due to short time period required for a tannic acid to reach a given temperature and particle size distribution [27]. Figure 1a clearly showed that residual mass increased with level of heating rates and suggested different kind of final products. The first minor peak occurs in the temperature range 50-95 oC accompanied by removal of small molecules like H
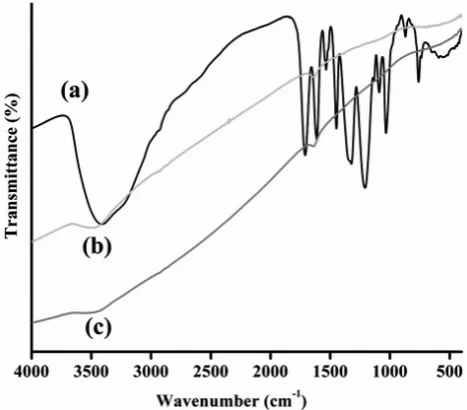
2O, CO, CO2, and phenol from high molecular weight macromolecules into smaller chain fragments. The next major decomposition peak occurs in the temperature range 190-460 oC and corresponds to the depolymerisation/hydrolysis of tannic acid. After decomposition of tannic acid all groups were absent which shows that tannic acid completely decomposed and the residues have only carbon, confirmed by FTIR (Fig. 3).
Table1. Data from TG and DTA curves for decomposition process of
tannic acid at different heating rates in nitrogen atmosphere.
Heating
rate (β)
Step 1 Step 2
Ton/ oC Tend/ oC Tmax1/ oC Ton/ oC Tend/ oC Tmax2/ oC
5 50.10 106.05 67.15 194.13 437.11 308.16
10 51.94 122.13 73.25 196.09 439.61 319.22
20 52.54 145.09 93.03 215.34 455.16 327.62
25 54.85 151.22 94.16 223.08 460.17 333.19
Nonisothermal decomposition kinetics
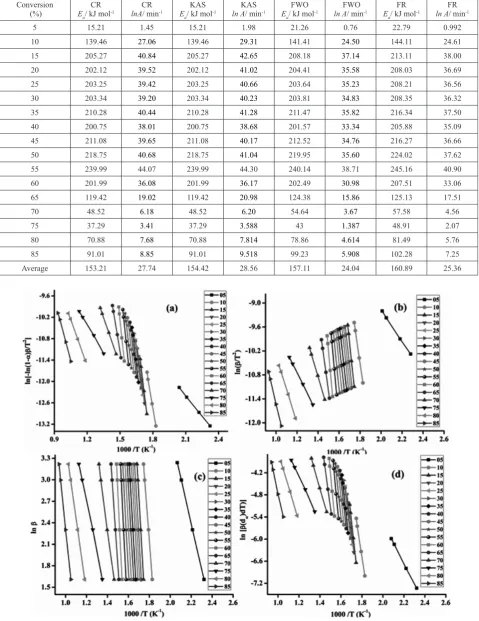
Fig. 4 represents modified CR, KAS, FWO and FR plots of ln(-bln(1-α)/ T2), ln(β/T2),lnβ and ln(βd
α/dt) against inverse of decomposition temperature
shows the activation energy obtained by CR, KAS and FWO methods agree very well after fitting the data. However the activation energy obtained from the FR method are higher than the values obtained from the other three methods,
due to different approximations of the temperature integral by applied methods [29]. The average values of Ea for FWO, KAS and CR methods obtained in the range are also lower than average values of Ea obtained for FR method.
Fig. 2. TG (a) and DTA (b) thermal decomposition curves of tannic acid in nitrogen atmosphere at different heating rates.
Fig. 3. FT-IR spectra of (a) Before decomposition (b) After
decomposition at 5 oC min-1 and (c) 25oC min-1 of tannic acid.
CONCLUSION
Thermal degradation of tannic acid in nitrogen atmosphere under non-isothermal condition showed two mass-loss stages, one minor and other major. Four isoconversional methods namely CR, KAS, FWO and FR were tested and checked their suitability to tannic acid pyrolysis kinetics after brief
Table 2.Thermal kinetic parameters of tannic acid at different conversion degrees determined by CR, KAS, FWO and FR methods. Conversion
(%) Ea/ kJ molCR -1
CR
lnA/ min-1 E KAS
a/ kJ mol-1
KAS
ln A/ min-1 E FWO
a/ kJ mol-1
FWO
ln A/ min-1 E FR
a/ kJ mol-1
FR ln A/ min-1
5 15.21 1.45 15.21 1.98 21.26 0.76 22.79 0.992
10 139.46 27.06 139.46 29.31 141.41 24.50 144.11 24.61
15 205.27 40.84 205.27 42.65 208.18 37.14 213.11 38.00
20 202.12 39.52 202.12 41.02 204.41 35.58 208.03 36.69
25 203.25 39.42 203.25 40.66 203.64 35.23 208.21 36.56
30 203.34 39.20 203.34 40.23 203.81 34.83 208.35 36.32
35 210.28 40.44 210.28 41.28 211.47 35.82 216.34 37.50
40 200.75 38.01 200.75 38.68 201.57 33.34 205.88 35.09
45 211.08 39.65 211.08 40.17 212.52 34.76 216.27 36.66
50 218.75 40.68 218.75 41.04 219.95 35.60 224.02 37.62
55 239.99 44.07 239.99 44.30 240.14 38.71 245.16 40.90
60 201.99 36.08 201.99 36.17 202.49 30.98 207.51 33.06
65 119.42 19.02 119.42 20.98 124.38 15.86 125.13 17.51
70 48.52 6.18 48.52 6.20 54.64 3.67 57.58 4.56
75 37.29 3.41 37.29 3.588 43 1.387 48.91 2.07
80 70.88 7.68 70.88 7.814 78.86 4.614 81.49 5.76
85 91.01 8.85 91.01 9.518 99.23 5.908 102.28 7.25
Average 153.21 27.74 154.42 28.56 157.11 24.04 160.89 25.36
Fig. 4. (a) Coats-Redfern (CR), (b) Kissinger-Akahira-Sunose (KAS), (c) Flynn-Wall-Ozawa (FWO), and (d) Friedman (FR)
Fig. 5. Variation in (a) activation energy (Ea) and (b) frequency factor (lnA) on selected degree of conversion (α) of tannic acid according to Coats-Redfern (CR), Kissinger-Akahira-Sunose (KAS), Flynn-Wall-Ozawa (FWO) and Friedman (FR) isoconversional methods.
ACKNOWLEDGEMENTS
This project was supported by King Saud University, Deanship of Scientific Research, College of Science Research Center.
REFERENCES
1. A. K. Galwey, M.E. Brown, Thermal decomposition of ionic solids, first ed. Elsevier Science BV Amsterdam, The Netherland,1999.
2. S. Vyazovkin, Anal. Chem., 2004, 76, 3299.
3. J. W. Huang, C. C. Chang, C. C. Kang, M. Y. Yeh, Thermochim. Acta,2008,468,66.
4. S. Vyazovkin, C.A. Wight, Annu. Rev. Phys. Chem.,1997,48,125. 5. J.M. Kotler, N.W. Hinman, C.D. Richardson, J.R. Scott, J. Therm. Anal.
Calorim., 2010, 102,23.
6. C.D. Bertol, A.P. Cruz, H.K. Stulzer, F.S. Murakami, M.A.S. Silva, J. Therm. Anal. Calorim.,2010,102,187.
7. J. Malek, T. Mitsuhashi J.M. Criado, J. Mate. Res,2001,16,1862. 8. S. Vyazovkin, C.A. Wight, J. Phys. Chem.,1997,101A,8279. 9. T.B. Brill, K.J. James, Chem. Rev., 1993, 93,2667.
10. S.Vyazovkin, C.A. Wight, Int. Rev. Phys. Chem.,1998,17,407. 11. D. Dollimore, Chemical Rev., 1996, 68,63.
12. S. Vyazovkin, Inter. Rev. Phy. Chem., 2000,19,45.
13. M.E. Brown, Introduction to thermal analysis: techniques and applications, Chapman and Hall, London, 1998, pp127-151.
14. S. Vyazovkin C.A. Wight, Thermochim. Acta, 1999,340/341,53. 15. F. Rodante, S.Vecchio, M. Tomassetti, J. Pharm. Biomed Anal.,2002,
29,1031.
16. N. Sbirrazzuoli, L. Vincent, A. Mija, N.Guigo, Chemometrics and Intelligent Laboratory Systems,2009, 96, 219.
17. S. Vyazovkin, New J. Chem., 2000, 24,913. 18. S. Vyazovkin, Inter. J. Chem. Kinet., 1996, 28,95.
19. J.H. Flynn, L. A.Wall, J. Res. Nat. Bur. Stand.: A Phys Chem, 1966,70A, 487.
20. T. Ozawa, Bull. Chem. Soc. Jap., 1965,38,1881. 21. C. D. Doyle, Nature, 1965,207,290.
22. A. K. Burnham, L. N. Dinh, J. Therm. Anal. Calorim., 2007,89/2,479. 23. J. T. Sun, Y. D. Huang, G. F. Gong, H. L. Cao, Polym. Degrad. Stabil.,
2006,91,339.
24. H.E. Kissinger, Anal. Chem., 1957,29,1702.
25. T. Akahira, T. Sunose, “Trans. Joint Convention of Four Electrical Institutes,” Paper No. 246, 1969, Research Report, Chiba Institute of Technology, Science Technology,1971,16, pp.22–31.
26. H.L. Friedman, J. Poly.Sci., 1964,C6,183-195.
27. A. Khawam, D.R. Flanagan, Thermochim. Acta, 2005,436,101.