Journal
Journal
Volume 63 Issue 3 Article 4
5-2011
A Policy Framework for Spectrum Allocation in Mobile
A Policy Framework for Spectrum Allocation in Mobile
Communications
Communications
T. Randolph Beard
Phoenix Center for Advanced Legal & Economic Public Policy Studies
George S. Ford
Phoenix Center for Advanced Legal & Economic Public Policy Studies
Lawrence J. Spiwak
Phoenix Center for Advanced Legal & Economic Public Policy Studies
Michael Stern
Phoenix Center for Advanced Legal & Economic Public Policy
Follow this and additional works at: https://www.repository.law.indiana.edu/fclj
Part of the Administrative Law Commons, Antitrust and Trade Regulation Commons, Communications Law Commons, and the Legislation Commons
Recommended Citation Recommended Citation
Beard, T. Randolph; Ford, George S.; Spiwak, Lawrence J.; and Stern, Michael (2011) "A Policy Framework for Spectrum Allocation in Mobile Communications," Federal Communications Law Journal: Vol. 63 : Iss. 3 , Article 4.
Available at: https://www.repository.law.indiana.edu/fclj/vol63/iss3/4
639
A Policy Framework for Spectrum
Allocation in Mobile Communications
T. Randolph Beard, Ph.D.*
George S. Ford, Ph.D.**
Lawrence J. Spiwak, Esq.***
Michael Stern, Ph.D.****
I. INTRODUCTION ... 640
II. FROM DE JURE TO DE FACTO SPECTRUM CAPS ... 647
III. ANALYTICAL FRAMEWORK ... 653
A. Theoretical Model ... 657
B. Illustrations of the Theory ... 659
* Senior Fellow, Phoenix Center for Advanced Legal & Economic Public Policy Studies; professor of economics, Auburn University.
** Chief Economist, Phoenix Center for Advanced Legal & Economic Public Policy Studies.
*** President, Phoenix Center for Advanced Legal & Economic Public Policy Studies. The views expressed in this Paper are the Authors’ alone and do not represent the views of the Phoenix Center, its Adjunct Fellows, or any of its individual Editorial Advisory Board members.
IV. “MORE”SPECTRUM DOES NOT AFORTIORIMEAN “MORE”
FIRMS ... 662
A. Theoretical Evidence ... 662
B. The Historical Evidence ... 663
V. CONCLUSIONS ... 665
I.
I
NTRODUCTIONAcross the globe, the mobile communications revolution is well under way. From advanced economies such as the United States, to developing economies like India, mobile telecommunications, in both voice and data forms, is quickly becoming the communications technology of choice. In the United States, it took less than fifteen years for wireless telephones to move from a thinly consumed service to effective ubiquity.1 In 2009, there were 285.6 million wireless accounts in the United States, which translates to roughly 1.1 accounts for every person over ten years of age or more.2 Mobile communications has evolved well beyond voice technology to now include enhanced communications services such as text messages, e-mail, and broadband connectivity, which are, in fact, quickly becoming the dominant source of consumer value for mobile service. In the not-so-distant future, it is expected by some that mobile appliances, like the iPhone, will replace traditional computers for many consumers.3 For many individuals and households, mobile broadband may be the Internet connection of choice.4
This rise in wireless connections, as well as the rapidly increasing demand for data services over such connections, is a mixed blessing. On the one hand, it provides an enormous economic boon to consumers, businesses, and providers; on the other hand, however, it is beginning to test the capacity of networks to provide such services. As a result, the supply of available quality commercial spectrum is rapidly becoming
1. See CTIA, Background on CTIA’s Semi-Annual Wireless Industry Survey,at 3–4 (2011),http://files.ctia.org/pdf/CTIA_Survey_Year_End_2010_Graphics.pdf (showing 33.7 million accounts in 1995 (0.13 per capita) and 292.8 million in 2010 (0.95 per capita)). 2. Id.; Population Estimates, U.S. CENSUS BUREAU, http://www.census.gov/popest/national/asrh/NC-EST2009-sa.html (268.5 million persons ten years and over).
3. See, e.g., Nick Wingfield, Time to Leave the Laptop Behind, WALL ST.J., Feb. 23, 2009, at R1; Geoff Kirbyson, More of Us Cutting the Cord: Wireless Generation Unplugging Their Computers, Phones, WINNIPEG FREE PRESS, Aug. 20, 2010, at A2; Bill Ray, Cutting the Cord: Future Mobile Broadband Tech, REGISTER HARDWARE (July 14, 2009), http://www.reghardware.com/2009/07/14/future_wireless_tech/.
exhausted.5
Fortunately, this fact has not gone unrecognized by policymakers. FCC Chairman Julius Genachowski recently observed that “America is facing a looming spectrum crunch”6 because “the United States does not have nearly enough spectrum to meet its medium- and long-term mobile broadband needs.”7 Perhaps the single most important proposal in the National Broadband Plan is to make 500 megahertz (MHz) of additional spectrum available by 2020 for the provision of mobile broadband services, with ideally 300 MHz of that spectrum being made available by 2015,8 a vision that President Obama formally endorsed by Presidential Memorandum.9
Allocating more spectrum to advanced mobile services (such as broadband) is widely viewed as a sensible, if not a necessary, public policy.10 However, merely stating that more spectrum is to be allocated to commercial mobile services leaves some highly relevant details unresolved. There are (at least) two important questions that must be answered when increasing the supply of spectrum: (1) how much new spectrum is to be allocated; and, more importantly, (2) who gets it?11 On the first question, as
5. Within limits, the capacity of fixed amount of spectrum can also be enhanced by increasing the number of towers. FCC, NATIONAL BROADBAND PLAN 77 (2010), http://download.broadband.gov/plan/national-broadband-plan.pdf (describing the capacity limitation of mobile broadband network); FCC,THE BROADBAND AVAILABILITY GAP 71 (2010), http://download.broadband.gov/plan/the-broadband-availability-gap-obi-technical-paper-no-1.pdf (“Loosely speaking, if spectral efficiency of the air interface remains unchanged, capacity of the wireless network grows proportionately with spectrum allocation.”); see also FCC,MOBILE BROADBAND:THE BENEFITS OF ADDITIONAL SPECTRUM
(2010), http://download.broadband.gov/plan/fcc-staff-technical-paper-mobile-broadband-benefits-of-additional-spectrum.pdf.
6. Julius Genachowski, Chairman, FCC, Mobile Broadband: A 21st Century Plan for the U.S. Competitiveness, Innovation and Job Creation, Prepared Remarks at the New
America Foundation (Feb. 24, 2010), http://hraunfoss.fcc.gov/edocs_public/attachmatch/DOC-296490A1.pdf.
7. Julius Genachowski, Chairman, FCC, Broadband: Our Enduring Engine for Prosperity and Opportunity, Prepared Remarks at the NARUC Conference, Washington, D.C. (Feb. 16, 2010), http://hraunfoss.fcc.gov/edocs_public/attachmatch/DOC-296262A1.pdf.
8. NATIONAL BROADBAND PLAN, supra note 5, at 10.
9. See Lawrence H. Summers, Dir., Nat’l Econ. Council, Technological Opportunities, Job Creation, and Economic Growth, Remarks at the New America Foundation on the President’s Spectrum Initiative (June 28, 2010), available at
http://www.whitehouse.gov/administration/eop/nec/speeches/technological-opportunities-job-creation-economic-growth.
10. See id.; NATIONAL BROADBAND PLAN, supra note 5, at ch. 5; Genachowski, supra
note 6.
noted a moment ago, the FCC has proposed to increase substantially the spectrum available for mobile services. On the other hand, the FCC has sent clear signals that it is concerned with increasing industry concentration (despite the fact that it approved every auction and wireless merger to date) and, by implication, that it would prefer to allocate any new spectrum primarily to new entrants and possibly smaller incumbents, rather than the largest incumbent providers, in order to “deconcentrate” the industry.12
The allocation of spectrum among firms is a complex issue for which economic theory can provide key insights. To this end, we provide in this Article a theoretical analysis of some of the relevant tradeoffs involved in allocating spectrum among service providers. Informally, our analysis contemplates two (theoretical) states of the world. In the first, a fixed amount of spectrum is divided among many firms so that each firm has a “little” spectrum. In the other, that same fixed amount of spectrum is divided among fewer firms, so that each firm has “much” spectrum. Incorporating the modeling assumption that a firm with a larger holding of spectrum can provide more advanced services due to greater capacity and throughput than a firm with less spectrum,13 the theoretical tradeoff, all other things constant, is straightforward. In a setting with “many firms with little spectrum,” there may be more price competition, but that competition takes place over relatively less advanced services.14 In a setting with fewer firms with larger allotments of spectrum, there may be less price competition (due to the Cournot assumption), but that competition occurs over more advanced services (due to the relationship between spectrum and the capacity to offer such services). Lower prices are good, and higher quality is good, but, if quality requires large amounts of a fixed allotment of spectrum, then the two may not occur together (as a result of the
the license, and so forth.
12. See infra Part II. The Hirschman-Herfindahl Index of industry concentration falls as market share shifts from larger to smaller firms.
13. The form of the holdings is a significant factor. For example, having spectrum in paired bands permits greater bandwidth. See, e.g., BROADBAND AVAILABILITY GAP, supra
note 5, at 73. On the tradeoff between expanding capacity using more spectrum or deploying more network, see, for example, MOBILE BROADBAND: THE BENEFITS OF ADDITIONAL
SPECTRUM, supra note 5.
modeling assumptions). Consequently, the policymaker is asked to trade off between potentially lower prices for less advanced services, and potentially higher prices for more advanced services. It is not apparent, at first glance, which situation is “better.”
Since, however, either of the above-described outcomes can be supported as “best” under certain conditions, linking the theory to the current structure of the mobile telecommunications industry is required in order to render policy-relevant conclusions. We believe this linkage, properly understood, can render fairly strong prescriptions. First, while additional firms can lead to lower prices (at least in the Cournot competition framework, which is the standard for regulatory policy), at some point additional firms have almost no effect on price. In fact, economic theory suggests that the price cuts resulting from additional firms rapidly diminish, and there is evidence to support this theoretical result.15 Price cuts are mostly exhausted after about three to five rivals are present in the market.16 From an empirical standpoint, FCC data indicate that at present about ninety-one percent of the population has access to four or more mobile providers.17 Consequently, adding new competitors to the mobile industry is expected to have a small impact on prices. The gains from dividing spectrum into smaller parts in an effort to create more firms (e.g., using spectrum caps) are therefore likely to be very low, even under favorable conditions.18 Alternately, the economic gains from having access to broadband services are typically viewed as being very large, so a policy
15. See, e.g., Roger L. Beck & Sheila Mozejko, Concentration and Price/Cost Margins Across Time in Canada, 9 CANADIAN J.ADMIN.SCI. 40, 40 (1992); Stephen A. Rhoades,
Market Share as a Source of Market Power: Implications and Some Evidence, 37 J.ECON. & BUS. 343, 343 (1985); Michael Salinger, The Concentration-Margins Relationship Reconsideredin BROOKINGS PAPERS ON ECONOMIC ACTIVITY,MICROECONOMICS 287 (1990); John R. Schroeter, Estimating the Degree of Market Power in the Beef Packing Industry, 70 REV.ECON.&STAT. 158, 158 (1988); Myron B. Slovin et al., Deregulation, Contestability, and Airline Acquisitions, 30 J.FIN.ECON. 231, 231 (1991); Gary Whalen, The Determinants and Performance Effects of Rivalry in Local Banking Markets, 31 Q.J.BUS.&ECON. 38, 38 (1992).
16. See CARLTON &PERLOFF, supra note 14, at 165. (“The effect of additional rivals on quantity and price is initially very strong, but tapers off as the number of firms increases.”).
17. Implementation of Section 6002(b) of the Omnibus Budget Reconciliation Act of 1993, Fourteenth Report, 25 F.C.C.R. 11407, para. 44 (2010) [hereinafter Fourteenth CMRS Report].
18. The Merger Guidelines, for example, recommend ignoring mergers where the HHI is 1800 or less, which is equivalent to five equal-sized firms. See U.S.DEP’T OF JUSTICE & FED. TRADE COMM’N, HORIZONTAL MERGER GUIDELINES (1997) [hereinafter 1997 HORIZONTAL MERGER GUIDELINES], available at
of granting existing firms (which can maximize spillovers from their existing plant and customer relationships) sufficient spectrum to run scalable networks that support innovation in both applications and devices is likely to produce substantial economic benefits. Therefore, in effect we have a situation where price changes are no longer a part of the calculus, since adding firms is expected to have a small effect on price competition. As such, the tradeoff revealed by the theory is simply between less- or more-advanced services, and the best policy is clear.
In large part, our analysis comports with the recommendations of the U.S. Department of Justice (DOJ), which address not simply the issue of how much spectrum should be allocated to the industry, but the importance of how much spectrum is given to a single firm. In a letter to the FCC, the DOJ observes, “[s]tated simply, without access to sufficient spectrum a firm cannot provide state-of-the-art wireless broadband services.”19 The DOJ also addresses, to some extent, the details of allocation decisions, observing, “[t]he goal in assigning licenses to any such new spectrum designated for commercial services should be to ensure that it generates the greatest ultimate benefits to the consumers of those services.”20 Our economic model adopts this “greatest ultimate benefits” approach, which is standard economic fare.
Another important insight from the theory is that policymakers do not get to choose the number of firms offering mobile telecommunications services simply through the government’s spectrum allocation decisions. Stated another way, the conventional wisdom that “more” spectrum somehow a fortiori means “more” firms simply is not true.21 As explained
19. Notice of Ex Parte Submission of the United States Department of Justice at 22, Economic Issues in Broadband Competition; A National Broadband Plan for Our Future, FCC GN Docket No. 09-51 (rel. Jan. 4, 2010), http://fjallfoss.fcc.gov/ecfs/document/view?id=7020355122.
20. Id. at 23.
in Competition After Unbundling: Entry, Industry Structure and Convergence,22 which was cited at length by the FCC in the Fourteenth CMRS Report, it is the supply- and demand-side economic conditions of the marketplace that determine the equilibrium number of firms.23 Economics determines the viable number of providers, not the intentions of policymakers.24 Mobile services cannot be supplied without spectrum, but having spectrum does not imply financial success. Spectrum is simply one input to production and cannot singularly determine the financial viability of firms offering mobile communications services. This is apparent from the history of the mobile industry, which has undergone consolidation over much of its history (and may be due for more).25 This consolidation is merely the industry adjusting towards a sustainable structure—an equilibrium consisting of fewer firms than that licensed by the design of the early FCC spectrum allocation decisions. The reality is that, while we may want five, ten, or twenty mobile telephony service providers, the economics are unlikely to permit it.26 Consequently, the heavy use of incumbent-exclusion policies (such as spectrum caps or other limitations on spectrum use by firms) may not result in more providers, but may instead lead simply to inefficient use of scarce spectrum resources.27
valuable wireless spectrum.”).
22. George S. Ford et al., Competition After Unbundling: Entry, Industry Structure, and Convergence, 59 FED.COMM.L.J. 331 (2007).
23. Id.; see Fourteenth CMRS Report, supra note 17, at paras. 56–57; see also
NATIONAL BROADBAND PLAN, supra note 5, at 36–37; Implementation of Section 19 of the Cable Television Consumer Protection and Competition Act of 1992, First Report, 9 F.C.C.R. 7442, app. H (1994) (discussing how the presence of high sunk costs may have a decisive effect on the evolution of local market structure and the possible trade-offs between the number of actual competitors in any local cable market and the intensity of price competition that might prevail) [hereinafter First Report].
24. See Competition After Unbundling, supra note 22, at 341–44 (explaining that the equilibrium number of firms is expressed as a function of market size in expenditures, the intensity of competition, and the sunk cost of entry).
25. Marguerite Reardon, Sprint CEO Sees ‘Logic’ in Merger with T-Mobile, CNET NEWS (July 13, 2010), http://news.cnet.com/8301-30686_3-20010427-266.html; Andrew Parker & Paul Taylor, Sprint’s 4G Move Opens Way to Merger, FT.COM (July 12, 2010), http://www.ft.com/cms/s/0/c4d6eb6a-8de0-11df-9153-00144feab49a.html.
26. See Fourteenth CMRS Report, supra note 17, at para. 61 n.141 (citing An Examination of Competition in the Wireless Industry: Hearing Before the Subcomm. on Telecommunications and the Internet of the H. Comm. on Energy and Commerce, 111th Cong. 5 (2009) (written statement of George S. Ford, Chief Economist, Phoenix Center for Advanced Legal & Economic Public Studies)).
Finally, we present empirical evidence shedding light on the relationship between industry concentration and the amount of spectrum licensed for commercial services. While many believe and claim that more spectrum will necessarily lead to more competitors, this causal linkage has no basis in either theory (as just discussed) or empirics. While the PCS auctions in the mid-1990s broke the then (government-created) duopolistic market, over the past decade the amount of spectrum allocated to commercial services has risen substantially; at the same time, however, industry concentration has risen slightly as mobile communications advances toward an equilibrium market structure.28 Recent data show that more spectrum does not generally lead to lower industry concentration (see figure 4 infra). In many respects, this finding should not be a surprise. As services advance, so do the sunk costs of building and maintaining the networks and, equally important, the costs of building and maintaining a customer base. In turn, equilibrium industry concentration rises. This consequence of quality competition is explained theoretically in John Sutton’s text, Sunk Costs and Market Structure, and the logic of these “endogenous” sunk costs is embedded in recent FCC analysis.29 Fortunately, research shows that higher concentration arising from the endogenous sunk costs resulting from quality competition can have positive welfare consequences.30 The data also show that rising concentration has not been accompanied by rising prices (see figure 4 infra).31 Average revenue per minute has fallen significantly and persistently over the past fifteen years, suggesting that market structure may not be a meaningful driver of price competition at historically relevant levels of industry concentration.32
The paper is organized as follows. In Part II, we provide an overview of the FCC’s treatment of concentration in the wireless industry—from the imposition of spectrum caps in the mid 1990s, to the abolition of these
to see spectrum go to the largest providers? Or are there meaningful opportunities to be had for small and underrepresented businesses in this high-growth field? This aspect of the spectrum conversation cannot be ignored.”).
28. See generally Competition After Unbundling, supra note 22 (describing equilibrium industry structure in plain language).
29. JOHN SUTTON, SUNK COSTS AND MARKET STRUCTURE (1991); NATIONAL
BROADBAND PLAN, supra note 5, at 62 n.2 (“The key insight is that in such industries the total number of firms is likely to be limited and may even shrink as the market grows.”). 30. See George S. Ford & Michael Stern, Endogenous Sunk Costs, Quality Competition and Welfare: A Technical Note, PHOENIX CENTER PERSPECTIVES, Dec. 16, 2010, http://www.phoenix-center.org/perspectives/Perspective10-07Final.pdf.
31. See Fourteenth CRMS Report, supra note 17, at paras. 52, 186, 190 (considering Table 8 on industry concentration and Tables 18 and 19 on prices).
spectrum caps in 2001, to the re-imposition of de facto spectrum caps in the Harbinger merger review proceeding.33 In Part III, we set forth an analytical framework to evaluate the important policy questions posited above. In Part IV, we deal specifically with the commonly held belief that “more spectrum” a fortiori means “more” firms. Concluding thoughts and policy recommendations are set forth in Part V.
II.
F
ROMD
EJ
URE TOD
EF
ACTOS
PECTRUMC
APSImplications of industry concentration have always been a difficult issue for the FCC. The potential for concentration in the wireless sector is especially acute due to “the barrier to entry posed by the limited availability of spectrum.”34 As the FCC observed ten years ago in the 2000 Biennial Review:
The requirement to obtain access to spectrum constitutes a barrier to facilities-based entry into the CMRS marketplace because the supply of suitable spectrum is limited. Facilities-based mobile telephony service cannot be offered without access to suitable spectrum, and a government license is required to use spectrum to provide CMRS.35
The FCC’s first attempt at dealing with industry concentration was the imposition of spectrum caps in anticipation of the auction of PCS spectrum in 1994.36 At the time, there were two firms offering mobile telephone services in each market, one of which was the incumbent wireline provider. The FCC essentially proffered two explanations for its decision. First, it was concerned that if licensees were able “to aggregate sufficient amounts of CMRS spectrum, then it would be possible for them, unilaterally or in combination, to exclude efficient competitors, to reduce the quantity or quality of services provided, or to increase prices to the detriment of consumers.”37 Second, the FCC reasoned that a spectrum cap would “prevent licensees from artificially withholding [(i.e., “warehousing”)] capacity from the marketplace.”38
33. The purpose of a spectrum cap is to place an upper bound on the amount of spectrum available to mobile carriers, a rule that historically has been binding only for the larger carriers. The Harbinger rules restrict access by the largest wireless carriers to spectrum capacity in the secondary market, thereby operating in a similar capacity as a de jure spectrum cap.
34. 2000 Biennial Regulatory Review Spectrum Aggregation Limits for Commercial Mobile Radio Services, Report and Order, 16 F.C.C.R. 22668, para. 39 (2001) [hereinafter 2000 Biennial Review].
35. Id. at para. 40.
36. See Implementation of Sections 3(n) and 332 of the Communications Act, Third Report and Order, 9 F.C.C.R. 7988 (1994) [hereinafter 1994 CMRS Spectrum Cap Order].
Seven years later, the wireless telephone market had undergone a competitive transformation as the PCS spectrum permitted additional entry. At the end of 2000, the FCC found that “about ninety-one percent of U.S. residents lived in a county that was served, at least in part, by three or more different . . . providers, and seventy-five percent of the U.S. population lived in a county where five or more providers offered service.”39 Moreover, the FCC found that market concentration, as measured by subscriber share, was falling.40 On the other hand, it found that when it used spectrum share as the capacity measure, the Hirschman-Herfindahl Index (HHI) revealed “moderate” to “high” concentration.41
Both supply-side and demand-side conditions in the mobile sector, including scale economies, tend to favor larger firms and thus promote relatively concentrated market outcomes. Building, maintaining, and operating a mobile communications business requires significant capital expenditures on both network infrastructure and customer relationships. Industry concentration, as measured by indexes such as the HHI, is likely to be relatively high for the foreseeable future (greater than, say, the thresholds commonly used in the Merger Guidelines for defining concentrated markets).42 But high concentration does not imply poor performance, and this point was not lost on the FCC. It reasoned that “caution is appropriate in employing such measures” as the HHI because
[a]lthough more concentrated markets can be less competitive and more vulnerable to anticompetitive activity than less concentrated markets, moderate to high concentration is not necessarily a threat to competition. For example, we have previously found that “an HHI analysis alone is not determinative and does not substitute for our more detailed examination of competitive considerations.” In the case of CMRS markets, for example, limits to economies of scale, technological compatibility issues, difficulties in finding a willing seller at a reasonable price, and capital market constraints limit
39. Id. at para. 31.
40. Id. at para. 32.
41. Id. at para. 33. The HHI is an accepted measure of market concentration but has limitations in dynamic markets. The index is calculated by summing the squared market shares of each firm. For example, a market consisting of three equally sized firms has an HHI of 3,333 (= 1/3 = 33.3332 + 33.3332 + 33.3332). The number’s equivalent is simply [1/(HHI/1000)], where this ratio measures the number of hypothetical, equally sized firms in a market (irrespective of the actual distribution of market shares.
consolidation.43
Here, the FCC rejected an exclusive reliance on HHIs and instead pointed to its then-recent Sixth CMRS Report,44 which found that the wireless market was performing well. Not only was subscribership up, but also wireless prices were on the decline.45 Moreover, the FCC found that there were six nationwide wireless operators (AT&T, Cingular, Nextel, Sprint, Verizon, and VoiceStream) from which consumers could choose.46 Finally, the FCC found that “the need for direct access to spectrum is not absolute because carriers can compete in the provision of CMRS without direct access to spectrum through resale, or a mobile virtual network operator (‘MVNO’) arrangement.”47
Given the above, the FCC held that it was persuaded that competition was robust enough in CMRS markets that it was no longer appropriate to impose overbroad, a priori limits on spectrum aggregation that may prevent transactions that are in the public interest. As such, as part of the FCC’s mandatory 2000 Biennial Review, the Commission eliminated the spectrum cap regime in favor of a more nuanced, case-by-case approach, accompanied by enforcement sanctions in case of misconduct. In so doing, the FCC reasoned that it now had the necessary “flexibility to reach the appropriate decision in each case, on the basis of the particular circumstances of that case.”48
In the ten years that have followed the FCC’s removal of its original price caps, it has made new spectrum available to the market, most notably the 700 MHz and AWS spectrum made available from the DTV transition. At the same time, the FCC also approved several mergers and combinations of mobile licensees, thereby reducing the number of nationwide mobile carriers from six in 2000 to four in 2010.49 In its Fourteenth CMRS Report, the FCC found, by its own calculations, that between 2003 and 2008, average HHI had increased from 2151 to 2848—a
43. 2000 Biennial Review, supra note 34, at para. 33 (citation omitted) (citing WorldCom, Inc. & MCI Comm. Corp., Memorandum Opinion and Order, 13 F.C.C.R. 18025, 18084 (1998)). Indeed, as the Ninth Circuit recognized, “[r]eliance on statistical market share in cases involving regulated industries is at best a tricky enterprise and is downright folly where . . . the predominant market share is the result of regulation.” Metro Mobile CTS, Inc. v. NewVector Comm. Inc., 892 F.2d 62, 63 (9th Cir. 1989).
44. Implementation of Section 6002(b) of the Omnibus Budget Reconciliation Act of 1993, Sixth Report, 16 F.C.C.R. 13350 (2001) [hereinafter Sixth CMRS Report].
45. 2000 Biennial Review, supra note 34, at para. 35. 46. Id. at para. 38.
47. Id. at para. 42 (citation omitted). 48. Id. at para. 50.
rise of 697 points.50 Again, the FCC remarked that “market concentration, by itself, is an imperfect indicator of market power,” and deliberately reached no conclusions on market power.51
The evidence speaks for itself, however. By the FCC’s own account, the wireless market in the United States continues to perform exceptionally well. According to the Fourteenth CMRS Report, mobile subscribership was up,52 and consumers were benefitting from aggressive price competition in both the prepaid and postpaid markets from a variety of pricing plans.53 Indeed, average revenues per voice minute continued to hover around $0.05,54 and average revenue per text message was only around $0.011.55 Equally important, the FCC found that consumers benefited from the intense nonprice rivalry among carriers, including “1) network upgrades; 2) product information and perception, which include advertising and marketing; and 3) downstream product differentiation, which includes handset/device and application offerings.”56 According to the FCC’s analysis, therefore, the higher concentration naturally resulting from mergers in the mobile sector has not diminished market performance.57
50. Id. at para. 51. Significantly, unlike the analysis to support its decision to remove spectrum caps, the FCC in the Fourteenth CMRS Report specifically refused to count MVNOs as a competitor in the mobile wireless market in its analysis of market structure.
See id. at para. 32 (“MVNOs are not counted as separate competitors from their hosting facilities-based providers in our analysis of market structure.”). The Fourteenth CMRS Report also reports an HHI of 2220, which is computed by the investment firm Merrill Lynch. See id. at Table 41.
51. Id. at para. 55 (This was “due to the complexities of estimating market power in an industry with high fixed costs that are recovered gradually over time, difficulties with analyzing pricing plans for bundles of services, and the difficulties in obtaining accurate and suitable cost data.”).
52. Id. at para. 155.
53. Id. at paras. 86–103. There are some who like to point to the OECD’s 2009 analysis, which purports to show that the United States had among the highest mobile rates in the world, but the OECD’s analysis has been soundly discredited on its technical merits and should be given no probative value. George S. Ford,
Be Careful What You Ask for: A Comment on the OECD’s Mobile Price Metrics, PHOENIX
CENTER PERSPECTIVES, Sept. 16, 2009, http://www.phoenix-center.org/perspectives/Perspective09-03Final.pdf.
54. Fourteenth CMRS Report, supra note 17, at para. 190. 55. Id. at para. 192.
56. Id. at para. 104; see id. at paras. 104–52.
57. Of course, the mere mention of a rising HHI led some to conclude there was a competitive problem. For example, in the approving statement of FCC Commissioner Michael Copps to the Fourteenth CMRS Report, the Commissioner opined that
Nonetheless, the FCC’s enlightened economic analysis of concentration and performance is inconsistently applied. In its recent Phoenix Forbearance Order, for example, the FCC directly links concentration to market power in the most stringent of manners.58 Even in the mobile sector, the FCC appears often to be of two minds. Despite providing significant evidence of good market performance in the Fourteenth CMRS Report and rejecting market shares as a per se indicator of market power, the FCC recently revealed its interest in spectrum limitations by promulgating a rule limiting access to secondary-market spectrum by the largest mobile carriers—a de facto spectrum cap—in its Harbinger decision.59
There, Harbinger Capital Partners sought to acquire Mobile Satellite Service (“MSS”) provider SkyTerra.60 Although the respective chiefs of the International Bureau, the Wireless Bureau, and the Office of Engineering and Technology raised serious concerns about the merged entity’s potential dominance of the MSS market (including a finding that Harbinger had ownership positions in MSS competitor TerreStar, along with a variety of
sticks out like a sore thumb: the Herfindahl-Hirschman Index—a widely-recognized and highly-credible measurement of industry concentration—shows that the concentration of mobile wireless service providers has skyrocketed to a weighted average of 2848.
Id. at 11703. Commissioner Copps ignores the fact that the Report explicitly rejects this direct linkage between concentration and competition (“market concentration, by itself, is an imperfect indicator of market power”) and its conclusions regarding good market performance. Id. at para. 55. The media also focused on the industry concentration statistics.
See, e.g., Todd Shields, FCC Says Wireless Concentration Rises; AT&T Disagrees, BLOOMBERG BUSINESSWEEK (May 20, 2010), http://www.businessweek.com/news/2010-05-20/fcc-says-wireless-concentration-rises-at-t-disagrees-update1-.html; Tracy Ford, FCC Finds Wireless Sector “Concentrated,” RCR WIRELESS (May 20, 2010), http://www.rcrwireless.com/apps/pbcs.dll/article?AID=/20100520/FCC_WIRELESS_REG ULATIONS/100529993/fcc-finds-wireless-sector-.
58. Petition of Qwest Corp. for Forbearance Pursuant to 47 U.S.C. § 160(c) in the Phx., Ariz. Metro. Statistical Area, Memorandum Opinion and Order, 25 F.C.C.R. 8622 (2010) (the FCC drew conclusions of market power based primarily on market share). For a critical review of the FCC’s approach, see George S. Ford & Lawrence J. Spiwak, The Impossible Dream: Forbearance After the Phoenix Order, PHOENIX CENTER PERSPECTIVES, Dec. 16, 2010, http://www.phoenix-center.org/perspectives/Perspective10-08Final.pdf.
59. Schizophrenia is not limited to the present FCC. Despite declaring the mobile market effectively competitive in 2006, the FCC, under the leadership of Kevin Martin, imposed open platform mandates to the C-Block of the 700 MHz auction. Compare
Implementation of Section 6002(b) of the Omnibus Budget Reconciliation Act of 1993,
Eleventh Report, 14 F.C.C.R. 10947 (2006) (declaring the market effectively competitive),
other wireless competitors), what tipped the bureau chiefs’ hands was their acceptance of the merged entity’s promise to build a “4G” terrestrial (as opposed to satellite) wireless network that will provide coverage in the United States to at least 100 million people by December 31, 2012, at least 145 million people by December 31, 2013, and at least 260 million people by December 31, 2015.61 While one can certainly see the appeal of Harbinger’s offer, the bureau chiefs went one step further by adopting a de facto spectrum cap without an opportunity for public notice and comment.62
In particular, Harbinger first promised that, should it “seek to make spectrum available to either of the two largest terrestrial providers of CMRS and broadband services,”63 the merged entity would need to obtain FCC approval.64 Second, the merged entity would be required to live up to the buildout schedule proposed in the order.65 Finally, the merged entity would first obtain FCC approval before allowing traffic to the two largest terrestrial providers’ accounts to amount to more than twenty-five percent of SkyTerra’s total traffic on its terrestrial network in any Economic Area.66 These “voluntary commitments” have no apparent connection to any specific anticompetitive harm revealed by the bureau chiefs’ competitive analysis. Thus, it is reasonable to interpret this de facto “spectrum cap”67 as revealing a renewed interest in using regulation to modify market structure in mobile communications by limiting access to spectrum resources by some or all incumbent firms. For this reason (among others), we believe our analysis is timely and potentially helpful in the formulation of spectrum policy.
61. Id. at para. 56.
62. Indeed, contrary to this Administration’s promise of “transparency”—although the ex parte filings containing voluntary commitments were made on March 26, 2010—the FCC did not post these ex parte filings on EDOCS until March 29—three days after the order was released on delegated authority.See Letter from Henry Goldberg, Attorney, Goldberg, Godles, Wiener & Wright, to Marlene H. Dortch, FCC Secretary, Applications of Harbinger Capital Partners Funds and SkyTerra Communications, Inc. for Consent to Transfer Control of Licenses and Authorizations, FCC IB Docket No. 08-184 (rel. Mar. 29, 2010), http://fjallfoss.fcc.gov/ecfs/document/view?id=7020397552. Thus, it was impossible by administrative fiat for the public to have an opportunity to comment on Harbinger’s “voluntary commitment” to a de facto spectrum cap.
63. Harbinger Order, supra note 60, at para. 72. 64. Id.
65. Id. 66. Id.
III.
A
NALYTICALF
RAMEWORKEconomic theory, and antitrust policy in general, are firmly and rightly geared toward encouraging entry by new firms in most situations. Although economics has identified a number of cases in which entry may not be socially optimal (e.g., cases of extreme scale economies or “natural monopoly”), there is a recognizable bias towards encouraging entry in most discussions of public policy.68 This pro-entry orientation is easily discerned in any examination of the history of U.S. telecommunications regulation, with leading examples including the unbundling regulations of the 1996 Telecommunications Act, rules against discriminatory pricing and mandates for interconnection, and auction rules intended to increase the likelihood of spectrum license awards to new entrants.
Although this bias towards entry is understandable, it is important to recognize that economic theory also has established that the social benefits of entry, while potentially very large in the cases of monopoly and highly concentrated markets, can diminish fairly rapidly as more firms enter.69 This “drop-off” in the impact of entry depends, of course, on the nature of market competition, the costs of entry, and the probable alternative path competition would take should entry not occur. For example, the model exhibiting the greatest effect of entry is surely the Bertrand duopoly with identical firms and products, in which the entry of a single additional firm converts industry performance from monopolistic to perfectly competitive.70 In this framework, entry by any additional firms has no social return. At the other end of the spectrum, a cartelized industry that adopted an entrant into its collusive structure would exhibit no social benefit from entry, regardless of the number of entrants considered. In more realistic intermediate cases, of course, entry will reduce prices, although at a diminishing rate as entry proceeds. The Cournot model of competition is the standard for intermediate cases, and the logic of this model lies at the heart of most public policy arguments favoring entry.
68. There are limitations on the number of firms that can serve a market. This economic reality does not disqualify the entry-preference, but merely tempers it. SeeCompetition After Unbundling, supra note 22.
69. See, e.g., JEAN TIROLE, THE THEORY OF INDUSTRIAL ORGANIZATION 218–21 (1988); John E. Kwoka, Jr., The Effect of Market Share Distribution on Industry Performance, 61 REV.ECON.&STAT. 101 (1979); Competition After Unbundling, supra note 22.
Figure 1 illustrates the relationship between the number of firms and prices under alternative assumptions about the nature of competition.71 In the figure, price is measured on the vertical axis and the number of firms N (or 1/HHI) is measured on the horizontal axis.72 The monopoly price is labeled pM and marginal cost is labeled c. First, consider the relationship
between the number of firms and price under Cournot competition. As shown by the line labeled “Cournot,” as the number of firms increases, the price gradually falls toward marginal cost (that is, the perfectly competitive outcome). Note that while price continually falls with increases in N under Cournot competition, most of the price cuts from competition are realized with the first few firms. In contrast to this steady decline in prices under Cournot competition, with Bertrand competition, marginal cost pricing is obtained with only two firms (i.e., duopoly).73 The line labeled “Bertrand”
71. The figure was adapted from John Sutton. SUTTON, supra note 29, at 34.
72. If firms are identical, then HHI = 1/N. If there are two equally sized firms, then the market shares are fifty percent and the HHI is 0.50. With three firms, the shares are thirty-three percent and the HHI is 0.33.
73. This intense competition creates an interesting predication called the Bertrand Paradox. If there are fixed costs, then the marginal cost pricing outcome with two firms ensures both firms earn negative profits. Thus, entry does not occur. Put simply, competition is so intense that it never happens. The Bertrand Paradox is highly relevant for public policy analysis in telecommunications markets, and we have incorporated the idea in earlier works, including Jerry B. Duvall & George S. Ford, Changing Industry Structure: The Economics of Entry and Price Competition, PHOENIX CENTER POLICY PAPER NO. 10, Apr. 2001, http://www.phoenix-center.org/pcpp/PCPP10Final.pdf, reprinted in 7 TELECOMM.&SPACE
L.J. 11 (2001); Competition After Unbundling, supra note 22; George S. Ford et al.,Network Neutrality and Industry Structure, PHOENIX CENTER POLICY PAPER NO. 24, Apr. 2006,
1 2 3 4 N = (1/HHI) Collusion
Cournot Bertrand
Figure 1. Price and the Number of Firms
c
Price
reveals this sharp decline in price from pM to c between the first and second
firm. As just mentioned, after the second entrant, additional firms have no effect on price, so the HHI and other measures of concentration are meaningless in the Bertrand framework. Finally, there is a line labeled “Collusion.” If firms are able to collude perfectly, then the price is held at the monopoly price regardless of the number of firms. As with Bertrand, the number of firms tells us almost nothing about price. Clearly, it is Cournot Competition that is consistent with the common view that more firms implies “more competition” in the form of lower prices. The failure to see prices rise as concentration rises in the mobile sector (see Figure 2), however, suggests that price competition may actually be more intense than Cournot Competition.74
Thus, in any particular circumstance, it is vital to evaluate the likely effects of entry in light of both the observed industry structure and the probable alternative path competition could take if some form of entry were prohibited. These considerations are particularly relevant to the evaluation of the FCC policy of the “spectrum cap” (or favoritism in the auction rules), which is, in effect, a prohibition on entry by a class of credible incumbents. If one assumes, as seems correct, that the FCC policy is effective in the sense that it changes the outcome of the spectrum auction by altering which firm (or firms) obtain the desired spectrum license, then it is necessary to evaluate the outcome that the policy produces in comparison with the outcome obtained in the absence of the policy. Thus, if the practical effect of an incumbent-exclusion rule is to keep some firm, Firm 1 say, from obtaining the spectrum, then one needs to examine both what Firm 1 would have done with it, had it been allowed to win, and what the ultimate winner will do with it. It would then be possible to compare the welfare consequences of these two cases and make a credible judgment on the social welfare consequences of the prohibition.
The welfare comparison described above is not simple, but a simple model can form the conceptual basis for the comparison. This is our purpose in this section. We begin by noting that, looked at broadly, an incumbent-exclusion policy (such as spectrum caps), if it makes sense, is actually a prohibition on entry imposed on a subset of firms that already
http://www.phoenix-center.org/pcpp/PCPP24Final.pdf, reprinted as T. Randolph Beard et al., Network Neutrality and Industry Structure, 29 HASTINGS COMM.&ENT.L.J. 149 (2007).
own related assets. Further, for the policy to make any difference, it is necessary that these prohibited firms be likely actually to win the spectrum in the absence of the policy, or else the policy is meaningless. The relevance of the policy, in turn, suggests that the analyst should assume that the profits available to the prohibited firm from acquiring the spectrum must exceed those a favored entrant could obtain, or else the banned entrant would not win the auction anyway. Thus, for the incumbent-exclusion policy to make sense from the social perspective, it must be that entry by the favored entrant creates welfare gains—for example, by lowering market prices, which are sufficient to overcome the fact that the banned entrant (e.g., an incumbent) values the spectrum asset more than anyone else.
This logic appears to underlie the FCC’s spectrum cap policy and other regulatory handicaps placed on incumbent firms. In other words, by prohibiting a large incumbent from winning the spectrum at auction, the FCC expects another firm to use the spectrum to support entry into wireless voice communications and related services, thus increasing competition in these markets.
What use, though, should one assume the unwelcome bidder would make of the spectrum had it been allowed to buy the spectrum? Here, some speculation is necessary, yet it appears highly likely that this asset would not be used merely to provide greater quantities of the same voice communication products currently offered by the firm over other frequencies. Rather, discussions in the business press and elsewhere75 point to the introduction of broadband/information-type services, which are regarded as complements to existing wireless voice-grade products, and would probably be sold together with them in packages.76
In contrast to this “complementary entry,” if the incumbent-exclusion rule effectively caused a “new” entrant to join existing wireless firms in offering a standard product in competition to the offerings of the incumbents, then one would expect to see the equilibrium price of this standard offering fall in response to competitive entry. As outlined earlier, though, the extent of this price reduction would depend on the current
75. See, e.g., NATIONAL BROADBAND PLAN, supra note 5, at ch. 5; Nicholas Kolakowski, CTIA Keynotes Focus on Spectrum Crunch, Broadband Future, EWEEK.COM
(Mar. 23, 2011), http://www.eweek.com/c/a/Mobile-and-Wireless/CTIA-Keynotes-Focus-on-Spectrum-Crunch-Broadband-Future-533219/; Stacey Higginbotham, Mobile Milestone: Data Surpasses Voice Traffic, GIGAOM (Mar. 24, 2010), http://gigaom.com/2010/03/24/mobile-milestone-data-surpasses-voice-traffic/.
market structure and the nature of competition in the market—for example, Cournot or Bertrand competition. In the past, the prevalent structure in many mobile markets in the United States was a duopoly, but that has of course changed substantially in recent years, and most customers now enjoy multiple vendor options for these services.77
A. Theoretical Model
In order to make our analysis both general and simple, we proceed as follows. First, the standard voice market can be described as a Cournot oligopoly, with n firms selling identical products at identical marginal costs, which we normalize to zero. We identify Firm 1 as the seller prohibited by the auction rules from acquiring a newly available spectrum asset (which we term an incumbent-exclusion rule). In the absence of the incumbent-exclusion rule, Firm 1 would win the bid for the spectrum, and would use it to offer a complementary good that would benefit its voice service customers, conveying a competitive advantage. In the interest of simplicity and to render conservative results, we assume that Firm 1 can make no profits whatsoever from the sale of this complementary good except through the effects of its sale on the demand for its voice product. All consumer surplus and seller profits from this complementary good are ignored, so that our analysis will not be biased towards any finding that the incumbent-exclusion rule is socially wasteful.78 In our analysis, Firm 1 would win the bidding for the spectrum asset in the absence of the rule, and would use the spectrum differently than the bidder winning the asset under the exclusion rule. Further, the firm winning the asset under the incumbent-exclusion rule will dutifully enter the voice services market, increasing competition and reducing prices.
Suppose first that there was no incumbent-exclusion rule. In that case, let the prices earned by the firms be given by the simple price equations:
,
)
(
1
a
Q
P
'
(1)
Q
a
P
ifor
i
= 2, 3, …
n
(2)
77. See Implementation of Section 6002(b) of the Omnibus Budget Reconciliation Act of 1993, First Report, 10 F.C.C.R. 8844, para. 4 (1995).
where Q = q1 + q2 + . . . + qn and where a and are positive known
constants. Here the parameter a represents market size and represents the additional value created for customers of Firm 1 due to creation of the complementary product.79 We note also that, under the incumbent-exclusion rule, Equations (1) and (2) continue to describe the market if one takes = 0, and lets n rise to n + 1. Recall that all prices are net of marginal costs.
In the absence of the exclusion rule, we assume a Noncooperative Nash Equilibrium in quantities of the usual Cournot sort. First order conditions for this solution are:
0
1
' Q q
a
(3)
for Firm 1 and
0
Q qi
a
for
i
= 2, 3, . . .
n
. (4)
Under symmetry for firms 2, 3, . . . n, the solutions are:
) 1 /( ) (a' n
qi
for
i
= 2, 3, . . .
n
,
(5)
) 1 /( ) (
1 an' n
q
(6)
which satisfy the second order conditions and are unique so long as < a. Calculating market output in the equilibrium, we obtain:
, 1 1
1 '
a n n
n
Q
(7)
so that market output Q is increasing in . This result implies that the common price for Firms 2 through n, denoted Pi, falls as increases. Thus,
the introduction of the competitive advantage to Firm 1 causes its rivals’ prices to fall, in the same way that a decrease in the costs of a given firm will cause other firms to price more competitively in response. As for P1, the advantage causes P1 to rise, but less than the increase in consumer value created by the complementary good. Since P1 = Pi + , the
equilibrium response is:
. 1 1
1
' n
n d
dP
(8)
Given these responses, it is clear that the social welfare consequences of the incumbent-exclusion rule will depend on a comparison of the benefits of the complementary good and resulting competitive effects, versus the benefits of increased competition through conventional entry into the standard good market.
In our assessment of the welfare effects of an exclusion rule, we start by “stacking the deck” against the finding that the incumbent-exclusion rule is bad policy by focusing on consumer welfare only. This biases the analysis because firms are always harmed with entry in a Cournot framework. To begin, we ignore this effect on firms, thus inflating the welfare consequences of an incumbent-exclusion rule. The simple linear form of demands and normalized marginal costs imply that consumer surplus with entry by Firm 1 with the complementary good is just:
. 2 1 ) ,
(n Q2
CW '
(9)
Similarly, with the incumbent-exclusion rule, consumer surplus can be suggestively written as CW(n + 1, 0), and simple algebra establishes that CW(n, ) > CW(n + 1, 0) if and only if:
. 2 1
! '
n
a
(10)
Condition (10) is elegant and highly suggestive: as an approximation, the incumbent-exclusion rule actually reduces consumer welfare, ignoring any benefits or costs to firms and benefits from the complementary market itself, whenever the effect of the complement on the value of the standard good, as a percentage of willingness to pay for the standard good, exceeds the statistic 1/(n + 2). Put another way, it is clear that society would prefer introduction of the complementary good over further entry into the standard good market when either (1) the complement is sufficiently value-creating (a large ), or (2) the existing market is already sufficiently competitive (a large n, or intense rivalry).
B. Illustrations of the Theory
above the curve illustrates the set of parameter values for which consumers would be better served by abandoning the entry prohibitions embodied in the incumbent-exclusion rule. The curve has negative slope because the value created by the complementary good in the standard market need not be as large when the standard good market is sufficiently competitive to begin with. The logic is important. The larger the number of firms in the market (that is, the more competitive the existing market), the more likely an incumbent-exclusion rule is bad policy. So, while the spectrum caps (a form of an incumbent-exclusion rule) that applied early in the evolution of mobile services may have made sense given the duopoly structure of the market, in the present environment, when nearly every consumer has a choice among four providers,80 the incumbent-exclusion rule is not as easily supportable on welfare grounds. Further, historically, the potential for important innovative services was much lower than today, given the evolution of wireless broadband services.
Similarly, Figure 3 provides the same analysis when total social welfare is used (consumer-plus-producer surplus). Note that we have significantly rescaled the vertical axis. As explained above, including both consumer and producer surplus greatly tilts the analysis towards a finding of welfare harm from the incumbent-exclusion rule as modeled here, but only because the consumer welfare standard alone is biased. This difference arises because in Cournot competition (and all “intermediate” models of competition), entry reduces prices, albeit at a decreasing rate.
Low prices reduce aggregate firm profits (i.e., a component of producer surplus). By forcing entry to take a form that reduces the profits of all incumbent firms, the incumbent-exclusion policy is unlikely to increase social welfare unless it provides very significant benefits to consumers through the competition-price reduction effect. However, that effect is not very large in Cournot and similar models beyond a few firms.
These figures highlight several features of the incumbent-exclusion policy debate, which have been given too little weight in previous discussions—perhaps because concentration was much higher historically and no services were contemplated other than voice service. As is always the case, the social value of a policy cannot be determined unless one compares the likely outcomes with and without the policy. Given the present high levels of competition in the domestic mobile market, it is unlikely that additional entry will lead to substantial competitive price effects. The CRMS Reports and the FCC merger approvals consistently indicate that the FCC believes there is no meaningful relationship between concentration and market performance under current market conditions.81 The price gains from more entry, then, are expected to be small or absent altogether. Alternately, the benefits of expanding spectrum assets for the purpose of providing broadband services are presumed to be high. The policy bias, it seems, should be in favor of more spectrum in the hands of
existing firms. Further evidence in this regard is provided in the next section.
IV.
“M
ORE”
S
PECTRUMD
OESN
OTA
F
ORTIORIM
EAN“M
ORE”
F
IRMSThe notion that more spectrum leads to more firms, or that incumbent-exclusion rules lead to more firms, is based on the presumption that the only factor limiting the number of firms is the amount of or access to spectrum resources. This view ignores the substantial capital investments and expenses required to build, maintain, and operate a mobile network. Moreover, it ignores the complexities and realities of managing a large customer base, and the interdependencies in demand and cost across the range of products offered over such networks. Put simply, dividing a chunk of spectrum into ten pieces does not imply that ten firms are financially viable. It is the supply- and demand-side conditions of the market, of which spectrum resources are but a part, that determine the equilibrium number of firms.82 In the above analysis, we assumed that the spectrum leads to greater numbers of financially viable firms, so as to give the incumbent-exclusion policy the most favorable theoretical treatment. Economics and history, however, suggest otherwise.
A. Theoretical Evidence
The prior analysis looks at the tradeoff between additional entry-based competition and the utility derived from the creation of a complementary good. This analysis assumed that entry and exit into the standard market was costless. In reality, there are likely to be substantial fixed costs associated with entry by a new firm into the telecommunications marketplace. The presence of fixed costs allows a long-run characterization of the number of firms likely to be present in the market. Entry and exit are assumed to occur until economic profits are driven to zero.
The profit level of a firm producing the standard good will be a comparison of its net revenue (net price times quantity) and the level of fixed costs. We will denote the fixed costs by the symbol F. Combining equations (7) and (2) yields the (net) price level of the standard good and equation (5) provides a characterization of the quantity. Setting the profit level of the standard good equal to zero will provide a characterization of the long-run number of firms present in the standard market. The number
82. Competition After Unbundling, supra note 22, at 335, 341–59; First Report, supra
of long-run firms, nLR, will solve the following equation:
0 1
2
» ¼ º «
¬ ª
'
F
n a
LR
(11)
If the number of firms is treated as a continuous variable, then the impact of the sale of new spectrum on one of the existing firms (for the creation of a complementary good) can be characterized by:
F d
n
d LR 1
'
(12)
The long-run loss to competition in the standard market could therefore be quite low if there are relatively large fixed costs associated with entry into the standard market. (In reality, the fixed costs are very large, limiting the number of successful firms to a small number.83) Furthermore, the loss of competition might even be zero due to the fact that the number of firms is, in reality, a discrete value. The amount of new spectrum may be insufficient to actually support an additional firm in the standard marketplace due to the fixed costs. In such a case, making the new spectrum available to an existing firm would generate welfare gain via the development of a complement without any long-run loss of competition in the standard market. In other words, there may not be a tradeoff between more quality or more firms, since the number of firms that can viably serve the market may be insensitive to spectrum policy due to the underlying supply- and demand-side economic conditions of the market.
B. The Historical Evidence
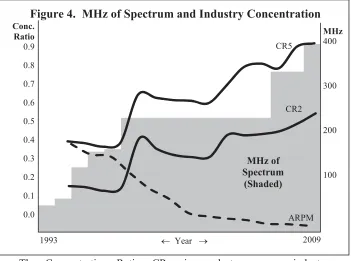
Figure 4 illustrates the relationship between the market shares of the largest mobile telephony firms and the total MHz of spectrum made available by the FCC to such firms over the period from 1993 through 2009. Total spectrum is shown by the shaded area in the figure and is rising over the entire time period. In 1993, there was 50 MHz of spectrum used for mobile telephony. Including all auctioned spectrum, this number rose to 361 MHz by 2009.84
83. SeeFourteenth CMRS Report, supra note 17, at para. 61.
The Concentration Ratio, CRn, is used to measure industry concentration. The Concentration Ratio is computed as the sum of the n largest firms in the market. That is, CR2 measures the summed market shares of the two largest firms, and CR5 measures the market share of the five largest firms. Both the CR2 and the CR5 are illustrated in the above figure.85 Finally, the average revenue per minute for mobile telephony is provided. All data are computed at the national level.
The figure shows clearly the following. First, the amount of spectrum has risen, yet industry concentration—as measured by the concentration ratio—has not declined. Thus, historical evidence does not support the notion that more spectrum means a lower level of industry concentration. Second, while concentration has risen over this interval, the price of mobile telephony has fallen consistently over the period.86 Therefore, historical evidence also does not support the notion that higher concentration leads to higher prices. The latter result has important implications for the theory. If
85. The data is compiled from the FCC’s CMRS Reports (various years), which are available at Commercial Mobile Radio Services (CMRS) Competition Reports, FED.COMM. COMM’N,http://wireless.fcc.gov/index.htm?job=cmrs_reports (last visited Apr. 16, 2011). 86. Average revenue per minute data is compiled from the FCC’s CMRS Reports (various years). See id. The data are adjusted by the Consumer Price Index.
Figure 4. MHz of Spectrum and Industry Concentration
CR5
CR2
ARPM MHz of
Spectrum (Shaded)
2009 1993 m Year o
Conc. Ratio 0.9
0.8
0.7
0.6
0.5
0.4
0.3
0.2
0.1
0.0
MHz 400
300
200
changes in concentration (or the number of firms) do not impact market performance, then the gains from an incumbent-exclusion rule are likely to be small and the net losses large.
We note that these data cover many years, and technology has evolved over the years. As such, the trends in the figure are merely suggestive. Nevertheless, the historical data cannot be ignored and, if considered, it provides important insights for the economic value of incumbent-exclusion policies.
V.
C
ONCLUSIONSWith the National Broadband Plan’s promise of 500 additional MHz of spectrum for commercial purposes, the question of how to allocate those resources among competing uses and users will dominate the communications policy debate over the coming years. The value of that spectrum depends critically on allocation choices. In this Article, we provide a policy-relevant, economically motivated framework to aid in such decisions, with a focus on incumbent-exclusion rules—including but not limited to formal spectrum caps. The analysis focuses on the efficacy of exclusion rules (or similar regulations limiting access by existing firms to new spectrum) for promoting economic welfare and maximizing the value of spectrum resources. At a basic level, the analysis describes the tradeoffs between dividing a fixed amount of spectrum into either many small pieces or a few big pieces. Since advanced services, such as mobile broadband, demand that each firm possess large amounts of spectrum, the relevant tradeoff is potentially between many firms selling less advanced services versus few firms selling more advanced services.
always enticing and public policy often plays a role in promoting competition, the FCC must be realistic in its expectations.