October 2013
Saving Homes? Bankruptcies and Loan
Modifications in the Foreclosure Crisis
Alan M. WhiteCarolina Reid
Follow this and additional works at:http://scholarship.law.ufl.edu/flr
Part of theBankruptcy Law Commons, and theLaw and Economics Commons
This Essay is brought to you for free and open access by UF Law Scholarship Repository. It has been accepted for inclusion in Florida Law Review by an authorized administrator of UF Law Scholarship Repository. For more information, please [email protected].
Recommended Citation
Alan M. White and Carolina Reid,Saving Homes? Bankruptcies and Loan Modifications in the Foreclosure Crisis, 65 Fla. L. Rev. 1713 (2013).
MODIFICATIONS IN THE FORECLOSURE CRISIS
Alan M. White Carolina Reid∗
Abstract
Do homeowner bankruptcy filings work to delay or prevent home foreclosures, and how do they compare to voluntary loan modifications specifically targeted to mortgage relief? The 2007–2012 financial crisis provides a unique opportunity to assess whether bankruptcy can help homeowners avoid the negative consequences of over-indebtedness and mortgage default. This empirical study analyzes a large, loan-level mortgage dataset to determine which variables are associated with delinquency and bankruptcy filing, and in turn, whether filing bankruptcy or receiving a loan modification measurably influences subsequent loan outcomes (e.g., foreclosure sale, prepayment, or default cure). Overall, we find that bankruptcy filings delay foreclosures but are not generally effective in curing payment defaults, especially when compared to modifications negotiated outside of bankruptcy, which are highly effective. We also find, consistent with prior research, that variations in state bankruptcy and foreclosure law greatly influence debtor outcomes from one state to another. Bankruptcy filing is more effective in states with nonjudicial foreclosure and limited homeowner protections.
INTRODUCTION ... 1714
I. BACKGROUND AND PRIOR RESEARCH ... 1717
II. DATA AND DESCRIPTIVE STATISTICS ... 1723
III. ANALYTICAL APPROACH AND FINDINGS ... 1727
A. Loan Delinquencies, Bankruptcies, Modifications, and Loan Outcomes ... 1729
B. State-Level Variations in Bankruptcies and Loan Performance Outcomes ... 1734
CONCLUSION ... 1736
INTRODUCTION
The financial crisis of 2007–2012 provides a unique opportunity to study consumer indebtedness and to examine how bankruptcy law works for delinquent homeowners. According to estimates by the Center for Responsible Lending, nearly three million borrowers who took out a mortgage between 2004 and 2008 lost their homes to foreclosure by February 2011, and nearly four million more households were seriously delinquent on their payments and at risk of ending up in
mortgage default.1 In addition, at the end of 2011, an estimated eleven
million homeowners were “underwater” on their mortgage, meaning that they owed more on their mortgage than the current market value of their home. Nearly 40% of underwater borrowers also had second
mortgage liens.2 Consumer debt also rose to historic highs leading up to
the subprime crisis; “from 1980 to 2004, revolving debt per household increased nearly five-fold in real terms, rising from 3.2% to 12.5% of
U.S. median family income.”3
In this Article, we explore whether filing bankruptcy can help these consumers address their indebtedness problems and save their homes from foreclosure. U.S. bankruptcy law offers some specific tools that are particularly relevant to the foreclosure crisis. These include: (1) rescheduling mortgage payments; (2) discharging wholly unsecured junior mortgage loans in Chapter 13, which should be helpful to homeowners given the large number of second liens that were taken out during the boom; and (3) the more general benefit of discharging credit card and other debt to allow income to be dedicated to mortgage payments. In 2009, members of Congress unsuccessfully attempted to amend the Bankruptcy Code to give judges the authority to write down mortgages on a primary residence to the current fair-market value of the
property.4 Even though this policy initiative failed, there is reason to
1. Deborah Bocian et al., Lost Ground, 2011: Disparities in Mortgage Lending and Foreclosures, CTR. FOR RESPONSIBLE LENDING 4 (Nov. 2011), http://www.responsiblelending.org/ mortgage-lending/research-analysis/Lost-Ground-2011.pdf.
2. Vicki Been et al., Essay: Sticky Seconds—The Problems Second Liens Pose to the Resolution of Distressed Mortgages, FURMAN CTR. FOR REAL EST. & URB. POL’Y 2 (Aug. 2012),http://furmancenter.org/files/publications/Essay_Sticky_Seconds_--_The_ Problems_Second_Liens_Pose_to_the_Resolution_of_Distressed_Mortgages.pdf.
3. Michelle J. White, Bankruptcy Reform and Credit Cards, 21 J. ECON. PERSP., Fall 2007, at 175, 175–76 (2007).
believe that bankruptcy could help some borrowers obtain relief.
A second option for consumers facing foreclosure is loan modification. Loan modifications have been the primary policy response to the foreclosure crisis. In 2009, the U.S. government announced the Making Home Affordable program, which included a
modification program (HAMP) and a refinance program (HARP).5
HAMP allocated $75 billion to loan modification efforts, with a goal of
reaching three to four million distressed borrowers.6 Although in theory
both borrower and investor are better off avoiding foreclosure, in practice it has proven to be much more difficult to modify loans, and the number of modifications has fallen significantly short of the number of distressed borrowers. For example, in its first year, HAMP resulted in 230,801 permanent modifications at a time when millions of mortgage
borrowers faced foreclosure.7 Research on loan modifications has
identified several barriers to the loan modification process, including
securitization,8 and limited incentives for servicers to modify loans or
invest in building the capacity to respond to the volume of distressed borrowers.9
5. Jean Braucher, Humpty Dumpty and the Foreclosure Crisis: Lessons from the Lackluster First Year of the Home Affordable Modification Program (HAMP), 52 ARIZ. L. REV. 727, 748 & n.97 (2010).
6. Id. at 729, 763; see also NEIL BAROFSKY, BAILOUT: HOW WASHINGTON ABANDONED MAIN STREET WHILE RESCUING WALL STREET 127 (2012).
7. Braucher, supra note 5, at 729.
8. Kurt Eggert, Comment on Michael A. Stegman et al.’s “Preventive Servicing Is Good for Business and Affordable Homeownership Policy”: What Prevents Loan Modifications?, 18 HOUSING POL’Y DEBATE 279, 279, 287–92 (2007); Anna Gelpern & Adam J. Levitin, Rewriting Frankenstein Contracts: Workout Prohibitions in Residential Mortgage-Backed Securities, 82 S. CAL. L. REV. 1075, 1087–112 (2009); Tomasz Piskorski et al., Securitization and Distressed Loan Renegotiation: Evidence from the Subprime Mortgage Crisis 1–2 (Chi. Booth Sch. of Bus., Research Paper No. 09-02, 2010), available at http://papers.ssrn.com/sol3/papers.cfm?abs tract_id=1321646. Some researchers, however, have suggested that securitization is a red herring when it comes to modifications, showing for example that loans held in portfolio are no more or less likely to be modified than loans that are held in mortgage backed securities. See
Manuel Adelino et al., Why Don’t Lenders Renegotiate More Home Mortgages? Redefaults, Self-Cures, and Securitization 4–6 (Fed. Reserve Bank of Bos., Pub. Policy Discussion Paper No. 09-4, 2009), available at http://www.bos.frb.org/economic/ppdp/2009/ppdp0904.pdf. Instead, they contend that lenders are reluctant to modify loans for two key reasons. First, approximately 30% of borrowers “self-cure,” meaning that they bring their loans current on their own. In this instance, lenders would lose revenue unnecessarily by offering a modification.
Id. at 7. Second, lenders may also be concerned that if a borrower redefaults after a modification, the modification will have simply postponed foreclosure. In such a case, if the housing market continues to decline, the lender would recover even less in foreclosure in the future. Id.
Interestingly, only a few studies have examined the relationship
between the foreclosure crisis and bankruptcy filings,10 and even fewer
have considered the effectiveness of both bankruptcies and modifications. This Article seeks to help fill that gap. Evidence on the relationship between bankruptcy and the foreclosure crisis is mixed. While bankruptcies have increased in states with the highest rates of foreclosure, such as Arizona and Nevada, other states such as Tennessee
and Alabama continue to see extremely high levels of bankruptcies,11
despite the fact that their housing and mortgage markets have been more insulated from the boom and bust cycle seen in the sand states.12 Indeed, consumer bankruptcy filings rose steadily but slowly during the subprime crisis period without any noticeable decline during the months
that modifications peaked.13 In addition, between 2006 and 2009,
consumer filings for Chapter 13—the type of bankruptcy designed to offer debtors tools to restructure mortgages and other secured debt—
actually declined, from roughly 40% to about 25% of bankruptcies.14
Superficially, it would appear that bankruptcy filings, and especially Chapter 13 filings, did not rise and fall in response to mortgage debt distress or foreclosure activity.
In order to better understand the role that the U.S. bankruptcy system has played in the subprime crisis, this study looks at a large database of subprime and “Alt-A” mortgage loans and their performance from 2007 to 2011. We begin by setting the context for the empirical study by exploring trends in bankruptcy filings in the data. We then present three sets of models. First, we explore which factors influence the likelihood that a mortgage loan ever becomes sixty-days delinquent. Second, we assess the factors that influence the likelihood that a borrower will file bankruptcy or receive a loan modification, conditional on the loan being at least sixty-days delinquent. Third, we model the effect of bankruptcy filing and loan modification on subsequent loan performance. How did distressed homeowners who filed bankruptcy fare compared to those who did not file for relief or to those who instead pursued a loan modification? In the final Part we explore state variations in bankruptcy
10. Wenli Li & Michelle J. White, Does Bankruptcy Reduce Foreclosure? 3 (Dec. 2011) (unpublished manuscript) (on file with American Economic Association), available at
http://www.aeaweb.org/aea/2012conference/program/retrieve.php?pdfid=410. 11. See infra Figure 4.
12. See Steve Matthews, States Hardest Hit by Housing Collapse Lead U.S. Jobs Recovery, BLOOMBERG (Mar. 10, 2012, 12:00 AM), http://www.bloomberg.com/news/2012-03-09/states-hardest-hit-by-real-estate-collapse-lead-u-s-labor-market-recovery.html.
13. See infra Figure 1.
filings and borrower outcomes.
I. BACKGROUND AND PRIOR RESEARCH
Consumer homeowners typically seek relief under either Chapter 7
or Chapter 13 of the Bankruptcy Code.15 Chapter 7 requires the debtor
to surrender all nonexempt property for distribution to creditors. In
return, the debtor’s debts are discharged, with some exceptions.16
Chapter 13 permits debtors with regular income to keep their property and to repay creditors in whole or in part by making monthly payments to a Chapter 13 trustee, who then distributes the payments to creditors.17 In either type of bankruptcy, the filing acts as an automatic stay of any foreclosure action.18
Both Chapter 7 and Chapter 13 bankruptcy allow a distressed homeowner to reduce or eliminate unsecured debts, such as credit card
and medical bills.19 Discharging this unsecured debt can be a valuable
tool for homeowners struggling to meet mortgage payments by freeing
up some of their income.20 Chapter 13 also permits a homeowner to
gradually cure a default in mortgage payments by making future
payments and liquidating arrears over the life of the payment plan.21
Chapter 13 plans require repayment in three to five years.22 The
foreclosure stay continues until the payment plan is completed, unless the case is dismissed or the stay is lifted, which often happens when the
homeowner does not make plan payments.23
While Chapter 13 permits debtors to modify the terms of most of their debts, a special provision prohibits modification of a first lien
residential mortgage without the lender’s consent.24 Thus a Chapter 13
payment plan must include repaying the first mortgage debt without
changes to the principal, interest rate, or term.25 Chapter 13 does,
however, permit voiding second mortgages (“strip-down”) when the first mortgage exceeds the property value, leaving the second mortgage
15. Levitin, supra note 4, at 579. 16. Id.
17. Id. at 579, 643.
18. 11 U.S.C. § 362(a) (2012).
19. John Eggum et al., Saving Homes in Bankruptcy: Housing Affordability and Loan Modification, 2008 UTAH L. REV. 1123, 1126; see also David L. Balser, Section 707(b) of the Bankruptcy Code: A Roadmap with a Proposed Standard for Defining Substantial Abuse, 19 U. MICH. J.L. REFORM 1011, 1013–15 (1986).
20. Eggum, supra note 19, at 1126. 21. Id.
22. See id. at 1143. 23. Id. at 1144 & n.81.
24. See Levitin, supra note 4, at 573–75 n.26, 581–82; see also 11 U.S.C. § 1322(b)(2), (5) (2012).
effectively unsecured.26 For mortgage borrowers with a second lien, then, Chapter 13 could provide significant relief, and help to bring the debt owed on the home more in line with current home values. Moreover, filing under either Chapter 7 or Chapter 13 stays any foreclosure, which may permit additional time to negotiate a voluntary modification with the lender. This may be especially important in states with quick, nonjudicial foreclosure processes. Thus, bankruptcy can provide homeowners additional time to negotiate with their lender, eliminate competing payment obligations for other debts (including underwater junior mortgages), and allow a homeowner to cure a payment default, albeit without otherwise modifying mortgage terms. It is therefore plausible to expect that homeowners affected by the foreclosure crisis would in some cases file bankruptcy in order to delay or prevent foreclosure.
In contrast to bankruptcy filings, loan modifications are specifically designed to address borrowers’ ability to repay their mortgages. “Loan modification” is a general term that applies when the original contract governing a loan is changed. It typically involves reducing the interest rate and monthly payment, extending the loan term, or reducing the
principal owed on the loan.27 However, “loans can be modified in
multiple ways, and not always in a way that is favorable to the
borrower.”28 For example, most pre-HAMP voluntary modifications
increased a borrower’s monthly payment as well as the principal owed
on the loan.29 Not surprisingly, studies analyzing the impacts of these
loan modifications found high rates of subsequent default.30 In addition, early policy efforts—such as HOPE NOW’s efforts to set industry guidelines and the government’s Hope for Homeowners program—did little to streamline the modification process, nor did they provide incentives to servicers to step up their efforts.31
In 2009, the U.S. government announced the Making Home Affordable Program (HAMP), which allocated $75 billion to loan
modification efforts.32 Under the program, eligible borrowers work with
26. Id. at 582 n.46.
27. See J.M. Collins & C.K. Reid, Who Receives a Mortgage Modification? Race and Income Differentials in Loan Workouts 3 (Jan. 18, 2011) (unpublished manuscript), available at
http://ssrn.com/abstract=1743159. 28. Id.
29. See Alan M. White, Deleveraging the American Homeowner: The Failure of 2008 Voluntary Mortgage Contract Modifications, 41 CONN. L. REV. 1107, 1112 & n.19 (2009). 30. See, e.g., OFFICE OF THE COMPTROLLER OF THE CURRENCY & OFFICE OF THRIFT SUPERVISION, DEP’T OF THE TREASURY, OCC AND OTS MORTGAGE METRICS REPORT 4 (2008), http://www.occ.treas.gov/publications/publications-by-type/other-publications-reports/mort gage-metrics-q3-2008/mortgage-metrics-q3-2008-pdf.pdf.
the servicer to reduce their monthly payments to 38% of their income, and then HAMP provides a subsidy to further reduce the payments to
31%.33 To overcome incentive barriers, servicers also receive an
up-front fee of $1,000 for each modification, plus “pay for success” fees on
performing modified loans of $1,000 per year for up to three years.34
Borrowers are eligible for a HAMP modification on first-lien loans for owner-occupied properties with an unpaid principal balance of less than
$729,750 originated on or before January 1, 2009.35 All borrowers must
document their income by providing a signed IRS 4506-T form to share tax data with the servicer,36 their two most recent pay stubs, a copy of a their most recent tax return, and a signed affidavit of financial hardship.37
Despite the policy emphasis on loan modifications as a solution to the foreclosure crisis, very few loans are ever modified. Even with HAMP, the scale of modifications is still small compared to the number of seriously delinquent loans, with estimates ranging between 3% and
8% depending on how “modification” is defined.38 This suggests that
not all borrowers in distress will be able to obtain a loan modification, and may seek bankruptcy as another form of relief. In particular, borrowers with second mortgages may face a particularly hard time getting a modification; junior liens can complicate the loan renegotiation process since multiple investors with different interests may thwart servicers’ efforts to provide the borrower with an effective modification.39
Despite the fact that distressed borrowers have these two different strategies available to save their homes, the legal and economic literature on mortgage borrower bankruptcy and loan modifications are largely separate. For example, Yan Zhang’s recent study on foreclosures and mortgage modifications deliberately excluded mortgages in
33. Id. at 752.
34. Id. HAMP also provides bonus incentives of $1,500 and $1,000 to lender–investors and servicers, respectively, and an additional $500 to servicers for modifications made while a borrower is still current on mortgage payments but at imminent risk of default. Id.
35. Braucher, supra note 5, at 748–49.
36. Request a Home Affordable Modification, MAKING HOME AFFORDABLE.GOV, http://www.makinghomeaffordable.gov/get-started/request-modification/Pages/default.aspx (last visited Sept. 8, 2013).
37. See Proof of Income Checklist, MAKING HOME AFFORDABLE.GOV, http://www.makinghomeaffordable.gov/get-started/request-modification/Pages/checklist.aspx (last visited Sept. 8, 2013); Request for Modification and Affidavit (RMA), MAKING HOME AFFORDABLE.GOV (form), http://www.makinghomeaffordable.gov/get-assistance/request-modification/Documents/ RMA%20Interactive%20-%20Updated%2011.10.09.pdf (last visited Sept. 8, 2013).
bankruptcy because of their peculiar performance characteristics.40 In addition, only a few studies have focused on the interactions between bankruptcy and mortgage default outcomes, and many of these predate the most recent foreclosure crisis.
First, a few studies have examined the characteristics that lead to bankruptcy filing. One important finding in the literature is that not all
homeowners who file bankruptcy are delinquent or facing foreclosure,41
which suggests that many other reasons can lead to a bankruptcy filing. However, recent research suggests that homeowners who file Chapter
13 are usually seeking to save their home from foreclosure.42 In
addition, homeowners who file for bankruptcy generally have high
payment-to-income ratios and little or no equity in their homes.43 These
studies suggest that one should find a relationship between mortgage delinquency and bankruptcy filings, especially as the housing market downturn eroded equity that borrowers could tap to resolve unpaid debts.
Second, and directly related to this study, a small number of studies have examined whether bankruptcy filing can prevent or cure mortgage default. Although focused on the time period before the foreclosure crisis, Professor Sarah W. Carroll and Wenli Li examined whether
Chapter 13 plans to cure mortgage arrears were successful.44 They
focused on a sample of homeowners in Delaware who filed bankruptcy in 2001 and 2002, and observed the subsequent loan performance
through October 2007.45 Carroll and Li found that bankruptcy filers lost
their homes in 28% of cases, compared with 43% of homeowners who entered foreclosure and did not file bankruptcy.46
In examining the impact of the Bankruptcy Abuse Prevention and Consumer Protection Act of 2005 (BAPCPA), Jiequn Guo found that from 2003 to 2006, the percentage of bankruptcy filers who were delinquent on their mortgage increased and that the percentage of borrowers in bankruptcy who were able to “cure” their loan decreased
40. See Yan Zhang, Does Loan Renegotiation Differ by Securitization Status? An Empirical Study 8–9 (Dec. 2010) (unpublished manuscript), available at
http://ssrn.com/abstract=1773103.
41. E.g., Melissa B. Jacoby, Home Mortgage Problems Through the Lens of Bankruptcy, 10 LOY. J. PUB. INT. L. 171, 176 (2009).
42. Michelle J. White & Ning Zhu, Saving Your Home in Chapter 13 Bankruptcy 2 (Nat’l Bureau of Econ. Research, Working Paper No. 14179, 2008).
43. See Raisa Bahchieva et al., Mortgage Debt, Bankruptcy, and the Sustainability of Homeownership, in CREDIT MARKETS FOR THE POOR 73, 78–80, 94–96 (Patrick Bolton & Howard Rosenthal eds., 2005); see also Eggum, supra note 19, at 1158.
44. Sarah W. Carroll & Wenli Li, The Homeownership Experience of Households in Bankruptcy, 13 CITYSCAPE, no. 1, 2011, at 113, 114–16.
significantly.47 Guo concluded that BAPCPA restricted bankruptcy filings to mortgage borrowers who were in greater distress and were therefore more likely to fail than the class of borrowers who filed
bankruptcy prior to the amendments to the Bankruptcy Code.48
Only a couple of studies have examined outcomes for consumers during the post-2007 foreclosure crisis. Among a sample of homeowners who filed Chapter 13 and did not complete their plans, Professor Katherine Porter found low rates of success in preventing
default.49 According to Porter, 70% of homeowners filing Chapter 13 in
2008 and 2009 sought to save their home, but the vast majority of cases
were dismissed and the lender likely foreclosed.50 Finally, an early
working paper by Wenli Li and Michelle J. White found that relatively few borrowers facing foreclosure sought relief through bankruptcy. For those who did, bankruptcy filings delayed both the filing of foreclosure and the conclusion of the foreclosure sale.51
Compared to the literature on bankruptcy and mortgage default, the literature on the determinants of mortgage modifications and loan
outcomes is vast.52 While not reviewed extensively here, these studies
reveal the factors that influence modification and borrower outcomes, although no study of mortgage default outcomes considers bankruptcy as a potential form of relief.
For example, Professor Sewin Chan and co-authors examined mortgage loans in New York City originated between 2003 and 2008,
with performance observed through October 2010.53 They found that, of
homeowners who received a foreclosure notice, only 14% ultimately lost their home in a foreclosure sale,54 and about half remained active at
the end of the observation period, although most were still delinquent.55
47. Jiequn Guo, The Impact of the 2005 Bankruptcy Law on Subprime Mortgage Performance, 16 J. STRUCTURED FIN., Spring 2010, at 33, 35–36.
48. See id. at 36.
49. Katherine Porter, The Pretend Solution: An Empirical Study of Bankruptcy Outcomes, 90 TEX. L. REV. 103, 144–47 (2011).
50. Id. at 132, 136, 147.
51. Li & White, supra note 10, at 15–16.
52. See, e.g., Adelino et al., supra note 8, at 2; Vicki Been et al., Determinants of the Incidence of Loan Modifications 3–4 (NYU Law and Econ. Working Papers, Working Paper No. 287, 2011), available at http://lsr.nellco.org/nyu_lewp/287; Sewin Chan et al., Pathways After Default: What Happens to Distressed Mortgage Borrowers and Their Homes? 1 (NYU Law & Econ. Research Paper Series, Working Paper No. 11-33, 2011), available at
http://ssrn.com/abstract=1928212; Collins & Reid, supra note 27, at 2; Cordell et al., supra note 9, at 231; Roberto G. Quercia & Lei Ding, Loan Modifications and Redefault Risk: An Examination of Short-Term Impacts, 11 CITYSCAPE, no. 3, 2012, at 171, 172–73 (2009).
53. Chan et. al., supra note 52, at 11–13. 54. Id. at 13.
The Chan study treated modification as a competing outcome but did
not study bankruptcy filings.56 It found that owner–occupants who had
been in their homes longer were generally more likely to obtain a
modification and less likely to lose their homes at foreclosure sales.57
On the other hand, borrowers with higher credit scores were less likely to receive modifications, perhaps because servicers expected them to
cure defaults without modification.58 Geographically, communities with
greater home price depreciation and more subprime lending concentration saw higher foreclosure sale rates.59 Professor J.M. Collins and Carolina Reid studied the impact of mortgage modifications on foreclosure outcomes using the same data as this Article. They found that completed foreclosure sales were associated with higher loan-to-value (LTV) ratios, higher interest rates, and higher rates of home price
decline in the property neighborhood.60 They also found that
modification significantly reduced the likelihood of an eventual foreclosure,61 a result confirmed in our study.
Other studies have examined the role of state laws or “delays” in the
foreclosure process on borrower outcomes.62 One study, for example,
looked at variation in state legislation to determine the impact of delay on foreclosures.63 The study found that borrowers in judicial foreclosure states, which take significantly longer to conclude the foreclosure
process, are no more likely to cure or renegotiate their loans.64 On the
other hand, Collins and coauthors used a “border” model and found that judicial foreclosure requirements slightly increased the probability of a formal renegotiation of contract terms or a modification.65
To summarize, prior research demonstrates that homeowners often file for bankruptcy to prevent foreclosure. Bankruptcy seems to improve a homeowner’s chances of preventing, or at least delaying, foreclosure.
56. See id. at 1–2. 57. See id. at 5. 58. Id. at 10. 59. Id. at 26.
60. See Collins & Reid, supra note 27, at 11. 61. Id. at 12.
62. See J. Michael Collins et al., State Mortgage Foreclosure Policies & Lender Interventions: Impacts on Borrower Behavior in Default,30 J. POL’Y ANALYSIS & MGMT. 216, 218 (2011); Kristopher Gerardi et al., Do Borrower Rights Improve Borrower Outcomes? Evidence from the Foreclosure Process 1–2 (Nat’l Bureau of Econ. Research, Working Paper No. 17666, 2011), available at http://www.nber.org/papers/w17666; Shuang Zhu & R. Kelley Pace, The Influence of Foreclosure Delays on Future Default, Loan Losses, and Contract Rates 2 (Dec. 16, 2010) (unpublished manuscript), available at http://srsabr2011.files.wordpress.com/ 2011/01/foreclosure_pace_zhu_1204.pdf.
63. Gerardi et al., supra note 62, at 1–2. 64. Id. at 16.
Homeowner success rates in bankruptcy are still low, however, and many homeowners fail to complete Chapter 13 repayment plans. By restricting bankruptcy access to the most distressed debtors, BAPCA may have reduced a homeowner’s chance of preventing foreclosure. In contrast, negotiated mortgage modifications undertaken since 2008 have significantly reduced the likelihood of a defaulted mortgage ending with a foreclosure sale, which suggests that modifications may be preferable to bankruptcy when the goal is to save a primary residence from foreclosure.
Our study adds to the literature by comparing the effect of modification and bankruptcy filing on the prevention of home foreclosures in the context of the recent foreclosure crisis. In other words, this study assesses differences in foreclosure outcomes for a national sample of mortgage holders depending on the type of relief they sought to save their homes. In addition, we take advantage of a large, national-scale dataset on loan performance to examine state variations in loan outcomes.
II. DATA AND DESCRIPTIVE STATISTICS
Our study uses a large dataset of subprime and Alt-A privately securitized home mortgages that are managed by Corporate Trust Services (CTS) of Wells Fargo Bank, N.A., also known as the Columbia Collateral File. CTS is a service of Wells Fargo Bank, N.A. that provides information on a variety of investment vehicles administered by the bank. The CTS data covers securitized mortgages for which Wells Fargo serves as trustee and includes mortgages with different interest rate structures, purposes, property types, and lien statuses. The database includes over four million loans originated as early as the 1980s and tracks performance monthly until the loan is paid off or foreclosed upon. The database contains a large number of both static and time-varying variables related to each loan, including the borrower’s FICO credit score, LTV ratio, loan purpose (e.g., purchase versus refinance), loan type and terms (e.g., fixed versus adjustable, balloon payment, or repayment schedule), the original and current loan balance, and the property zip code.66
To construct the dataset used in this analysis, we limit our sample to first-lien, single-family, owner-occupied loans originated between 2001 and 2006 that were still active as of December 2006. We also limit the
sample to loans originated within metropolitan statistical areas (MSAs). We then track the performance of these loans through June 2011, distinguishing between loans that are “current,” “active delinquent,” “foreclosed upon,” and “prepaid.” Unfortunately, the data do not distinguish between voluntary prepayments and those resulting from
borrower distress (e.g., short sales).67 We treat prepayments with a
reported loss as foreclosure liquidations, while prepayments with no
reported loss are treated as voluntary prepayments.68 A substantial
number of cases (about 14.8% of the sample) are missing data on the final outcome of the loan, meaning that they were no longer active in the final month but were not recorded as having transitioned to prepayment, foreclosure, or real-estate owned (REO). As discussed in more detail below, we treat these observations as right-censored in the models. However, we also conducted robustness checks using imputed variable values and found that the missing loan observations did not substantially change the model results.
The loan-level data also include information about whether the borrower filed bankruptcy or received a loan modification, but the bankruptcy status variable does not distinguish between Chapter 7 and Chapter 13 bankruptcy filings. In addition, because mortgage servicers report the bankruptcy variable as a loan status, it likely does not coincide exactly with the filing and termination of the bankruptcy court case, but rather reflects the duration of the automatic stay, with some possible time lag. Nevertheless, the bankruptcy variable permits fine-grained analysis of the effect of bankruptcy filings on mortgage performance.
To control for borrower and loan characteristics that may influence loan outcomes, the following variables were included in the models: borrower FICO scores at origination, the loan-to-value at origination, loan purpose, loan interest type (adjustable or fixed interest rate), whether underwriting entailed full documentation, loan size (distinguishing between loans under $75,000 and those over
$729,000),69 and whether the loan included a prepayment penalty or a
balloon payment. We also include a separate variable that accounts for whether the loan was structured with an initial teaser interest rate. Because of the large number of potential interest rate structures, this variable is limited to the following interest types for adjustable-rate
67. See infra Tables 1–3.
68. As a result, deeds-in-lieu may be reported as voluntary prepayments, and voluntary short sales are assimilated with foreclosure liquidations.
mortgages (ARMs): 2/28 ARM, 3/27 ARM, 5/25 ARM, 3-Year ARM, 5-Year ARM, 2/6 Month ARM, and 3/6 Month ARM. As a proxy to indicate the presence of a second lien, we include a dummy variable for whether the initial LTV was exactly 80%. Loans with 80% LTV may actually understate borrower leverage due to the prevalence of borrowers taking out a “piggyback” 20% loan.
In addition to the variables contained within the CTS database, we append additional information to each loan record to capture relevant housing and economic market characteristics. To account for the relationship between house price changes and loan performance outcomes, we construct two variables using the nonseasonally adjusted, quarterly Federal Housing Finance Agency house price index at the MSA level. The first is the MSA house price change between the first quarter of 2000 and the quarter of origination; the second is the MSA house price change between the quarter of origination and the first
quarter of 2011.70 This allows us to capture the extent to which
borrowers were caught up in the “boom and bust” cycle of the recent subprime crisis. In addition, we append data on the county unemployment rate from the Bureau of Labor Statistics, including the unemployment rate at origination and in December 2009. To account for neighborhood-level factors, we include data at the census tract level from the 2005–2009 American Community Survey on the percentage of minority residents, the percentage of residents over the age of twenty-five who completed college, and the median house values. Previous studies found neighborhood-level variations in the incidence of
bankruptcy filings and loan modifications.71 In addition, absent
information on borrower socioeconomic and demographic characteristics, these variables may serve as a proxy for individual characteristics.
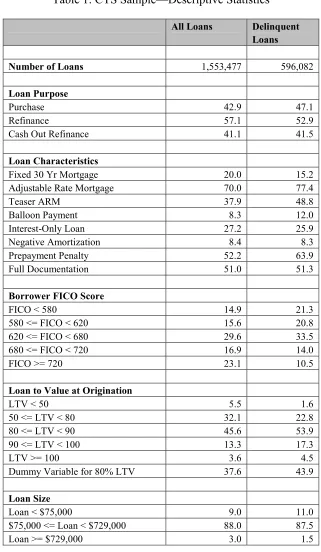
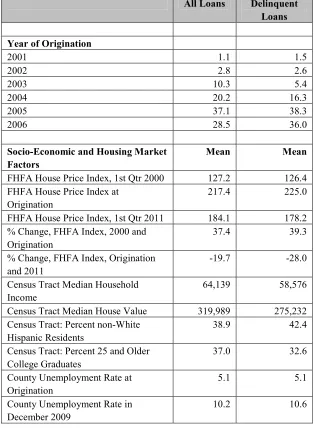
Table 1 presents the basic descriptive statistics for the entire sample as well as for the loans that went sixty or more days delinquent at any time between December 2006 and July 2011. The sample includes approximately 1.5 million loans, 38.4% of which entered delinquency, reflecting the overall poor performance of privately securitized subprime and Alt-A loans over this time period. Although we include earlier origination years, the majority of loans (65.6%) in the sample were originated in 2005 and 2006. The sample is heavily skewed
70. News Release, Federal Housing Finance Agency, Housing Price Index Falls 2.5 Percent in First Quarter 2011 (May 25, 2011), available at
towards ARMs (nearly 70%), and 37.9% of all loans were teaser ARMs, meaning that the loan originated at a low interest rate with low monthly payments but reset after a specified time period to a higher rate and payment. Compared to the full sample, delinquent loans are more likely to be those with adjustable interest rates, teaser ARMS, prepayment penalties, lower FICO scores, and higher LTVs. In addition, delinquent loans were more common in MSAs where house prices dropped significantly after origination (a decline of 28.0%, compared to 19.7% for the full sample).
Importantly, as shown in Table 2, a significant percentage of loans in the sample either filed bankruptcy or received a loan modification. For the full sample, 7.7% of borrowers filed bankruptcy and 8.4% received a loan modification. Another 1.3% both filed bankruptcy and received a loan modification. The percentages are higher for delinquent borrowers, with 17.9% filing bankruptcy, 19.9% receiving a loan modification, and 3.3% registering both.
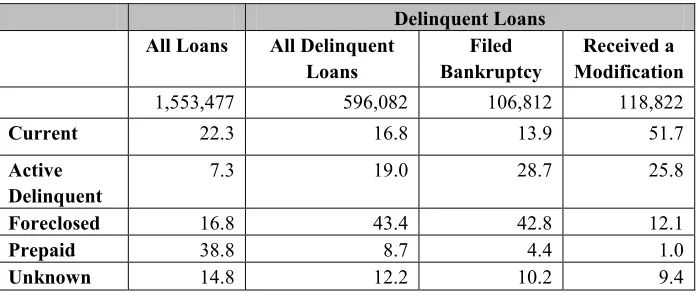
Table 3 presents the final outcome of the loans in the sample as of June 2011. Reflecting the poor performance of privately securitized subprime and Alt-A loans, the delinquency rates of the sample are extremely high. Of all the loans in the sample, only 22.3% were current, 16.8% had gone through the foreclosure process and were either REO or sold at auction, 38.8% were prepaid, and 7.3% were active and delinquent. Among delinquent loans, 43.4% were foreclosed upon, 19% were still active and delinquent, and only 16.8% had reverted back to current status. Interestingly, among delinquent loans that were in bankruptcy, a similar percentage nevertheless ended in foreclosure (42.8%), but a much larger share remained active and delinquent: 28.7% compared to 19.0% for all delinquent loans. In contrast, among delinquent loans that received a modification, far fewer ended in foreclosure, and a much greater share (51.7%) were current at the end of the observation period.
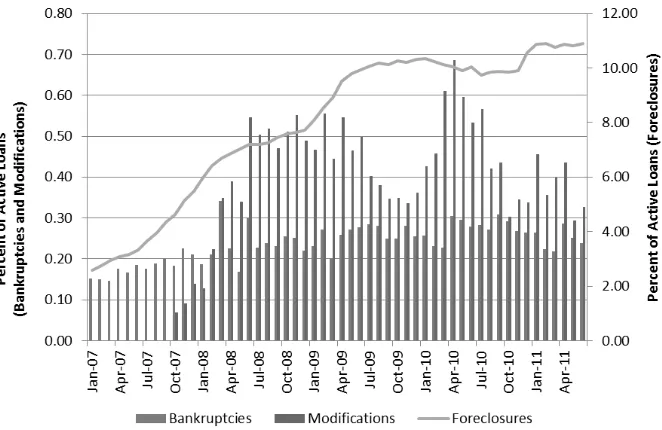
Figure 1 shows the monthly distribution of the percentage of loans in the sample that went into foreclosure, bankruptcy, or received a modification. The line graph shows the increase in foreclosures, which increased dramatically from 2007 through 2008 and remained at elevated levels over the entire study period (linked to the right axis). Interestingly, the incidence of modifications shows the greatest volatility over time, largely due to changes in the policy environment. Starting in mid-2007, the percentage of modifications slowly increased
as servicers instituted voluntary mortgage modification programs.72 In
March 2009, the Obama Administration announced the HAMP program; implementation was slow, and it took approximately a year
before the HAMP program caused a second spike in permanent
modifications.73 In contrast, the percentage of new monthly bankruptcy
filings remained relatively constant from January 2007 through June
2011.74 These data suggest that bankruptcy starts were not necessarily
driven by the rise in foreclosures over the same time period. Despite the fact that the world of mortgage defaults, prepayments, and modifications was vastly different in June 2011 than it had been in January 2007, new bankruptcy filings reveal a remarkably consistent pattern over time.
Consistent with other studies, this study finds that most bankruptcies terminate well before the three to five years required to complete a Chapter 13 plan. Although the CTS data do not distinguish between Chapter 7 and Chapter 13, most of the bankruptcies are likely Chapter
13 filings.75 Figure 2 shows the cumulative bankruptcy duration in
months for cases filed in 2007, 2008, 2009, and 2010. Bankruptcies reached a 50% cumulative termination rate after just four to five months, and 70% cumulative termination after five to twelve months. Consistent with Guo, this study finds that the duration of bankruptcies
(or bankruptcy stays) trended down over time,76 except for 2010 filings.
Thus, the likelihood of success, as measured by remaining in bankruptcy for more than a few months to implement a plan or to obtain a discharge, declined from 2007 to 2009.
In order to better understand the role that the U.S. bankruptcy system has played in the subprime crisis, our study examines the extent to which filing bankruptcy influences mortgage loan outcomes. The study seeks to address three key questions. First, we establish a context by exploring which factors influence the likelihood that a loan in the sample ever becomes sixty-days delinquent. Second, we assess the factors that influence the likelihood that a borrower will either file
bankruptcy or receive a loan modification,77 conditional on being at
least sixty-days delinquent. Third, we model the effect of bankruptcy filing on subsequent loan performance. How do distressed homeowners who filed bankruptcy fare compared to those who did not file for relief or to those who instead pursued a loan modification?
III. ANALYTICAL APPROACH AND FINDINGS
To answer these questions, we follow a rich literature on mortgage terminations and estimate a proportional hazards model using a
73. Id. at 730–32. 74. See infra Figure 1.
75. See CTS Data, supra note 66. 76. Guo, supra note 47, at 36 & exhibit 5.
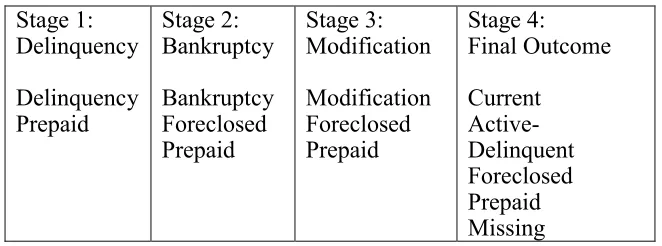
competing risks framework.78 Although this study is not focused specifically on identifying the factors that lead a borrower to choose the put or call option, the competing risks framework remains important due to its ability to account for “terminal” events that remove the loan from the risk of experiencing a separate event. For example, we cannot observe a modification or bankruptcy filing if the loan has already been prepaid or foreclosed upon. Figure 3 below provides the competing events that we assess for each model stage.
Figure 3: Competing Risks for Models
Stage 1: Delinquency
Delinquency Prepaid
Stage 2: Bankruptcy
Bankruptcy Foreclosed Prepaid
Stage 3: Modification
Modification Foreclosed Prepaid
Stage 4: Final Outcome
Current Active- Delinquent Foreclosed Prepaid Missing
78. See, e.g., Brent W. Ambrose & Michael LaCour-Little, Prepayment Risk in Adjustable Rate Mortgages Subject to Initial Year Discounts: Some New Evidence, 29 REAL EST. ECON. 305, 315 (2001); Brian A. Ciochetti et al., The Termination of Commercial Mortgage Contracts Through Prepayment and Default: A Proportional Hazard Approach with Competing Risks, 30 REAL EST. ECON. 595, 595–99 (2002); Yongheng Deng et al., Mortgage Terminations, Heterogeneity and the Exercise of Mortgage Options,68 ECONOMETRICA 275, 276–77 (2000); Anthony Pennington-Cross & Giamg Ho, The Termination of Subprime Hybrid and Fixed-Rate Mortgages, 38 REAL EST. ECON. 399, 400 (2010). There is also a rich discussion in the mortgage literature about the advantages and disadvantages of using a multinomial logit versus a proportional hazards approach to modeling competing risks. See Mark Y. An & Zhikun Qi,
For each model, the hazard for outcome j, hj(t) is the probability that
the loan experiences event type j at time T, conditional on surviving to time t,
The conditional hazard function is factored into a “baseline” hazard
b j
h that is a function of t alone, and a functionφ(x,βj)that incorporates the explanatory variables related to the hazard of interest; covariates are
allowed to impact the competing event hazards in different ways.79 This
specification lends itself to a straightforward interpretation of the effects of the covariates on the hazard rate for each event. A hazard ratio greater than one indicates the estimated increase in the event probability associated with that particular covariate, whereas a hazard ratio less than one indicates the estimated decrease in event probability.
For all the models, we cluster the standard errors by zip code. We also include time (year of origination) and state fixed effects for each specification.80
A. Loan Delinquencies, Bankruptcies, Modifications, and Loan Outcomes
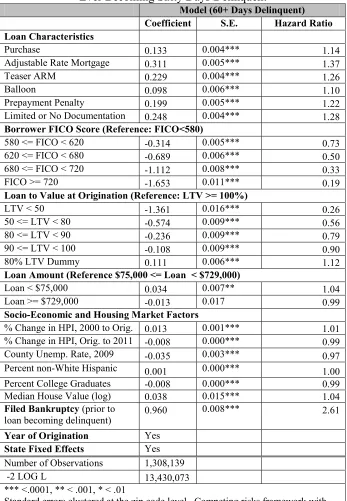
Table 4 presents the results from the first model, predicting the likelihood of a loan ever going sixty-days delinquent. Overall, the model is consistent with expectations and previous research modeling the determinants of delinquencies. Loans with riskier product features— such as teaser rates, balloon payments, and prepayment penalties, and limited or no documentation—all increase the likelihood of
delinquency.81 Borrowers with higher FICO scores and lower LTVs are
79. This study assumes that the functionφtakes an exponential form so that the hazard is given by hj(t|x)=hbj(t)exp(xβj).
80. We also tested the efficacy of using year and quarter fixed effects and MSA fixed effects, as well as their interaction, in the models. However, the goodness-of-fit tests showed that these models were less efficient than just including cohort and state fixed effects, and greatly increased processing time. The proportional hazards framework allows the research to set up the data in either a stacked panel format (with one observation for every loan for every month in the data) or as one observation per loan. PAUL D. ALLISON, SURVIVAL ANALYSIS USING SAS: A PRACTICAL GUIDE (2010). This study chooses the latter to be able to use the larger sample, and because this study does not have a large number of time-varying variables in the model.
81. Brent W. Ambrose et al., A Note on Hybrid Mortgages, 33 REAL EST. ECON. 765, 780 (2005); Lei Ding et al., Risky Borrowers or Risky Mortgages: Disaggregating Effects Using Propensity Score Models, 33 J. REAL EST. RES. 245, 248 (2011); Pennington-Cross & Ho, supra
note 78, at 402, 423; Roberto G. Quercia et al., The Impact of Predatory Loan Terms on Subprime Foreclosures: The Special Case of Prepayment Penalties and Balloon Payments 7–8, 11 (Jan. 25, 2005) (unpublished manuscript) (on file with Center for Community Capitalism,
δ δ δ ) | , Pr( lim ) ( 0 t T j T T t t
hj = < ≤ + ≥
less likely to experience delinquency. The value of the 80% LTV dummy is positive and significant, suggesting that the dummy is successfully picking up borrowers who financed their homes with both a first and second lien. Loans under $75,000 are more likely to be delinquent than loans above $75,000; however, we do not find an effect for loans over $729,000, which may be due to the small percentage of jumbo loans in the sample.
The effects of socioeconomic and housing market factors are also mostly significant, though the effects are modest for neighborhood-level factors. As expected, areas that saw large house price depreciation increased the likelihood of delinquency, while areas that did not decline as far reduced the likelihood of delinquency. The interpretation of the unemployment control is less clear. While the county unemployment rate is positively correlated with the incidence of delinquency on its own, in the full model, it flips sign and shows that the delinquency hazard decreases with higher unemployment. This likely reflects the interaction between local unemployment conditions and other variables in the model—including the origination cohort and state controls—that should be capturing changes in the strength of the local economy over the period.
Although the magnitudes of the hazards are quite small, loans in neighborhoods with a greater concentration of minority residents are more likely to become delinquent, whereas the opposite effect is found in neighborhoods with a large share of college graduates. Finally, the model also shows that there is a strong correlation between borrower financial distress, bankruptcy filing, and mortgage delinquency. Borrowers who filed bankruptcy were 2.6 times more likely to subsequently become delinquent than were borrowers who did not file bankruptcy. State fixed effects have little impact on the overall model; the largest shift is reducing the relative impact of various LTV buckets on the likelihood of delinquency.
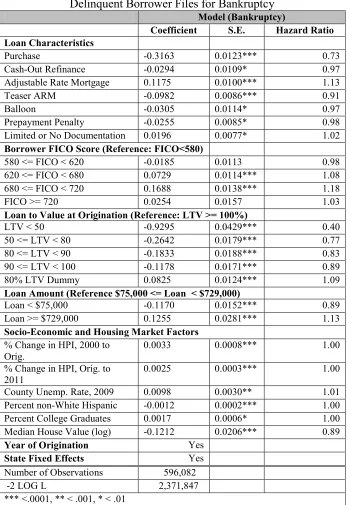
In the second model presented in Table 5, we explore the factors that lead borrowers who are at least sixty-days delinquent on their mortgage to file for bankruptcy. We find that borrowers with refinance loans with ARMs were more likely to file bankruptcy compared to purchase loans and those with fixed interest rates. Borrowers whose loans have prepayment penalties are slightly less likely to file for bankruptcy. Borrowers who only provided limited or no documentation are slightly more likely to file for bankruptcy, but the effect is small. Loans with “affordability” features, such as teaser ARMs or balloon payments seem to reduce the likelihood of bankruptcy filing, as do cash-out refinance
loans.
There is a strong relationship between home values and bankruptcy filings. Not surprisingly, borrowers with high LTVs were significantly more likely to file bankruptcy. For borrowers who enter financial distress, the lack of home equity to cover other debts and expenses appears to have driven bankruptcy filings over this time period. The 80% LTV dummy variable (suggesting the potential for a second lien) is also significantly and positively associated with bankruptcy filing. This supports the hypothesis that some borrowers may be choosing Chapter
13 to extinguish their second mortgage.82 We find strong cohort
effects—borrowers with loans originated between 2002 and 2004 are significantly less likely to file bankruptcy than those with loans originated in 2006, probably influenced in part by the ability to tap into home equity over this time period due to rising home values.
Interestingly, borrowers with the lowest and highest FICO scores are the least likely to file for bankruptcy. The main effect is evident among borrowers with FICO scores between 620 and 720, who are more likely to file for bankruptcy than borrowers with FICO scores below 580. In addition, borrowers with jumbo loans—those over $729,000—are 13% more likely to file for bankruptcy, and borrowers with small loan sizes are less likely to file. We also find that census tracts with a greater share of minority residents decrease the likelihood of bankruptcy.
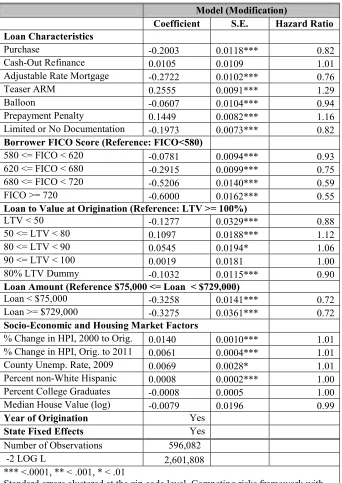
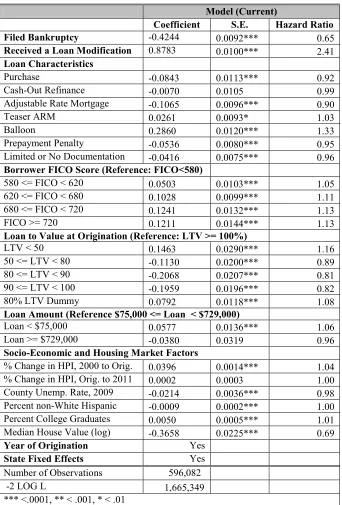
Table 6 presents a similar model, but this time we assess the factors that influence the likelihood that a borrower receives a loan modification. There are some interesting and significant differences in the effects of the covariates related to filing bankruptcy versus receiving a modification. First, while borrowers with an ARM are generally more likely to file for bankruptcy, they are less likely to receive a loan modification. Borrowers who received an ARM with a teaser interest rate or a prepayment penalty, however, are more likely to receive a loan modification—the opposite of what the bankruptcy models show. In addition, borrowers who provided limited or no documentation at origination are significantly less likely to receive a modification. This is not surprising, given that income verification is a condition for receiving a HAMP modification. Although not directly analogous to the loan origination process, it is likely that borrowers who obtained a no-documentation loan would face more challenges documenting their income during the modification process.83
Second, borrowers with the lowest FICO scores are the most likely
82. See supra notes 25–27 and accompanying text.
to receive a modification, perhaps indicating that servicers are reluctant to modify loans of borrowers who may have historically shown capacity to repay and may be strategically defaulting or can cure the default without a modification. Similarly, the fact that loans in neighborhoods with higher educational attainment are slightly less likely to be modified may suggest that servicers are considering the likelihood of strategic default to determine whether to grant a modification,84 although again it is worth pointing out that the effects of the neighborhood characteristic variables are small.
Third, while higher LTVs are associated with a slight increase in the incidence of loan modifications, borrowers with LTVs between 50% and 90% are more likely to receive a loan modification than those with an LTV above 100%. However, consistent with the argument that the presence of a second lien makes a modification more difficult to secure, this study finds that the 80% LTV dummy significantly reduces the likelihood of receiving a modification. Borrowers located in MSAs that experienced significant house price appreciation are more likely to be modified, as are borrowers located in areas that have held their value since origination. Very small and jumbo loans are both less likely to be modified than loans underwritten for more conventional amounts.
Given these differences, how do bankruptcies and modifications affect the ability of a borrower to cure their delinquency and avoid foreclosure? Table 7 presents the results of this analysis, examining the role of bankruptcy and modification on the hazard of curing the loan (returning to “current” status), remaining active but delinquent, or ending in foreclosure. Each of the models includes both year of origination dummies and state fixed effects.85
Both bankruptcy and loan modification significantly reduce the risk of ending up in foreclosure. However, the reason differs across the two forms of relief. While filing bankruptcy reduces the risk of foreclosure, it increases the likelihood that a borrower will remain active but delinquent. In contrast, borrowers who receive a loan modification are significantly more likely to cure. Delinquent borrowers who receive a modification are 2.4 times more likely to cure than similarly situated borrowers who do not receive a modification. The other control variables in the model perform as expected. Borrowers with lower FICO scores, higher LTVs, limited or no documentation, and loans with riskier product features are all more likely to end in foreclosure, even
84. Been et al., supra note 52, at 24.
after controlling for bankruptcy filing or loan modification.
Do the effects of bankruptcy or loan modification differ depending on the loan product and purpose? To assess this, we stratified the data into four different samples: purchase loans with fixed interest rates, purchased loans with adjustable interest rates, refinance loans with fixed interest rates, and refinance loans with adjustable interest rates. The results of these models are presented in Table 8. While the story is quite consistent across product and purpose types, it is interesting that bankruptcy has a greater effect on reducing the likelihood of foreclosure for ARMs. In addition, modifications for purchase ARMs are very effective at shifting borrowers into current status; delinquent borrowers who had a purchase ARM and who received a modification are nearly 2.8 times more likely to be current than similar borrowers who did not receive a modification.
Because loan seasoning can significantly influence mortgage outcomes, we ran the same models on the subset of delinquent
mortgages originated in 2006.86 We also ran the models using a multiple
imputation (MI) approach to account for the 12% of delinquent loans
missing data for the loan performance outcome variable.87 The results of
both of these robustness checks are presented in Table 9. Neither of these robustness checks change the findings significantly. The largest difference is the effect of loan modifications on whether a loan becomes current. Focusing only on 2006 originations increases the effectiveness of loan modifications compared to the model for all origination years.
This is supported by other studies that have looked at modifications.88
In contrast, imputing missing variables reduces the effectiveness of the
86. By definition, the proportional hazards framework incorporates time as a key element of the model, measured as the duration between origination and event. In addition, the models include a control for year of loan origination. However, it is possible that there are other elements of loan seasoning that are important in determining loan performance, above and beyond the duration measure.
87. While researchers are often reluctant to impute values on the dependent variable and either treat missing variables as right censored or use complete case analyses, there is an increased interest in using MI strategies to account for missing data. Rebekah Young & David R. Johnson, Imputing the Missing Y’s: Implications for Survey Producers and Survey Users 6242, 6242–43 (May 2010) (unpublished manuscript) (presented at 64th Annual Conference of the American Association for Public Opinion Research), available at http://www.amstat.org/sections/srms/proceedings/y2010/Files/400142.pdf. To impute the missing values, five replicate datasets were created, with the missing values separately filled in with plausible random values drawn from the conditional distribution given the observed data. Each model was then estimated separately for all five datasets, and then estimates were pooled to yield coefficients and standard errors that reflect the uncertainty about the missing values. The dependent variables were included in the imputation and model and the imputed values were retained in the subsequent analysis.
modifications, although they are still associated with reduced foreclosures and delinquencies and an increase in loans that are current.
Overall, we find that bankruptcy filings, holding borrower and loan variables constant, decrease the risk of completed foreclosures by delay, not by completed cures or prepayments. Borrowers who filed bankruptcy were more likely to end the study period still in their homes, but still behind in payments. In contrast, borrowers who received a loan modification were significantly more likely to avoid foreclosure and minimize the risk of redefault.
B. State-Level Variations in Bankruptcies and Loan Performance Outcomes
One question is whether the subprime crisis, and the rapid rise and fall of mortgage debt, has led more consumers to file for bankruptcy. Overall, bankruptcy rates are up, and there has been a significant rise in bankruptcies in states that were hit hard by subprime lending and resulting foreclosures, such as Arizona, California, Florida, and
Nevada.89 Yet there are also states, such as Tennessee, that have long
had high rates of bankruptcy, often attributed to a local culture that
promotes bankruptcy through administrative practices and norms.90 This
section uses the CTS data to further explore state-level variations in bankruptcy filings during the subprime crisis.
Interestingly, we find that historical state variations in bankruptcy filings persist, despite differences in delinquency rates across states. In December 2006, prior to the onset of the crisis, the states with the highest percentage of mortgages in bankruptcy were Tennessee, Alabama, Arkansas, Mississippi, and Ohio. As of June 2011, this ranking remained nearly the same, with Louisiana replacing Ohio for the fifth spot. In contrast, the state rankings for foreclosure rates changed dramatically over the same period. In the CTS data, the top five foreclosure rates in December 2006 were for Michigan, Ohio, Indiana, Mississippi, and Kentucky—primarily Rust Belt states and Gulf states affected by Hurricane Katrina. However, the foreclosure landscape looked quite different in June 2011, with Florida, New Jersey, Nevada, New York, and Illinois ranking as the five states with the highest foreclosure rates—reflecting the boom and bust nature of the subprime crisis.91
Indeed, historical variations among the states in bankruptcy filings eclipse any variations that may be attributed to a rise or fall in home
89. See Matthews, supra note 12.
mortgage debt or any other trend resulting from the foreclosure crisis. Figure 4 shows the cumulative percentage of borrowers ever sixty-days delinquent, as well as the percentage of borrowers who filed bankruptcy, organized by state. There is very little correlation between states that have high rates of borrower delinquency and those states that have a large share of bankruptcy filings.
Might bankruptcy influence loan outcomes differently depending on the local bankruptcy culture or variations in state foreclosure laws? Anecdotally, housing counselors and attorneys report that they are more likely to recommend that clients consider bankruptcy in nonjudicial foreclosure states due to the difficulty of defending or delaying foreclosures in those states. Table 10 presents the results for the loan
sample stratified by judicial and nonjudicial states.92 We find that
bankruptcy filing has a stronger foreclosure prevention effect in nonjudicial states.
We also find interesting differences in the effects of bankruptcy filing on foreclosure by state. For example, in California, filing bankruptcy has a relatively strong effect on delaying foreclosure, whereas in Florida the effect is small, and in New York it appears that those who file bankruptcy are more likely to lose their homes to foreclosures. These findings suggest that a homeowner’s likelihood of filing bankruptcy and its effect on preventing delinquency, other things equal, will be affected by their state and local bankruptcy culture— including the extent of lawyer advertising, how easy it is to fund
bankruptcy lawyer fees through the plan,93 state exemptions, and other
variables that are difficult to measure but that collectively influence bankruptcy outcomes. For example, New York had a relatively strong antipredatory lending law in place during the subprime boom, and is a judicial foreclosure state with a strong mediation statute and state funding for housing counselors and lawyers. In contrast, California is a nonjudicial foreclosure state with a weaker antipredatory lending law
92. We code the following states as nonjudicial states: Alabama, Alaska, Arkansas, Arizona, California, Colorado, District of Columbia, Georgia, Hawaii, Idaho, Maryland, Massachusetts, Michigan, Minnesota, Mississippi, Missouri, Montana, Nebraska, Nevada, New Hampshire, New Mexico, North Carolina, North Dakota, Oklahoma, Oregon, Rhode Island, South Dakota, Tennessee, Texas, Utah, Virginia, Washington, and Wyoming. Frank S. Alexander et al., Legislative Responses to the Foreclosure Crisis in Nonjudicial States, 31 REV. BANKING & FIN. L. 341, 350 n.25 (2011); see also JOHN RAO & GEOFF WALSH, NAT’L CONSUMER LAW CTR., INC., FORECLOSING A DREAM: STATE LAWS DEPRIVE HOMEOWNERS OF BASIC PROTECTIONS 12 (2009).
and that, until 2012, had a weak mediation statute.94 Because New York offers many other tools to delay foreclosures, bankruptcy filers in New York have likely been filtered for the better prospects for cure or modification (i.e., adverse selection). Bankruptcies in California, on the other hand, may be used to delay foreclosure and allow time for a cure or modification. These variations are interesting, and suggest the need for future research on how variations in state law, legal practice, and culture may shape consumer mortgage outcomes.
CONCLUSION
Bankruptcy filings have helped to prevent foreclosures in the narrow sense of delaying the ultimate forced sales of homes, but not in the broader sense of curing defaults. Homeowners filing bankruptcy during the crisis had a reduced likelihood of remaining in bankruptcy long enough to confirm a Chapter 13 plan or get a discharge. The existing bankruptcy system does not appear to be a good fit for the foreclosure debt crisis of 2007. Mortgage defaults resulted first from a structural affordability crisis brought on by homeowner leverage and loans with escalating payments, and second from recession and unemployment. Permanent modifications of mortgage loans negotiated outside of bankruptcy appear to have been much more effective in curing defaults and preventing foreclosure sales than filing bankruptcy and invoking the workout tools of Chapter 13. On the other hand, bankruptcy filings have provided some aid to delinquent borrowers, perhaps in combination with other strategies. Nevertheless, the results of this study suggest that incorporating mortgage modification tools into the Bankruptcy Code could greatly enhance its effectiveness as a tool for successful reorganization of homeowner debtors.
94. Alan White et al., The Impact of State Anti-predatory Lending Laws on the Foreclosure Crisis, 21 CORNELL J.L. & PUB. POL’Y 247, 287 tbl.11 (2011) (noting that California’s predatory lending law was rated lower on various scales than New York’s); see also
Table 1: CTS Sample—Descriptive Statistics
All Loans Delinquent Loans
Number of Loans 1,553,477 596,082
Loan Purpose
Purchase 42.9 47.1
Refinance 57.1 52.9
Cash Out Refinance 41.1 41.5
Loan Characteristics
Fixed 30 Yr Mortgage 20.0 15.2
Adjustable Rate Mortgage 70.0 77.4
Teaser ARM 37.9 48.8
Balloon Payment 8.3 12.0
Interest-Only Loan 27.2 25.9
Negative Amortization 8.4 8.3
Prepayment Penalty 52.2 63.9
Full Documentation 51.0 51.3
Borrower FICO Score
FICO < 580 14.9 21.3
580 <= FICO < 620 15.6 20.8
620 <= FICO < 680 29.6 33.5
680 <= FICO < 720 16.9 14.0
FICO >= 720 23.1 10.5
Loan to Value at Origination
LTV < 50 5.5 1.6
50 <= LTV < 80 32.1 22.8
80 <= LTV < 90 45.6 53.9
90 <= LTV < 100 13.3 17.3
LTV >= 100 3.6 4.5
Dummy Variable for 80% LTV 37.6 43.9
Loan Size
Loan < $75,000 9.0 11.0
$75,000 <= Loan < $729,000 88.0 87.5
Table 1 (cont.): CTS Sample: Descriptive Statistics
All Loans Delinquent Loans
Year of Origination
2001 1.1 1.5
2002 2.8 2.6
2003 10.3 5.4
2004 20.2 16.3
2005 37.1 38.3
2006 28.5 36.0
Socio-Economic and Housing Market Factors
Mean Mean
FHFA House Price Index, 1st Qtr 2000 127.2 126.4 FHFA House Price Index at
Origination
217.4 225.0
FHFA House Price Index, 1st Qtr 2011 184.1 178.2 % Change, FHFA Index, 2000 and
Origination
37.4 39.3
% Change, FHFA Index, Origination and 2011
-19.7 -28.0
Census Tract Median Household Income
64,139 58,576
Census Tract Median House Value 319,989 275,232 Census Tract: Percent non-White
Hispanic Residents
38.9 42.4
Census Tract: Percent 25 and Older College Graduates
37.0 32.6
County Unemployment Rate at Origination
5.1 5.1
County Unemployment Rate in December 2009
Table 2: Bankruptcies and Loan Modifications in the CTS Sample
All Loans Delinquent Loans
1,553,477 596,082
Filed Bankruptcy 7.7 17.9
Received a Loan Modification
8.4 19.9
Bankruptcy and Loan Modification
1.3 3.3
Table 3: Final Loan Status for CTS Loans, by Relief Sought
Delinquent Loans
All Loans All Delinquent Loans
Filed Bankruptcy
Received a Modification
1,553,477 596,082 106,812 118,822
Current 22.3 16.8 13.9 51.7
Active Delinquent
7.3 19.0 28.7 25.8
Foreclosed 16.8 43.4 42.8 12.1
Prepaid 38.8 8.7 4.4 1.0
Table 4: Competing Risks Model Estimating the Likelihood of a Loan Ever Becoming Sixty Days Delinquent
Model (60+ Days Delinquent) Coefficient S.E. Hazard Ratio Loan Characteristics
Purchase 0.133 0.004*** 1.14
Adjustable Rate Mortgage 0.311 0.005*** 1.37
Teaser ARM 0.229 0.004*** 1.26
Balloon 0.098 0.006*** 1.10
Prepayment Penalty 0.199 0.005*** 1.22
Limited or No Documentation 0.248 0.004*** 1.28
Borrower FICO Score (Reference: FICO<580)
580 <= FICO < 620 -0.314 0.005*** 0.73 620 <= FICO < 680 -0.689 0.006*** 0.50 680 <= FICO < 720 -1.112 0.008*** 0.33
FICO >= 720 -1.653 0.011*** 0.19
Loan to Value at Origination (Reference: LTV >= 100%)
LTV < 50 -1.361 0.016*** 0.26
50 <= LTV < 80 -0.574 0.009*** 0.56 80 <= LTV < 90 -0.236 0.009*** 0.79 90 <= LTV < 100 -0.108 0.009*** 0.90
80% LTV Dummy 0.111 0.006*** 1.12
Loan Amount (Reference $75,000 <= Loan < $729,000)
Loan < $75,000 0.034 0.007** 1.04
Loan >= $729,000 -0.013 0.017 0.99
Socio-Economic and Housing Market Factors
% Change in HPI, 2000 to Orig. 0.013 0.001*** 1.01 % Change in HPI, Orig. to 2011 -0.008 0.000*** 0.99 County Unemp. Rate, 2009 -0.035 0.003*** 0.97 Percent non-White Hispanic 0.001 0.000*** 1.00 Percent College Graduates -0.008 0.000*** 0.99 Median House Value (log) 0.038 0.015*** 1.04
Filed Bankruptcy (prior to
loan becoming delinquent) 0.960 0.008*** 2.61
Year of Origination Yes
State Fixed Effects Yes Number of Observations 1,308,139
-2 LOG L 13,430,073
*** <.0001, ** < .001, * < .01
Table 5: Competing Risks Model Estimating the Likelihood of a Delinquent Borrower Files for Bankruptcy
Model (Bankruptcy)
Coefficient S.E. Hazard Ratio Loan Characteristics
Purchase -0.3163 0.0123*** 0.73
Cash-Out Refinance -0.0294 0.0109* 0.97
Adjustable Rate Mortgage 0.1175 0.0100*** 1.13
Teaser ARM -0.0982 0.0086*** 0.91
Balloon -0.0305 0.0114* 0.97
Prepayment Penalty -0.0255 0.0085* 0.98
Limited or No Documentation 0.0196 0.0077* 1.02
Borrower FICO Score (Reference: FICO<580)
580 <= FICO < 620 -0.0185 0.0113 0.98 620 <= FICO < 680 0.0729 0.0114*** 1.08 680 <= FICO < 720 0.1688 0.0138*** 1.18
FICO >= 720 0.0254 0.0157 1.03
Loan to Value at Origination (Reference: LTV >= 100%)
LTV < 50 -0.9295 0.0429*** 0.40
50 <= LTV < 80 -0.2642 0.0179*** 0.77 80 <= LTV < 90 -0.1833 0.0188*** 0.83 90 <= LTV < 100 -0.1178 0.0171*** 0.89
80% LTV Dummy 0.0825 0.0124*** 1.09
Loan Amount (Reference $75,000 <= Loan < $729,000)
Loan < $75,000 -0.1170 0.0152*** 0.89
Loan >= $729,000 0.1255 0.0281*** 1.13
Socio-Economic and Housing Market Factors
% Change in HPI, 2000 to Orig.
0.0033 0.0008*** 1.00
% Change in HPI, Orig. to
2011 0.0025 0.0003*** 1.00
County Unemp. Rate, 2009 0.0098 0.0030** 1.01 Percent non-White Hispanic -0.0012 0.0002*** 1.00 Percent College Graduates 0.0017 0.0006* 1.00 Median House Value (log) -0.1212 0.0206*** 0.89
Year of Origination Yes
State Fixed Effects Yes Number of Observations 596,082 -2 LOG L 2,371,847 *** <.0001, ** < .001, * < .01