Singaporean Journal of Business
Economics, and Management Studies (SJBEM)
DOI: 10.12816/0044428NBL
Research Article Research Article
NLB
A Study to Align and Optimize the Internal Process of the Existing Supply
Chain Management with Reference to Ks&Dl, Bengaluru
Dr. C. G. Sumithra
Associate Professor, M.P. Birla Institute of Management, Associate Bharatiya Vidya Bhavan, Bengaluru.
Corresponding Email:[email protected], Phone- 9845342203.
Dr. Hemanth Kuma S
Associate professor, CMS Business School, Jain University, Bengaluru. Email:[email protected], Phone – 99886433248.
Ravishankar G. R.
MBA Student of M.P. Birla Institute of Management, Associate Bharatiya Vidya Bhavan, Bengaluru.
Email:[email protected], Phone – 9742937807.
Abstract
Organization supply chain management refers back to the whole delivery chain process for planning, coordination, operation, manage and optimize the diverse activities. The intention is to reach the customers at the right time with right quantity. In the case of this paper, the focus was mainly on to optimize and align the activities in the company to have more outputs. The implementation of supply chain would help in information sharing and strengthening of supply chain would help in saving cost and resolving issues. The objective of this paper mainly focuses on five main aspects on internal supply chain process. They are supply chain output, information flow, flexibility in operations, customer orientation and trading partner’s role. The findings reveal that there is information flow is slow in the department. The results depicts that the internal operational activities of supply chain found to be satisfactory at KS& DL.
Keywords: (RFID) Radio Frequency Identification, Supply Chain Output, Customer Orientation, logistics management, Procurement.
Introduction
India’s population touched a billion marks, therefore a great demand for products which are used daily like cleaning soaps, with a market penetration of almost 98 percent. The people belong to different range of earning groups from lower to super rich class of consumers who buy daily consumables like soaps and detergents which has been the second largest selling category among the product range. The rural market of our country has a huge demand for daily consumables like soaps, detergents, tooth paste, talcum powders, and shampoos and detergents with consecutively increasing rate as compared to cities, as rural population has a major ratio.
Moreover, soap is one of the commodities, which has become an essential a part of the daily living because of its non- durable nature, there is a big market place for such products. The Indian soap industry endured to flourish thoroughly till 1967-68, but began to stagnate. It started to recover in a very short duration as increase in the growth of population and increase in consumption rate and income. Hindustan Unilever is the leading soap seller in the country.
kinds of pure sandal soaps, detergent powders, sandal oil, agarbathies, talcum powders etc. This organization was brain child of the royals of Mysore kingdom. During that time the ruler was Maharaja Nalvadi Krishna Raja Wodeyar, who turned a problem in to an opportunity, by starting KSDL and by allocating the land at the out skirts of Kati area, nearby Bangalore in the year 1916.
Earlier the company was called Mysore Soap And Detergents Limited, began to manufacture soaps in bulk and selling to consumers. There are number of soap assortments which are being manufactured with more product lines with length and width available at the market place with a certain level of profitability and its own market. The present paper discusses about the study which is focuses on determining how KS&DL is able to satisfy customer requirement through the process of supply chain and what are the methods they are following to survive with the competition in the market.
Focusing on the conceptual part of the study, supply chain deals with end to end business process carried out in any enterprise. It is the integration of all operations and distribution which includes procurement of materials, processing into finished merchandise, and distribution of the goods to clients. Supply chain activity completely controls the flow of items of an organization. It incorporates the developmental activities and capacity of basic substances, work-in-system stock, and completed products from component of starting to purpose of utilization. In supply chain all the activities are inter related, connected or interlinked systems. As a total approach it connects all channels and hub organizations are included in the arrangement of items and administrations required by utilizing surrender customers in a delivery chain.
Supply chain process concerned with operations control, logistics management, procurement, and information generation, and strives for a holistic approach. These include marketing plans, sourcing, converting/manufacturing, delivering, and returning. SCM performs operations in both administration and product offerings. A normal supply chain includes many interactions among providers, manufacturers, vendors, shops, with the crucial goal of offering either a service or a product to customers. This additionally works in opposite with the client at the utmost of the process whilst returning a product. SCM is used to assimilate planning, buying, manufacturing, distribution, and advertising businesses that normally do no longer team up together to reach the common goal. Each works towards goals unique to their own in order to accomplish narrow targets. Supply chain is a method of joining these various capabilities so they work together for the benefit of entire organization. It involves planning, execution, and tracking of deliveries with the goal of increasing overall value. The basic target of supply chain is customer satisfaction and to accomplish this, all barricades are removed between final consumers and the suppliers. Research in supply chain control selections has recognized twelve distinct control regions each of which deals with issues in supply chain. The process functions at three levels which includes at the executive level decision making, secondary level and at routine operational level.
Vital supply chain contracts with future making arrangements than looking at marketplace assessment, potential problems, new merchandise, and technology changes. These plans will be addressing troubles that can be factors several years out. This planning activities are done at higher management levels. RFID capable product tags which are commonly utilized by most of the firms. These tags provide actual-time data as a way to allow manufacturers to get higher readings of clients and markets thus in addition improving deliver chains. Off late, these tags are used at stores to provide the proper products assisted with codes to mark choices at places on the proper times. However, very critical are record flows, information flows which allows the diverse supply chain partners to coordinate their time bound plans. The control of the routine flow of products and services upwards and downwards also are integrated in the concept.
Supply chain management is an attempt to deliver chain of process inside with maximum efficiency and powerful feasible method. Such techniques include product improvement, sourcing, manufacturing and logistics, each of which assists in growing high-quality merchandise and coordinating with other departments. Moreover, at the same time, as some of the delivery chains have existed for a longer tenure and the role players have effectively got benefitted unto what was going on within their "four boundaries." Few companies comprehended, a great deal considerably less difficulty. The whole chain of exercises have lasted in the kind of conveyer belt until the items reach the last buyer. Some organization’s would have not benefitted by the outcomes and sometimes may have disconnected with supply chains.
Scope of the study
The study provides the information required in order to improve the overall supply chain management process and to identify the customer requirements and role of supply chain in satisfying their demands.
Literature Review
Wai Peng Wong (2008), supply chain process refers to a holistic integration and synchronization of interrelated role players like suppliers, manufacturers, distributors and retailers who put together all efforts for delivering the products to customers. Lachlan Philip (2014) streamlining the customer’s supply chain will help companies build efficient, cost -competitive andcontinuous supply chains which can generate considerable long term savings for customers, usually have very tight profit margins. The supply chain category is different for each category of merchandise, but may also be targeted for the same consumers. There are certain basic parameters need to be considered like storage conditions, shelf life and expiry, stock keeping units, technology with RFID, retailer’s knowledge and packaging. Past researchers have developed many literature works on the integrated supply chain with mathematical modelling for better performance and crystal clear representation of the framework. An integrated supply chain for manufacturing firms needs total commitment by all partners of the linking chain. In other words the channel partners should have trust in taking up such activity. Marcus Brandenburg, et al (2011) provides empirical evaluation for the cost of goods sold (COGS), working capital within the time horizon, the study had applied benchmarking methodology and a discounted cash flow (DCF) based model and quantifies the value contributions.
Moreover, Supply chain participators should be committed for complete solution towards customer orientation for satisfying customer requirements. The authors Jung Sik Jeong and Paul Hong (2007) identify three important focal areas in their study of customer orientation in supply chains; they are closeness, flexible, and customer-accessible. In the meantime, another study by Ram Narashiman and Soo Wook Kim (2002) have suggested integrating supply chain strategy into market and product diversification strategy by comparing the interacting effects for a particular case. Felix T.S. Chan, H.J. Qi, (2003) adds a new angle to the concept by introducing a process-based systematic perspective in order to build an effective model to measure the performance of supply chains. The authors have induced a new method called “Fuzzy set theory” to address evaluation processes. Many authors like, Trevile et al., (2004); Narasimhan and Kim, (2002); Otto and Kotzab, (2003) have added a practical point of view for customer orientation in supply chains by using the concepts of informational outcomes, operational outcomes and customer outcomes with customer responsiveness. Nielson (1998) has brought out the concept of integrating supply chain with the suppliers and other participators so that issues could be resolved with shorter duration of time.
However, there is an important role played by trading partners in the supply chain process Robert B. Handfield and Christian Bechtel (2002), have presented the concept through their study and tested a model based on their study at North American Manufacturing firms. The authors have suggested buyer’s independence, supplier human asset investments and building relationships. The study reveals an important fact that the buyers do not have control over the suppliers. Lisa M. Ellram, Martha C. Cooper, (1990) have contributed on the points of view of minimizing the risk by partnering relationships with the suppliers. The authors Suzannede Treville, Roy D Shapiro and Ari-Pekka Hameri, (2004), have suggested the practice of demand chain management to adjust the production fit to customer demand. The paper recommends for a trajectory based approach for achievement of desired results. The same said study also mentions about information transfer improvement and to ignore the problem of lead-time and at the same time a framework has been proposed. David J. Closs, Cheri Speier and Nathan Meacham (2011) study the sustainability at every dimension of the value chains and illustrates with examples. There are some significant contributions on integrated SCM some popular models like SCOR(Supply Chain Operations Reference) which integrates business process reengineering, process measurement and cross functional processes (Wai Peng Wong, 2008). The focal concept of the above mentioned paper gives an insight to Customer-orientation throughout the supply chain.
programming models. The paper concludes by stating clear sparcity in addressing the supply chain coordination at operational level. Robert E. Spekman, John W. Kamauff Jr, Niklas Myhr, (1998) argues on the point of close collaborative relationship between the entire supply chains, and then only firms can achieve the desired results. There is empirical data presented to look on to SCM practices. There is an attempt being made to examine the differences between the buyers and seller along the supply chain and understand the challenges faced them. The article proposes a change in mind set for the people involved in the procurement activities and an adaptation to the requirements in order to take up competition in a smooth way. Conduit and Movado, (2001) in the similar way proposed on employee training, management support, smoothing internal communication and external communication for having an edge over the activities of supply chain.
Many studies have been contributed in the area of quality management practices in supply chain but Lean supply chain practices is given more importance to those who want to eliminate waste or non value added activities. These practices are not only for manufacturing firms but also for others who look up to streamlining the processes. Barbara B. Flynn, Roger G. Schroeder and Sadao Sakakibara (1995) in their study conduct an exploratory investigation for building relationship of specific quality management practices and performance, a framework has been proposed and constructed. The paper focuses on core quality management practices and on the supportive environment which benefits both the parties. The study also incorporates measures of quality performance and their role to gain a competitive advantage. Jones Lang LaSalle (2008) in his article “Bench marking your Lean Journey” mentions, only 14 percent of companies are “Lean Adopters” in their supply chain practices. The trend however, projected highly positive: nearly 30 percent of the organizations, a category “Lean Movers,” have started to adopt Lean supply chain principles. The study concludes by stating that Lean Adopters had lesser inventories to sales activity, and minimum number of days was required to collect returns. These had a major impact on the company’s cost incurred and had positive changes in the supply chain.
Beyond all these, Moore, Nancy Y., et al (2010), contributed about air force project particularly concentrated on “Best Practices in Developing Proactive Supply Strategies for Air Force Low-Demand Service Parts”. The project mentions about procurement procedures of the items their purchase methods and its usage. In the concluding remarks the study suggests methods to replenish low demand items, saving cost and risk management in the inventory. Supply chain risk management (SCRM) continuously seeks improvements in the methods for measuring and assessing the activities. There are few important points discussed like, resiliency index, resiliency visualization capability and integrated analytics and reporting tool. The company Cisco has developed a tool called SCRM analytics platform which automates several operations that were previously very manual and time consuming.
However, Shaw nee Vickery, Roger Calantone, Cornelia Dröge,(1999) present a study which examines dimensions of supply chain flexibility and their relationships. The findings from the study reveal certain facts that volume flexibility and launch flexibility are key criteria’s for furniture industry. Volume flexibility is also positively correlated with all measures of overall firm’s performance. It is highly related to market share and market share growth, totally, supply chain flexibility is very important at the bottom-line. The authors Mark Stevenson, Martin Spring, (2009) study about inter-firm practices which are used to achieve increased flexibility and buyer seller relationships for a wider supply chain network. The findings reveal facts about existence of flexibility and trade-off in the complex relationships with a model.
The authors Barbara B.Flynn, Baofeng Huo and Xiande Zhao (2010), examine the various dimensions of how supply chain role players collaboratively manage the different activities efficiently to deliver the performance outcomes and value to customers. In the study the authors have used Anova for examining the relationship between supply chain integration pattern and performance. The final findings reveal both internal and external customer integration is an essential link for improving performance and integration with the partners. So integration of all the process with the supply chain is an important element to achieve the desired result.
worked in depth by many authors, but despite all these, a study to align these activities internally an attempt has been made to understand and optimize the activities. These above mentioned important concepts are integrated with a purpose for a century old soap manufacturing company to empirically understand the factual results.
Objectives of the study
• To determine the relationship between supply chain output and customer orientation. • To determine the relationship between supply chain output and trading partners’ role. • To identify relationship between supply chain flexibility and supply chain output. • To determine the relationship between supply chain output and information flow.
Methodology of the study
The present study is exploratory as well as descriptive in nature. The studyis totally dependent upon the primary data. The primary data is collected through the structured questionnaire. The responses were collected from the various employees who are directly involved in the activities of supply chain inside the organization through the job roles. Data was collected by personal interview with the help of marketing department of the company.Sampling: There are three departments involved in the supply chain process for KS&DL but all of them could not be chosen for the study. The authors have chosen 80 employees on the convenience sampling basis for the study purpose. The study covers internal employees of the company only. Tools used for analysis: Correlation, Regression and Chi- square tests were used to analyze the collected responses. The data was fed into IBM SPSS software to get the results.
Limitations of the study
The study is heavily relying on the primary data. The responses given are not under the control of the authors. The data was collected from 80 employees only who are directly or indirectly involved with the supply chain activates by their job roles.
Analysis of Primary Data
I Kaiser-Meyer-Olkin Measure of Sampling
Table: 1 Source: Primary Data.
Kaiser-Meyer-Olkin Measure of Sampling Adequacy. .868
Bartlett's Test of Sphericity
Approx. Chi-Square 1664.466
Df 36
Sig. .000
From the above table it is clearly evident that the established sampling adequacy is 0.868. The chi-square variable value is 36 and the significance table value is between 0 - 1. The calculated value obtained is 0.000 therefore selected samples for the above test are highly reliable. The approximate of Chi-Square is 1664.466 with 36 degrees of freedom, which is significant at 0.05 Level. The KMO statistic of greater than 0.50.
II Reliability statistics
Table: 2 Case Processing Summary
N %
Cases
Valid 80 100.0
Excludeda 0 .0
Total 80 100.0
Source: Primary data
Table: 3 Reliability Statistics Cronbach's
Alpha N of Items
The reliability co-efficient is 0.957 the numbers are close to 1. Usually the coefficients should be above 0.7 which are considered to be having good internal consistency. In the above case (table: 3) shows 0.957 the data is highly reliable.
III Chi-Square Tests
Chi square test of independence, is known as person chi square test is used to understand the relationship between two variables.
Hypothesis 1
H0: There exists no relationship between supply chain output and flexibility in supply chain department. H1: There exists relationship between supply chain output and flexibility in supply chain department.
Table:4 Chi-Square Tests (Source : Primary Data)
Value df Asymp. Sig. (2-sided)
Pearson Chi-Square 527.474a 234 .000
Likelihood Ratio 272.661 234 .042
Linear-by-Linear Association 71.548 1 .000
N of Valid Cases 80
a. 266 cells (100.0%) have expected count less than 5. The minimum expected count is .01.
From the above table it is clearly visible that there exists relationship between supply chain output and flexibility in supply chain department. The alternate hypothesis H1is accepted. The chi square significant at 0.000. (2 sided).
Hypothesis 2
H0: There exists no relationship between supply chain output and supply chain information flow. H1: There exists relationship between supply chain output and supply chain information flow.
Table:5 Chi-Square Tests (Source : Primary Data)
Value df Asymp. Sig.
(2-sided)
Pearson Chi-Square 268.877a 162 .000
Likelihood Ratio 168.894 162 .339
Linear-by-Linear
Association 49.414 1 .000
N of Valid Cases 80
a. 190 cells (100.0%) have expected count less than 5. The minimum expected count is .03.
From the above table it is clearly visible that the calculated chi square value is less than 0.05. Hence alternate hypothesis H1 is accepted or it is significant at 0.000 p value.
Hypothesis 3
Table:6 Chi-Square Tests (Source : Primary Data)
Value df Asymp. Sig.
(2-sided)
Pearson Chi-Square 283.116a 162 .000
Likelihood Ratio 175.939 162 .215
Linear-by-Linear
Association 49.728 1 .000
N of Valid Cases 80
a. 190 cells (100.0%) have expected count less than 5. The minimum expected count is .03.
From the above table 6 it is clearly visible that the calculated chi square value is less than 0.05. Hence alternate hypothesis H1 is accepted or it is significant at 0.000 p value.
Hypothesis 4
H0: There exists no relationship between supply chain output and customer orientation. H1: There exists relationship between supply chain output and customer orientation.
Table:7 Chi-Square Tests (Source : Primary Data)
Value df Asymp. Sig.
(2-sided)
Pearson Chi-Square 337.057a 162 .000
Likelihood Ratio 208.454 162 .008
Linear-by-Linear
Association 57.474 1 .000
N of Valid Cases 80
a. 190 cells (100.0%) have expected count less than 5. The minimum expected count is .03.
From the above table 7 it is clearly visible that the calculated chi square value is less than 0.05. Hence alternate hypothesis H1 is accepted or it is significant at 0.000 p value.
IV Correlations
Table:8 (Source : Primary Data) Descriptive Statistics
Mean Std. Deviation N
Customer orientation 7.6500 2.30629 80
Trading partners role 8.0375 2.13140 80
Information flow 8.1000 2.05371 80
flexibility 11.3500 3.34172 80
Table:9 (Source : Primary Data) Correlations
CUST TRAD INFO FLEXI
Customer Orientation
Pearson Correlation 1 .958** .935** .819**
Sig. (2-tailed) .000 .000 .000
N 80 80 80 80
Trading partners role
Pearson Correlation .958** 1 .988** .777**
Sig. (2-tailed) .000 .000 .000
N 80 80 80 80
Information flow Pearson Correlation Sig. (2-tailed) .935.000 ** .988.000 ** 1 .769.000 **
N 80 80 80 80
Flexibility
Pearson Correlation .819** .777** .769** 1
Sig. (2-tailed) .000 .000 .000
N 80 80 80 80
SC output
Pearson Correlation .853** .793** .791** .952**
Sig. (2-tailed) .000 .000 .000 .000
N 80 80 80 80
Pearson’s correlation is run to determine the relationship between customer orientations, role of trading partners, information flow, flexibility and supply chain output. There exist a moderately positive correlation between these with the values r 0.819, 0.777, 0.769 and 0.952 respectively and is statistically significant at 0.01 percent level (2- tailed).
Table:10 (Source : Primary Data) Correlations
SC output
CUST
Pearson Correlation .853
Sig. (2-tailed) .000
N 80
TRAD
Pearson Correlation .793**
Sig. (2-tailed) .000
N 80
INFO
Pearson Correlation .791**
Sig. (2-tailed) .000
N 80
FLEXI
Pearson Correlation .952**
Sig. (2-tailed) .000
N 80
SC output
Pearson Correlation 1**
Sig. (2-tailed)
N 80
**. Correlation is significant at the 0.01 level (2-tailed).
V Regression
Table:11 (Source : Primary Data) Model Summary Model R R Square Adjusted R
Square
Std. Error of the Estimate
1 .965a .931 .927 1.33749
a. Predictors: (Constant), CUST, FLEXI, INFO, TRAD
Table -11 shows R and R Square values. The R value represents simple correlation with the value 0.965. The R2 value indicates the amount of variation contributed by variable satisfaction to the total variation of the dependent variable. In the above case it is 0.931 percent which is very much near to 1.
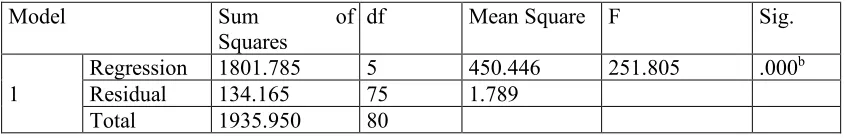
Table :12 ANOVAa
Model Sum of
Squares
df Mean Square F Sig.
1
Regression 1801.785 5 450.446 251.805 .000b Residual 134.165 75 1.789
Total 1935.950 80
a. Dependent Variable: SC Output
b. Predictors: (Constant), CUST, FLEXI, INFO, TRAD
Table-12 presents the output of ANOVA analysis the p value should be less that 0.05, therefore the above result is said to be statistically significant.
Table :13 Coefficients
Model Unstandardized Coefficients Standardized
Coefficients t Sig.
B Std. Error Beta
1
(Constant) -.074 .655 -.114 .910
FLEXI 1.103 .080 .744 13.859 .000
INFO 1.167 .501 .484 2.328 .023
TRAD -1.763 .599 -.759 -2.944 .004
CUST 1.112 .263 .518 4.224 .000
Table 13 presents necessary information to predict supply chain output from the other dependent variables (flexibility, information flow, role of trading partners and customer orientation). In fact all the variables are statistically significant at 0.000, 0.023, 0.004 and 0.000 p value respectively.
Findings
Suggestions
Karnataka soaps and detergents limited should focus on strengthening the supply chain department by making the effective utilization of plant, resources and machinery available so as to perform at optimum levels. In order to match with the other private player’s and market leaders more efforts need to stressed on with alignment of all other activities . Measures must be taken by the company to ensure that information flow between the business partners and other functional departments of the organization is happening at the timely manner to ensure that there exists no gap between the supplier offerings and company’s requirements. Some advance methods like ERP (enterprise resource planning) are used by the other role players, the company can focus on technological aspects which may better company’s prospects.
Conclusion
After carrying out in-depth investigation on the supply chain department of Karnataka soaps and detergents limited it can be concluded that, the various factors that influence the supply chain department are found to be trading partners, customer orientation, flexibility and information flow of the organization. The performance of suppliers, customer oriented production, lean and risk management are the areas needs improvisation, the information flow with other functional departments of the organization and with trading partners is happening with a bit of delay. Therefore suitable measures must be taken. Overall the supply chain department of Karnataka soaps and detergents limited is performing at satisfactory levels while there is a need to enhance on the technological aspect.
References
Árni Halldórsson, Herbert Kotzab, Tage Skjøtt-Larsen(2003) ;Supply chain management on the crossroad to sustainability: a blessing or a curse? Journal of logistics research. Volume1, Issue 2, Pages 83-94.
Barbara B.Flynn,Baofeng Huo and Xiande Zhao (2010); The impact of supply chain integration on performance: A contingency and configuration approachJournal of Operations Management
Volume 28, Issue 1, Pages 58-71.
Basnet C, Corner J, Wisner J, Tan KC (2003) Benchmarking supply chain management practice in New Zealand. Supply Chain ManagInt J 8(1):57–64.
Bhutta KS, Huq F (1999) Benchmarking–best practices: an integrated approach. Benchmark Int J 6(3):254–268.
Blanchard C, Comm CL, Mathaisel DFX (2008) Adding value to service providers: benchmarking Wal-Mart. Benchmark Int J 15(2):166–177.
Brandenburg M, Schilling S (2010) Value impacts of dynamics and uncertainties in tactical supply chain design for new product introduction. In: Proceedings of the German-Italian conference on the interdependencies between new product development and supply chain management, PP 26–38.
Camm JD, Chorman TE, Dill FA, Evans JR, Sweeney DJ, Wegryn GW (1997) Blending OR/MS, judgement, and GIS: restructuring P&G’s supply chain. Interfaces 27(1):128–142.
Conduit, J., & Mavado. T.F. (2001). How critical is internal customer orientation to market orientation?. Journal of Business Research, 51 (1), 11-24.
David J. Closs, Cheri Speier, Nathan Meacham. (2011)“Sustainability to support end to end value chains. Journal of the Academy of Marketing Science 39:1, (February), Pp. 101-116.
Douglas J.Thomas and Paul M.Griffin(1996) Coordinated supply chain management; European Journal of Operational Research ,Volume 94, Issue 1, October 1996, Pages 1-15.
Ellis, Simon, “Supply Chain Risk Management: A Best Practice Case Study of Cisco,” Manufacturing Insights, June, 2009.
Felix T.S. Chan, H.J. Qi, (2003) "An innovative performance measurement method for supply chain management", Supply Chain Management: An International Journal, Vol. 8 Issue: 3, pp.209-223.
Impacts of supply chain management on company value: benchmarking companies from the fast moving consumer goods industry, logistics research October 2011, Volume 3, Issue 4, pp 233–248.
Jung Sik Jeong, Paul Hong, (2007) "Customer orientation and performance outcomes in supply chain management", Journal of Enterprise Information Management, Vol. 20 Issue: 5, pp.578-594.
Mark Stevenson, Martin Spring, (2009) "Supply chain flexibility: an inter-firm empirical study", International Journal of Operations & Production Management, Vol. 29 Issue: 9, pp.946-971.
Narasimhan, R., & Kim, S. W. (2002). Effect of supply chain integration on the relationship between diversification and performance: Evidence from Japanese and Korean firms. Journal of Operations Management, 20(3), 303-323. RB Handfield, C Bechtel - Industrial marketing management,( 2002) “The role of trust and relationship structure in
improving supply chain responsiveness”, Industrial Marketing Management: Volume 31, Issue 4, July 2002, Pages 367-382.
Robert E. Spekman, John W. Kamauff Jr, Niklas Myhr, (1998) "An empirical investigation into supply chain management: a perspective on partnerships", Supply Chain Management: An International Journal, Vol. 3 Issue: 2, pp.53-67.
Suzannede Treville, Roy D Shapiro and Ari-Pekka Hameri, (2004) “From supply chain to demand chain: the role of lead time reduction in improving demand chain performance”, Journal of Operations Management ,Vol 21 issue:6, January 2004, Pages 613-627.
Vickery, S. n., Calantone, R. and Dröge, C. (1999), Supply Chain Flexibility: An Empirical Study. Journal of Supply Chain Management, 35: 16–24.
Wai Peng Wongn; Kuan Yew Wong. Benchmarking; Bradford 15.1 (2008): 25-51.
Customer orientation and performance outcomes in supply chain management (PDF Download Available). Available from:https://www.researchgate.net/publication/220306329_Customer_orientation_and_performance_outcomes_in
_supply_chain_management [accessed Aug 1, 2017].
http://blog.damco.com/2014/10/09/optimizing-complex-supply-chains-fast-moving-consumer-goods.
Moore, Nancy Y., Clifford A. Grammich, and Robert Bickel, Developing Tailored Supply Strategies, Santa Monica, Calif.: RAND Corporation, 2007. As of May 22,2011:http://www.rand.org/pubs/monographs/MG572.html.
A review on benchmarking of supply chain performance