Vertical Structure of Current Velocity Shears in the Main
Pycnocline of the Black Sea Based on the in situ Data in 2016
A. N. Morozov
Marine Hydrophysical Institute, Russian Academy of Sciences, Sevastopol, Russian Federation
e-mail: [email protected]
The characteristic features of the averaged vertical structure of the current velocity shears are discussed based on the analysis of the LADCP/CTD data collected in three expeditions of the R/V “Professor Vodyanitsky” in the northern Black Sea in 2016: the 87th cruise (June, 30 – July, 18);
the 89th cruise (September, 30 – October, 20) and the 91st cruise (November, 16 – December, 5). The
maximum of the shear average profile is noted in the main pycnocline layer in the vicinity of the buoyancy frequency maximum. The ratio of the shear mean square to the buoyancy frequency mean square increases almost monotonously with depth from 0.1 to 0.4 in the layer 50–350 m that can indicate (at a qualitative level) relative intensification of turbulent vertical mixing in the lower part of the main pycnocline. The mean profiles of the shear vector rotation angle relative to its direction on the horizon 15 m are given. On the average, the shear vector rotates clockwise and makes about two rotations in the main pycnocline layer. The revealed rotation of the shear vector is due to influence of the internal waves propagating downward at the close to inertial frequency. The hodographs of the current velocity shear exhibiting a well-pronounced rotation with depth are shown. Considered is the example of calculating the parameters of a near-inertial internal wave using the current velocity shear and deformation based on the data of one of the stations.
Keywords: vertical shears of current velocity, vertical turbulent mixing, main pycnocline, the Black
Sea, LADCP.
Acknowledgements: the research is carried out within the framework of the State Order on the theme
No. 0827-2018-0002 “Development of the methods of operational oceanology based on the inter-disciplinary studies of the marine environment formation and evolution processes, and mathematical modeling using the data of remote and direct measurements” at a partial support of the RFFI grant No.17-05-41102 RGS a.
For citation: Morozov, A. N., 2018. Vertical Structure of Current Velocity Shears in the Main
Pycnocline of the Black Sea Based on the in situ Data in 2016. Physical Oceanography, [e-journal] 25(6), pp. 472-478. doi:10.22449/1573-160X-2018-6-472-478
DOI: 10.22449/1573-160X-2018-6-472-478
© 2018, A. N. Morozov © 2018, Physical Oceanography
Introduction
existing parametrization for calculating the vertical turbulent diffusion coefficient for small-scale data [2, 7, 8] contain squares of vertical current velocity shears (hereinafter referred to as “shears”) averaged over the ensemble of profiles. The use of one or another parameterization requires an understanding of the nature of the phenomena that determine the values of shears in different layers of the sea.
The present research is aimed to represent and discuss characteristic features of the averaged vertical structure of the current velocity shears based on the analysis of the LADCP/CTD data collected in three expeditions of the R/V “Professor Vodyanitsky” in the northern Black Sea in 2016. The first expedition was held on June, 30 – July, 18 (the 87th cruise); the second one – on September, 30 – October, 20
(the 89th cruise) and the third – on November, 16 – December, 5(the 91st cruise).
Instruments and data
LADCP based on WHM300 (300 kHz operating frequency) manufactured by RDI was used to measure currents in the expeditions. Instrument operation parameters were as follows: LADCP option is enabled in high resolution/short distance mode, time discreetness is 1 s and depth discreetness is 4 m. The measu-rement sequence included the instrument's exposure to the sea surface for 5 min, its further immersion at a speed of 0.5 m/s to the depth of sounding, the exposure on this horizon for 5 minutes and the subsequent rise to the surface at a speed of 0.5 m/s. Data processing was carried out taking into account the specifics of the Black Sea waters in accordance with [9]. The coordinates of the vessel were determined using GPS data, CTD measurements were carried out by the SBE911 + probe.
F i g. 1. Current velocities on the 20 m horizon obtained in three expeditions (the first – a, the
second – b, the third – c)
32° 34° 36° E
30.09 - 20.10.2016
32° 34° 36° E
30.06 - 18.07.2016
43° 44° 45° N
32° 34° 36° E
16.11 - 05.12.2016
43° 44° 45° N
70 cm/s
a
b
c
Results of the current velocity measuring in three expeditions on the 20 m horizon are shown in vector form in Fig. 1. The measurement area was located in the northern part of the large-scale cyclonic circulation of the Black Sea waters, which is manifested in the dominance of the western direction of the measured current velocities. In the first and third expeditions a relative increase in the velocity of currents in the continental slope area is monitored. In the second expedition, in the western part of the polygon, there is a meander of the Black Sea Rim Current with a characteristic scale of ∼60 km. A more detailed discussion of the horizontal structure of the current velocity is beyond the scope of the article; it is partially presented in [10].
Vertical structure of shears in the main pycnocline layer
Averaging of the parameters shown in Fig. 2, was carried out on an ensemble of profiles obtained at stations at a depth of at least 1000 m in each of the three expeditions (64, 41 and 30 is the number of profiles for the first, second and third expeditions, respectively). Fig. 2, a shows the average profile of the square of the buoyancy frequency (N2 =gρ−1ρz, where g is the free fall acceleration; ρ is the
sea water density; ρz is the depth density derivative). The maximum N
( )
z2
is
marked on ∼75 m depth and corresponds to the average depth of isopycnal with a conditional density value of 15 kg/m3. The black dashed line is an exponential
approximating the profile in a layer of 200–300 m ( N2
( )
z ∝exp(−z 125)).Fig 2, b shows the mean square shear profile (Sh2 =Uz2+Vz2, where Uz,Vz –
derivatives of the eastern Uand northern Vcomponents of the current velocity). The colored dashed lines are the squares calculated from the geostrophic ratios of the shears, averaged over 10 pairs of stations of each expedition with their highest values in the vicinity of the maximum buoyancy frequency. Black dashed line is
the approximating exponent ( Sh2
( )
z ∝exp(−z 250)). Black dashed lines inFig. 2, a, b emphasize the relative increase in the mean square shear in the vicinity of the maximum buoyancy frequency. The observed increase in the mean shear value may be due to the fact that in layers with a higher buoyancy frequency the necessary condition for the linear instability of the shear flow (gradient Richardson number Ri=N2 Sh2 <0,25[11]) is carried out under the greater shear values. Deviation of the shear profile from a monotonic decrease with depth can also be explained by the contribution of geostrophic shears (Fig. 2, b) and the variability of currents in the frequency range less than the local inertial frequency. If the values of the shears were determined only by internal waves, then this behavior of the profile in the vicinity of the maximum buoyancy frequency would mean their intensification, which is not consistent with the data of autonomous buoy stations [12].
In tasks related to the determination of vertical mixing parameters, the ratio of the square of the shear to the square of the buoyancy frequency is ultimately
parameter with increasing depth, which at a qualitative level (KV ∝
(
Sh2 N2)
2 [8]) can be perceived as an increase in the processes of vertical turbulent mixing in the lower part of the main pycnocline.F i g. 2. Averaged profiles of the buoyancy frequency square (a), square of the current velocity
vertical shear (b), relation of the shear square to the buoyancy frequency square (c), turning angle of the current velocity shear vector (d). The first expedition – red lines, the second expedition – green lines, the third expedition – blue lines
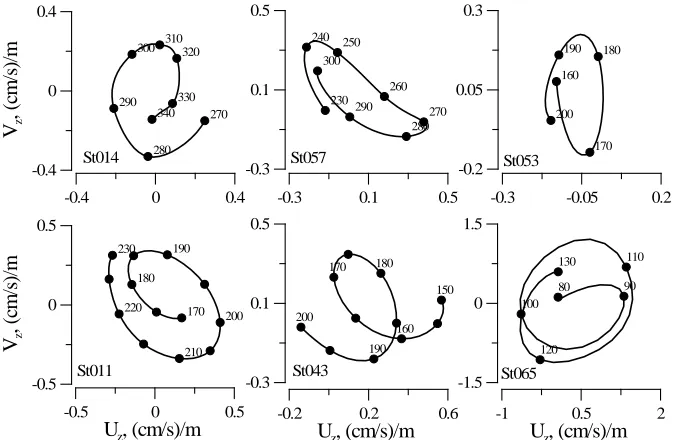
Fig. 2, d shows the average profiles of the shear vector rotation angle relative to its direction on the 15 m horizon for each expedition. The middle profiles show the rotation of the shear vector clockwise with a depth of almost two turns in 50– 350 m layer. This fact can be explained by the significance of the contribution of inertial oscillations to the formation of the vertical structure of the shears. Inertial oscillations are excited in the upper layer of the sea because of wind exposure [13] and propagate into the water column as internal waves with a frequency close to inertia. Such waves interact with inhomogeneities of the field of velocity of stable currents [14]. In the Northern Hemisphere, these waves, when propagating down-ward, are characterized by the velocity vector rotation (and, consequently, its shear) clockwise [15]. In a number of profiles, the shear rotation with depth is clearly pronounced. For an example, Fig. 3 shows the shear plots in different layers of the sea at different stations on the third expedition. In most cases, clockwise
〈N2〉, (rad/s)2
300 200 100
D
ep
th
,
m
〈Sh2〉, s-2
300 200 100
D
ep
th
,
m
0 0.2 0.4 0.6
〈Sh2〉/〈N2〉
300 200 100
D
ep
th
,
m
0 180 360 540 720
α,°
300 200 100
D
ep
th
,
m
10-4
10-5
10-6
10-3
10-4
10-5
a
b
c
d
rotation is observed. Another distinctive feature of internal waves with a frequency close to the inertial one is low potential energy. An attempt to estimate the potential energy at one of the stations came down to the following.
F i g. 3. Hodographs of the current velocity vertical share at different stations in the third expedition
(numerical markers denote depth)
Fig. 4, a shows fragments of the profiles of the shear components in a layer with a well pronounced rotation of the shear vector in a clockwise direction. (Fig. 3, St065). For a single internal wave, the ratio of the kinetic and potential
energies (Rω) can be determined from the relation 2 2
2 z N Sh R η =
ω , where
2 fit 2 fit 2 N N N z − =
η is the strain (the derivative of the depth of the isopycnal
displacement from the equilibrium position), Nfit is the buoyancy frequency in the
equilibrium state [16, 17]. In Fig. 4, b the measured value profile N2 is shown by a gray solid line, the linear dependenceNfit2 – by the grey dashed line, the measured profile ξ
( )
z =Nfit( )
z ηz – by the black dashed line. The energy ratio was calculatedas Rω−1=a2+b2 =0,0126, where a and b were determined by the least squares method of the ratio ξ
( )
z =aShU( )
z +bShV( )
z (the black solid line at Fig. 4, b). An estimate of the frequency of the observed wave can be obtained from the relation(
)(
)
(
2 2)
{
,(
1)
, 1}
1 1,0126 .2 2 2 2 2 f R f N f N N f
R ⇒ >>ω ω= +δ δ<< ⇒δ≈ ⇒ω≈
− ω ω − + ω = ω − ω
The result of the profile fragment analysis shows that a well-pronounced rotation of the shear vector with depth according to formal features corresponds to an near-internal wave.
-0.3 0.1 0.5
-0.3 0.1 0.5 230 240 250 260 270 280 290 300
-0.4 0 0.4
-0.4 0 0.4 Vz , ( cm /s )/ m 270 280 290
300 310320
330 340
-0.5 0 0.5
Uz, (cm/s)/m
-0.5 0 0.5 Vz , ( cm /s )/ m 170 180 190 200 210 220 230
-0.2 0.2 0.6
Uz, (cm/s)/m
-0.3 0.1 0.5 150 160 170 180 190 200
-1 0.5 2
Uz, (cm/s)/m
-1.5 0 1.5 80 90 100 110 120 130
-0.3 -0.05 0.2
A qualitative assessment of the significance of the contribution of inertial internal waves to shears in the Black Sea is consistent with data obtained at autonomous buoy stations in various regions of the World Ocean and showing the presence of a pronounced maximum of the shear spectrum in the vicinity of the local inertial frequency [18, 19].
F i g. 4. Profile fragments of the current velocity shears (a), and the buoyancy and deformation
frequency (b)
Conclusion
Based on the analysis of the materials of three expeditions, the characteristic features of the averaged vertical structure of shears in the permanent pycnocline of the northern Black Sea were identified. The main feature of the average vertical shear profile is the presence of a maximum in the vicinity of the maximum buoyancy frequency. The average ratio of shears to the buoyancy frequency in a 50–350 m layer shows an almost monotonic increase with depth. On average, the clockwise rotation of the shear with depth show significant effect of near-internal waves, on the formation of the vertical structure of the shears.
REFERENCES
1. Ostrovskii, A.G. and Zatsepin, A.G., 2016. Intense Ventilation of the Black Sea Pycnocline due to Vertical Turbulent Exchange in the Rim Current area. Deep-Sea Research Part I: Oceanographic Research Papers, [e-journal] 116, pp. 1-13. http://dx.doi.org/10.1016/j.dsr.2016.07.011
2. Kunze, E., Firing, E., Hummon, J.M., Chereskin, T.K. and Thurnherr, A.M.,2006. Global Abyssal Mixing Inferred from Lowered ADCP Shear and CTD Strain Profiles. Journal of Physical Oceanography, [e-journal] 36, pp. 1553-1576. http://dx.doi.org/10.1175/JPO2926.1 3. Morozov, A.N. and Lemeshko, E.M., 2014. Otsenka Vertikal'noy Turbulentnoy Diffuzii po
Dannym CTD/LADCP-Izmereniy v Severo-zapadnoy Chasti Chernogo Morya v Mae 2004 Goda [Evaluation of Vertical Turbulent Diffusion from CTD/LADCP Measurements in the Northwestern Part of the Black Sea in May 2004]. Morskoy Gidrofizicheskiy Zhurnal, (1), pp. 58-67 (in Russian).
4. Podymov, O.I., Zatsepin, A.G. and Ostrovskii, A.G., 2017. Vertical Turbulent Exchange in the Black Sea Pycnocline and its Relation to Water Dynamics. Oceanology, [e-journal] 57 (4), pp. 492-504. doi:10.1134/S0001437017040142
-1 0 1
Uz , Vz, (cm/s)/m
140 120 100 80
D
ep
th
,
m
Uz
Vz
0 0.0001 0.0002 0.0003
N2, (rad/s)2
140 120 100 80
D
ep
th
,
m
-0.3 0 0.3 0.6
ξ, (cm/s)/m
N2
ξ
5. Firing, E., Gordon, R., 1990. Deep Ocean Acoustic Doppler Current Profiling. Proceedings IEEE 4th Working Conference on Current Measurement, April 3-5, 1990. MD, IEEE, pp. 192-201. doi:10.1109/CURM.1990.110905
6. Visbeck, M., 2002. Deep Velocity Profiling Using Lowered Acoustic Doppler Current Profilers: Bottom Track and Inverse Solutions. Journal of Atmospheric Oceanic Technology, [e-journal] 19, pp. 794-807. doi:10.1175/1520-0426(2002)019<0794:DVPULA>2.0.CO;2 7. Munk, W. and Anderson, E., 1948. Notes on a Theory of the Thermocline. Journal of Marine
Research, [e-journal] 3, pp. 267-295.
8. Gregg, M.C., 1989. Scaling Turbulent Dissipation in the Thermocline. Journal of Geophysical Research, [e-journal] 94(C7), pp. 9686-9698. http://dx.doi.org/10.1029/JC094iC07p09686 9. Morozov, A.N. and Lemeshko, E.M., 2006. Methodical Aspects of the Application of
Acoustic Doppler Current Profilers in the Black Sea. Physical Oceanography, [e-journal] 16(4), pp. 216-233. https://doi.org/10.1007/s11110-006-0027-8
10. Artamonov, Yu.V., Skripaleva, E.A., Fedirko, A.V., Shutov, S.A., Shapovalov, R.O. and Shchebachenko, S.V., 2018. Water Circulation in the Northern Black Sea in Summer, 2016 (Based on the Data Obtained in the 87th Cruise of the R/V “Professor Vodyanitsky”). Physical
Oceanography, [e-journal] 25(1), pp. 52-66. doi:10.22449/1573-160X-2018-1-52-66
11. Miles, J.W., 1961. On the Stability of Heterogeneous Shear Flows. Journal of Fluid Mechanics, [e-journal] 10(4), pp. 496-508. doi:10.1017/S0022112061000305
12. Morozov, A.N., 2001. Spectralnye Characteristiki Inercionnyh Kolebanii v Chernom More [Spectral Parameters of Inertial Oscillations in the Black Sea]. In: MHI, 2001.
Ekologicheskaya Bezopasnost' Pribrezhnoy i Shel'fovoy Zon i Kompleksnoe Ispol'zovanie Resursov Shel'fa [Ecological Safety of Coastal and Shelf Zones and Comprehensive Use of Shelf Resources]. Sevastopol: MHI NANU. Iss. 2, pp. 61-69 (in Russian).
13. Pollard, R.T. and, Millard, R.C., 1970. Comparison between Observed and Simulated Wind-Generated Inertial Oscillations. Deep-Sea Research and Oceanographic Abstracts, [e-journal] 17(4), pp. 817-821. https://doi.org/10.1016/0011-7471(70)90043-4
14. Kunze, E., 1985. Near-Inertial Wave Propagation in Geostrophic Shear. Journal of Physical Oceanography, [e-journal] 15(5), pp. 544-565. https://doi.org/10.1175/1520-0485(1985)015<0544:NIWPIG>2.0.CO;2
15. Leaman, K.D. and Sanford, T.B., 1975. Vertical Energy Propagation of Inertial Waves: A Vector Spectral Analysis of Velocity Profiles. Journal of Geophysical Research, [e-journal] 80(15), pp. 1975-1978. https://doi.org/10.1029/JC080i015p01975
16. Polzin, K.L., Toole, J.M. and Schmitt, R.W., 1995. Finescale Parameterizations of Turbulent Dissipation. Journal of Physical Oceanography, [e-journal] 25(3), pp. 306-328. https://doi.org/10.1175/1520-0485(1995)025<0306:FPOTD>2.0.CO;2
17. Alford, M.H. and Gregg, M.C., 2001. Near-inertial Mixing: Modulation of Shear, Strain and Microstructure at Low Latitude. Journal of Geophysical Research: Oceans, [e-journal] 106(C8), pp. 16947-16968. https://doi.org/10.1029/2000JC000370
18. MacKinnon, J.A. and Gregg, M.C., 2005. Near-Inertial Waves on the New England Shelf: The Role of Evolving Stratification, Turbulent Dissipation, and Bottom Drag. Journal of Physical Oceanography, [e-journal] 35(12), pp. 2408-2424. https://doi.org/10.1175/JPO2822.1 19. Jing, Z., Chang, P., DiMarko, S.F. and Wu, L., 2015. Role of Near-Inertial Internal Waves in
Subthermocline Diapycnal Mixing in the Northern Gulf of Mexico. Journal of Physical Oceanography, [e-journal] 45(12), pp. 3137-3154. https://doi.org/10.1175/JPO-D-14-0227.1
About the author:
Aleksey N. Morozov, senior Research Associate, PhD in Technical Sciences, Remote Sensing
Department, FSBSI MHI (2, Kapitanskaya St., Sevastopol, Russian Federation, 299011), ORCID:
0000-0001-9022-3379, [email protected]
The author has read and approved the final manuscript.
![Fig. 2, dof the sea at different stations on the third expedition. In most cases, clockwise shear) clockwise [15]](https://thumb-us.123doks.com/thumbv2/123dok_us/8838729.1793523/4.516.94.423.119.428/fig-different-stations-expedition-cases-clockwise-shear-clockwise.webp)