Ann. Geophys., 31, 555–562, 2013 www.ann-geophys.net/31/555/2013/ doi:10.5194/angeo-31-555-2013
© Author(s) 2013. CC Attribution 3.0 License.
EGU Journal Logos (RGB)
Advances in
Geosciences
Open Access
Natural Hazards
and Earth System
Sciences
Open AccessAnnales
Geophysicae
Open AccessNonlinear Processes
in Geophysics
Open AccessAtmospheric
Chemistry
and Physics
Open AccessAtmospheric
Chemistry
and Physics
Open Access DiscussionsAtmospheric
Measurement
Techniques
Open AccessAtmospheric
Measurement
Techniques
Open Access DiscussionsBiogeosciences
Open Access Open Access
Biogeosciences
DiscussionsClimate
of the Past
Open Access Open Access
Climate
of the Past
Discussions
Earth System
Dynamics
Open Access Open Access
Earth System
Dynamics
DiscussionsGeoscientific
Instrumentation
Methods and
Data Systems
Open Access
Geoscientific
Instrumentation
Methods and
Data Systems
Open Access DiscussionsGeoscientific
Model Development
Open Access Open Access
Geoscientific
Model Development
DiscussionsHydrology and
Earth System
Sciences
Open AccessHydrology and
Earth System
Sciences
Open Access DiscussionsOcean Science
Open Access Open Access
Ocean Science
DiscussionsSolid Earth
Open Access Open Access
Solid Earth
DiscussionsThe Cryosphere
Open Access Open Access
The Cryosphere
DiscussionsNatural Hazards
and Earth System
Sciences
Open Access
Discussions
Analysis of the substructure within a complex magnetic cloud on
3–4 September 2008
K. Andreeova1, E. K. J. Kilpua1, H. Hietala1,*, H. E. J. Koskinen1,2, A. Isavnin1, and R. Vainio1
1Department of Physics, P.O. Box 64, University of Helsinki, Finland 2Finnish Meteorological Institute, Helsinki, Finland
*currently at: Imperial College, London, UK
Correspondence to: K. Andreeova ([email protected])
Received: 14 May 2012 – Revised: 29 January 2013 – Accepted: 10 February 2013 – Published: 21 March 2013
Abstract. In this paper we have analyzed a substructure
found within a leading part of a north–south-oriented mag-netic cloud (MC) observed on 3–4 September 2008 in the near-Earth solar wind by multiple spacecraft (ACE, Wind, THEMIS B and C). The MC was preceded by a stream in-terface (SI) and followed by a high-speed stream (HSS). The identified substructure featured a strong depletion of suprathermal halo electrons and showed distinct magnetic field and plasma signatures. It occurred where suprathermal electron flow within a cloud changed from bidirectional to unidirectional, indicating change in the field line connectiv-ity to the Sun. We found that the substructure maintained roughly its integrity from the first Lagrangian point to the vicinity of the Earth’s bow shock in the front edge of the MC, but revealed small changes in the structure which could be explained either by temporal evolution or spatial configu-ration of the spacecraft.
Keywords. Interplanetary physics (Solar wind plasma)
1 Introduction
Magnetic clouds (MCs) are a subset of interplanetary coronal mass ejections (ICMEs), which can be identified by smooth rotation of the magnetic field over a time interval on the order of one day, enhanced magnetic field strength, and decreased proton temperature (Burlaga and Behannon, 1982; Klein and Burlaga, 1982). MCs are large-scale solar wind structures; at the orbit of the Earth their radial diameters are on aver-age 0.25 AU (Lepping et al., 2006). Due to their strong and long-lasting southward magnetic fields MCs often drive large magnetospheric storms (Richardson et al., 2001).
Although by the definition MCs have smoothly chang-ing magnetic fields, magnetic field variations of different scale-sizes have been reported within the MCs. Steed et al. (2011) found that some MCs that are followed by high-speed streams contain a specific internal structure, where multiple reversals of the azimuthal magnetic field gradient are ob-served. These “substructures” have depressed magnetic field magnitudes accompanied by an increase in the proton den-sity and temperature. As a significant fraction of MCs oc-cur close to the interplanetary magnetic field (IMF) sector boundaries and are followed by high-speed streams (Crooker et al., 1998; Fenrich and Luhmann, 1998), the distortion of the MC structure by the following high-speed stream is a common scenario. Substructures have also been used to de-fine MC front boundaries (Wei et al., 2003) and to separate MCs from ICME-related plasma ahead (Farrugia et al., 2001; Kilpua et al., 2013a).
According to above-described studies the analysis of MC substructures may yield important information on the history of the interaction between the MC and the ambient solar wind as well as on the CME release process. They can also help in distinguishing different regions within ICMEs and thus give insight into how ICMEs are generated.
Solar wind suprathermal electrons at 1 AU with energies above 100 eV are essentially collisionless and they provide a practical tool to analyze how magnetic field lines within a MC are connected to the Sun. Gosling et al. (1987) used counterstreaming signature of the suprathermal electrons as an indicator of the MC, beamed electrons propagating along the magnetic field lines in both directions, indicating that the magnetic field lines were connected at both ends to the Sun (Montgomery et al., 1974). However, as shown by Shodhan
556 K. Andreeova et al.: 3–4 September 2008 event
Table 1. Table summarizes the satellites, instruments, and their available time resolutions used in this study.
Satellite Instrument Time resolution [s]
ACE Magnetic field (MAG) 16
Solar Wind Electron Proton Alpha Monitor (SWEPAM) 64 Wind Magnetic Field Investigation (MFI) 3, 0.92
Solar Wind Experiment (SWE) 100
3-D Plasma Analyzer (3DP) 3
THEMIS Flux Gate Magnetometer (FGM) 0.008, 0.25, 3
Electrostatic analyzer (ESA) 420
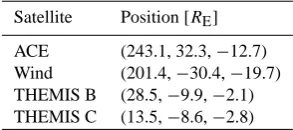
Table 2. Table summarizes spacecraft position in the GSE coordi-nate system.
Satellite Position [RE]
ACE (243.1, 32.3,−12.7) Wind (201.4,−30.4,−19.7) THEMIS B (28.5,−9.9,−2.1) THEMIS C (13.5,−8.6,−2.8)
et al. (2000), Crooker et al. (2008) and Riley et al. (2004), a significant fraction of MCs are associated with completely unidirectional electron flow, suggesting open field lines or a mixture of open and closed field lines.
Another prominent feature often detected in the pitch an-gle spectrograms of 1 AU suprathermal electrons is the deple-tion at 90◦pitch angles. When such a depletion is observed on open field lines, it arises from a combination of adiabatic focusing and mirroring of backstreaming halo electrons from a magnetic field enhancement farther out in the heliosphere (Gosling et al., 2001). In turn, Gosling et al. (2002) suggested that 90◦pitch angle depletion observed on closed field lines arises primarily from the double magnetic connection to the Sun.
In this study, we investigate a substructure identified within a leading part of the MC observed in the near-Earth solar wind on 3–4 September 2008. The MC was compressed within a slow–fast solar wind stream interaction region re-sulting in a complex internal structure of the MC. We use well-distributed multi-spacecraft observations from the first Lagrangian point (L1) to the vicinity of the Earth’s magne-topause to study the evolution of the substructure and inter-nal dynamics of the ICME. An integral part of our study is a detailed analysis of suprathermal electron observations dur-ing the substructure and the MC; we show that the substruc-ture is associated with a strong 90◦ pitch angle depletion resulting from the adiabatic focusing towards the region of the magnetic field depression. The paper is organized as fol-lows: Sect. 2 summarizes data used in this paper. Section 3 introduces the event. Sect. 4 discusses and interprets the 90◦ pitch angle suprathermal electron halo depletion structure. Section 5 concludes the paper.
2 Data sources
To investigate the event on 3–4 September 2008 we use si-multaneous data from different satellites in the solar wind. The onboard instruments used and their time resolution are summarized in Table 1. ACE and Wind were located at the Lagrangian point L1, and THEMIS B and C were ahead of the Earth’s bow shock, summarized in Table 2.
The satellite data were obtained through the CDAWeb service (http://cdaweb.gsfc.nasa.gov/sp phys/) and CNES-SADS (http://sads.cnes.fr:8010/). To present the data, we use Geocentric Solar Ecliptic (GSE) coordinates.
3 Event overview
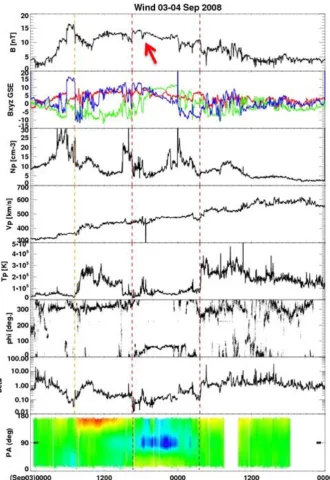
Since all solar wind monitors used in this study detected roughly similar large-scale structures, we describe here pri-marily observations only from the Wind spacecraft. Figure 1 presents solar wind observations from 3–4 September 2008 from the Wind satellite at L1. This interval shows a com-plex solar wind structure that consists of two nearby large-scale structures: a stream interaction region (SIR) (Burlaga, 1974) that separates slow- and fast-speed solar wind flows on 3 September at about 07:00 UT and a magnetic cloud (MC) with north–south rotation of Bz. The local magnetosonic speed changed from 70 to 100 km s−1within the leading part of the MC. The solar wind speed difference between the MC and the ambient solar wind was smaller, about 30 km s−1. As a consequence, the MC did not drive an interplanetary shock. However, a region of enhanced density was detected ahead of the MC.
[image:2.595.93.240.238.303.2]K. Andreeova et al.: 3–4 September 2008 eventAndreeova et al.: 03-04 September, 2008 event 3 557
Fig. 1.Wind spacecraft observation of the stream interface (SI) depicted by the orange dashed line and magnetic cloud (MC) depicted by the red dashed lines. Panels from the top: total magnetic field (B [nT]), components of the interplanetary magnetic field in GSE coordinate system, plasma density (Np [cm-3]), solar wind speed (Vp [km/s]), proton temperature (Tp [K]), angle phi (deg.), beta parameter, and the last panel gives the electron pitch angle spectrograms for the low-energy Electron Electrostatic Analyzer (EESA-L) on the 3DP of Wind instrument energy channel 249 eV. The color coding indicates the amplitude of the distribution functions in units of s3 km-3 cm-3. The red arrows illustrate the time of the small substructure.
Fig. 1. Wind spacecraft observation of the stream interface (SI) depicted by the orange dashed line and magnetic cloud (MC) depicted by the red dashed lines. Panels from the top: total magnetic field (B[nT]), components of the interplanetary magnetic field in the GSE coordinate system, plasma density (Np [cm−3]), solar wind speed (Vp [km s−1]), proton temperature (Tp [K]), angleφ(deg.), beta parameter, and the last panel gives the electron pitch angle spectrograms for the low-energy Electron Electrostatic Analyzer (EESA-L) on the 3DP of Wind instrument energy channel 249 eV. The color coding indicates the amplitude of the distribution functions in units of s3 km−3cm−3. The red arrows illustrate the time of the small substructure.
The diameter of the MC at 1 AU was about 0.12 AU, calcu-lated by multiplying the duration of the MC with its aver-age speed. The obtained width is slightly smaller than the typical MC dimension at 1 AU at solar minimum between cycles 23 and 24 of about 0.25 AU at the orbit of the Earth (Kilpua et al., 2011). The rear end of the MC was observed
by Wind at about 03:45 UT when the temperature increased to 2.6×10⁵K, the magnetic field decreased from 11 nT to 6.5 nT and the solar wind speed increased to 500 km s−1. The MC was pushed from behind by the high-speed stream.
Based on the magnetic field data (Fig. 1), the solar wind upstream and downstream from the MC was in the toward
558 K. Andreeova et al.: 3–4 September 2008 event
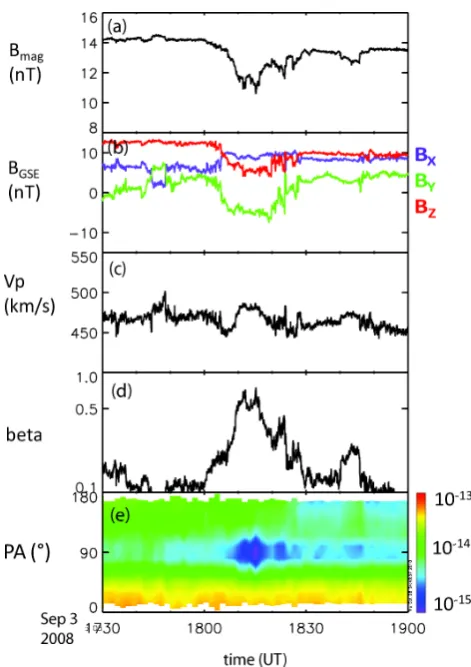
Fig. 2. Zoom-in around the 90◦ pitch angle depletion (arrow in Fig. 1). The panels give from top to bottom (a) magnetic field mag-nitude, (b) magnetic field components in GSE, (c) solar wind speed, (d) plasma beta, and (e) the electron pitch angle spectrograms for the low-energy Electron Electrostatic Analyzer (EESA-L) on the 3DP instrument of Wind energy channel 249 eV. The color cod-ing indicates the amplitude of the distribution functions in units of s3km−3cm−3.
(sunward) sector of IMF, while the majority of the MC in-terval was in the away (anti-sunward) sector. At the time of this study, the sunward (anti-sunward) IMF was connected to the Northern (Southern) Hemisphere. The observed IMF polarities agree with suprathermal electron observations (last panel of Fig. 1) showing that before and after the MC the heat flux flow was anti-parallel to the magnetic field lines (i.e. concentrated on pitch angles around 180◦), while dur-ing the MC the strongest flow was observed parallel to the magnetic field. Pitch angle spectrogram also reveals that at this time a weaker heat flux was intermittently observed at 180◦ pitch angles and a band of depletion centered on 90◦ was present throughout most of the cloud.
It is not clear whether this counterstreaming feature, be-ing clearly asymmetric, represents magnetic field lines still attached to the Sun at both ends or field lines that have been open by interchange reconnection (e.g. Crooker et al., 2002)
[image:4.595.48.284.59.393.2]Andreeova et al.: 03-04 September, 2008 event
5
Fig. 2.
Zoom-in around the
90
◦pitch angle depletion (arrow in
Fig-ure 1) . The panels give from top to bottom a) magnetic field
mag-nitude, b) magnetic field components in GSE, c) solar wind speed,
d) plasma beta, and e) the electron pitch angle spectrograms for the
low-energy Electron Electrostatic Analyzer (EESA-L) on the 3DP
instrument of Wind energy channel 249 eV. The color coding
indi-cates the amplitude of the distribution functions in units of s
3km
−3cm
−3.
Fig. 3.
ACE observation: zoom-in around the
90
◦pitch angle
de-pletion. The panels give from top to bottom a) magnetic field
mag-nitude, b) magnetic field components in GSE, c) solar wind speed,
d) plasma beta, and e) the electron pitch angle spectrograms for
the low-energy Electron Electrostatic Analyzer (EESA-L) on the
SWEPAM instrument of ACE energy channel 249 eV.
the small structure was estimated from the timing about 60
-245
85 Re. The separation between ACE and Wind was about 65
Re in Y direction. During the period solar wind speed
direc-tion revealed strong z-component (data not shown) leading
to a more complicated structure as seen in Figure 6. This
might contribute to the complexity of the substructure. The
250
interplanetary magnetic field direction was quasi-radial, with
average IMF cone angle about
38
◦.
5
Interpretation
We observed
90
◦depletion of suprathermal electrons during
most of the MC, while the substructure studied in Section 4
255
featured the strongest depletion and distinct magnetic field
Fig. 3. ACE observation: zoom-in around the 90◦pitch angledeple-tion. The panels give from top to bottom (a) magnetic field magni-tude, (b) magnetic field components in GSE, (c) solar wind speed, (d) plasma beta, and (e) the electron pitch angle spectrograms for the low-energy Electron Electrostatic Analyzer (EESA-L) on the SWEPAM instrument of ACE energy channel 249 eV.
from the other end. Nevertheless, the strong heat flux at 180◦ suggests that the MC was sampled at its positive leg (i.e. the leg whose field lines point away from the Sun). If we assume that also the negative MC leg was still attached to the Sun, the weaker heat flux at pitch angles 180◦ would represent electrons originating from the negative leg that have traveled a longer path to the observing spacecraft than the electrons from the positive leg. Alternatively, in the case of the neg-ative leg having reconnected, open weaker heat flux would represent electrons from the positive leg that have streamed all the way along the MC loop and reflected back from the high magnetic fields of the negative leg.
K. Andreeova et al.: 3–4 September 2008 event 559
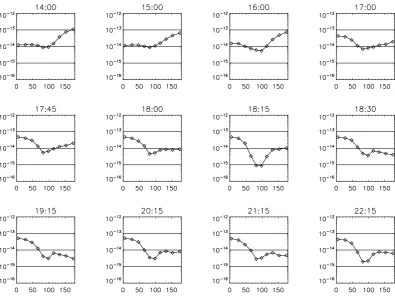
Fig. 4. Wind observation: Electron pitch angle distributions for the low-energy Electron Electrostatic Analyzer (EESA-L) on the 3DP instru-ment energy channel 250 eV for different times labeled above each panel.
4 Suprathermal electron depletion in 90◦pitch angle
We analyze the small-scale substructure that was located close to the leading edge of the MC and featured a strong de-pletion of suprathermal electrons centered at 90◦(indicated by a red arrow in Fig. 1). This substructure clearly stands out from the other depletions observed during the MC as it is as-sociated with a decrease in the magnetic field magnitude as well as increased density and temperature. The leading edge of the substructure was a tangential discontinuity.
Figures 2 and 3 provide a close-up view of the substruc-ture by Wind and ACE. The strongest depletion in 90◦pitch angle occurred during the deepest decrease of the total mag-netic field both in Wind and ACE. Plasma beta was low in the ambient MC, and within the substructure beta increased to 1 following the decrease of the magnetic field strength, and the increase of the density, in order to conserve the pressure balance.
Figure 4 shows the electron pitch angle distribution at 249 eV on 3 September 2008 for selected times: in the solar wind upstream from the MC, in the MC upstream from the substructure at 18:15 UT, and in the MC downstream from the substructure until 22:15 as measured by the Wind space-craft. In the top row, the first three panels reveal the strongest heat flux at 180◦ pitch angle, coinciding with the IMF
to-ward sector. The decrease in the pitch angle spectrogram in-tensity at 90◦ is clearly visible during most of the MC in-terval. In MCs such decreases can result from the 90◦pitch angle depletion due to focusing and mirroring effects from the enhanced magnetic field or from the counterstreaming electrons in the magnetically closed structure. From Fig. 4 it is seen that for this MC it is a result of both of these mech-anisms. The strongest heat flux within the MC was parallel to the magnetic field from the last panel in the first row at 17:00 UT to the last panel of Fig. 4. The strongest depletion at 90◦pitch angle occurred at 18:15 UT, the third panel in the second row of Fig. 4.
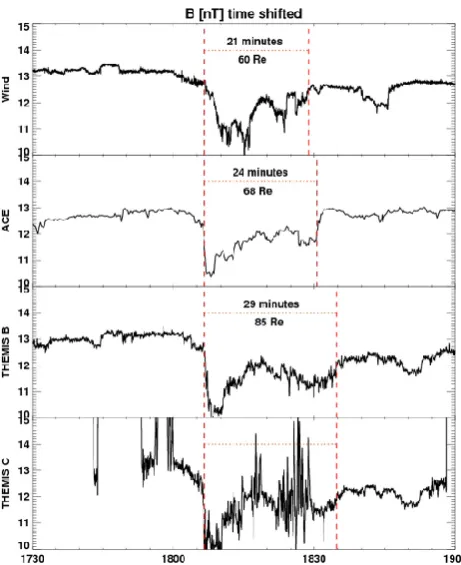
The magnetic field magnitudes recorded at Wind, ACE, THEMIS B, and THEMIS C with the durations and esti-mated widths of the substructure are shown in Fig. 5. The substructure lasted from about 21 min at Wind to 29 min at THEMIS B and C. We estimated the width of the substruc-ture by multiplying its duration at each spacecraft by its av-erage speed. As THEMIS B and C did not have solar wind energy flux spectra available at the time of this study we used the speed recorded at Wind. The width of the substruc-ture varied from 60 to 85RE(where 1RE=6371 km) from Wind to Themis B and C. The substructure occupied on av-erage 0.003 AU, which is small compared to the width of the MC it was embedded within (see Sect. 3). The Wind satellite
560 K. Andreeova et al.: 3–4 September 2008 event
Fig. 5. Time-shifted magnetic field observation according to Wind: Wind, ACE −27 min, THEMIS B + 42 min and THEMIS C + 46 min. The red dashed lines depict the depletion halo onset and end, and different time duration and estimated width: Wind−21 min (60RE), ACE−24 min (68RE), and THEMIS B and C−29 min (85RE).
observed the depletion structure 40 min after the MC front. On the other hand THEMIS B and C observed the depletion structure already 34 min after the MC front.
THEMIS B was located in the solar wind during the obser-vation of the SIR and the MC. On the other hand THEMIS C was at the beginning in the Earth’s magnetosheath and after the several bow shock crossings ended up also in the solar wind. During the passage of the substructure, THEMIS C was in the Earth’s foreshock region after the last crossing of the bow shock to the solar wind at 18:45 UT, indicated by the high fluctuations in the magnetic field. All satellites ob-served similar total magnetic field decrease from 13.2 nT to 10.5 nT and similar progress, first decrease and after about 7 min increase of the total magnetic field to about half of the original magnitude, after which all satellites observed second decrease of the total magnetic field. The main difference is in the time duration and in the profile of the structure indicating that the substructure may not be steady in its propagation in the solar wind.
[image:6.595.311.543.58.330.2]On the other hand Fig. 6 illustrates a 3-dimensional picture of the substructure, rotation in the y-component of the mag-netic field. As it was shown in Fig. 5, the width of the small structure was estimated from the timing about 60–85RE. The
Fig. 6. The top panel: cross-section in the equatorial plane; the second panel: cross-section in the xz-plane; and the last panel: 3-dimensional picture of the IMF by Wind (blue arrows), THEMIS B (cyan arrows), and ACE (red arrows) at the time when Wind ob-served the leading edge of the substructure. The substructure is in-dicated by the darker hue of the arrows. The magnetic field obser-vation was plotted in 3-D space, assuming that the field was frozen in to the flow. The triangular planes depict the leading front of the structure. Black dots denote positions of the spacecraft.
separation between ACE and Wind was about 65RE in y-direction. During the period solar wind speed direction re-vealed a strong z-component (data not shown) leading to a more complicated structure as seen in Fig. 6. This might con-tribute to the complexity of the substructure. The interplan-etary magnetic field direction was quasi-radial, with average IMF cone angle of about 38◦.
5 Interpretation
[image:6.595.50.281.60.343.2]K. Andreeova et al.: 3–4 September 2008 event 561
field depression and plasma compression region they were focused toward the direction of the magnetic field lines, i.e. 0◦pitch angle. Assuming adiabatic electron motion when the magnetic field magnitude decreased inside the small-scale structure, the perpendicular component of the electron speed decreased and the parallel component increased. The elec-trons had enough parallel energy to escape from the other end of the structure, and thus there were no trapped electrons left inside the structure.
In contrast to Figs. 2 and 3, Fig. 5 shows slightly different conditions of the studied structure. Both Wind and ACE ob-served depletion in 90◦pitch angle, with plasma density en-hancement. The overall magnetic field characteristics were similar between all investigated spacecraft from L1 to the foreshock region, but with different time duration and width: about 60–85RE. Figure 6 illustrates the complicated struc-ture in 3-dimensional view, trying to determine the origin and the possible evolution of the structure. ACE and Wind observed comparable length and duration, while THEMIS B and C observed much longer duration. During the substruc-ture, the interplanetary magnetic field had almost radial di-rection, and as a consequence THEMIS C in front of the nose of the bow shock was in the foreshock region. Also THEMIS B was in a similar location, about 15RE farther from the bow shock. The longer duration of the substruc-ture could be caused either by the interaction with the Earth’s bow shock or by the different local behavior of the substruc-ture coming from a slightly different location (cyan arrows in Fig. 6), which could reflect either complicated and stable structure or evolving structure in the solar wind. The front of the small structure is a tangential discontinuity. Assuming magnetic coplanarity, the normal vectors are depicted by the colored triangles in Fig. 6.
Regions of depressed magnetic fields are also occasion-ally observed at the leading edges of magnetic clouds (Wei et al., 2003). These depressions are localized regions where the IMF magnitude is depressed well below average accom-panied by a simultaneous increase in plasma pressure. The small-scale structure studied in this paper was in pressure balance and had similar time scales and overall properties to previously studied MC-related substructures, but the mag-netic field depression was only a few nanoteslas.
The substructure studied in this work shares several simi-larities with the substructures studied by Steed et al. (2011): it was identified within a complex and relatively small MC compressed within a SIR, had similar duration and featured similar overall magnetic field and plasma characteristics. The distortion in the substructure was compressive and the in-crease in the plasma pressure was compensated by the de-crease of the magnetic pressure. However, the location of the substructure within the MC was more similar to a substruc-ture studied by Farrugia et al. (2001); i.e. it occurred close to the leading edge of the MC rather than in the middle of the MC as all substructures investigated by Steed et al. (2011). Farrugia et al. (2001) noted that the ICME-related signatures
began already a few hours before the MC and the substruc-ture, and thus the authors suggested that the substructure was a reconnection layer related to a reconnection between the bundles of the field lines internal to a CME and the MC rep-resented only a part of this larger CME. However, the sub-structure studied in this article was considerably shorter than the substructure studied by Farrugia et al. (2001) (25 min vs. 1.5 h) and the associated magnetic field depression was more modest.
The CME that produced the MC studied in this work left the Sun on 30 August and was seen by the coronagraphs on SOHO and STEREO. Kilpua et al. (2013b) and Isavnin et al. (2012) have performed a forward modeling (Thernisien et al., 2009) of this CME, and it is evident that the CME was di-rected to the Earth. The white-light movies from STEREO-B reveal that shortly after the release of the bright and wide CME a narrow and faster CME seems to propagate along its northern leg. The latter CME, being so faint and narrow (as well as seen clearly only by STEREO-B), cannot be re-constructed with a forward-modeling technique. Since this narrow CME was faster than the first one it is possible that they have interacted, contributing to the complex structure of the studied MC. Therefore, we cannot rule out the possibility that the studied substructure represents a reconnection layer associated with the reconnection that took place between the field lines of the smaller and the larger CME. Solar wind measurements do not show obvious signatures of two CMEs, but typically it anyway is difficult to distinguish individual characteristics of merger ICMEs (Lugaz et al., 2009).
6 Conclusion
We have analyzed a small-scale substructure within the MC on 3–4 September 2008. The MC was preceded by a stream interface and followed by a high-speed stream. The identified substructure stood out from the ambient MC by distinct solar wind plasma and magnetic field signatures and featured also a strong depletion of the suprathermal halo electrons. This configuration represents a small-scale magnetic bottle where electrons counterstreaming in the large-scale MC loop enter from the opposite sides of the magnetic bottle. The distor-tion was compressive and compensated by the decrease of the magnetic pressure. Our multi-spacecraft analysis showed that the width of the substructure varied somewhat from L1 to the Earth, but maintained roughly its integrity and char-acteristic features. The substructure was located close to the point in the MC where the suprathermal electron flow charac-teristics indicated changing field line connectivity, and thus it possibly was a relic of a complex CME release process. An extensive statistical study will be performed in the future to survey whether suprathermal halo electron depletions are common features of MC substructures.
562 K. Andreeova et al.: 3–4 September 2008 event
Acknowledgements. This work was supported by the Academy of Finland (project 138596). We thank the CDAWeb service and the corresponding PIs for the satellite data.
Editor-in-chief M. Pinnock thanks two anonymous referees for their help in evaluating this paper.
References
Burlaga, L. F.: Interplanetary stream interfaces, J. Geophys. Res., 79, 3717, doi:10.1029/JA079i025p03717, 1974.
Burlaga, L. F. and Behannon, K. W.: Magnetic clouds – Voyager observations between 2 and 4 AU, Solar Phys., 81, 181–192, doi:10.1007/BF00151989, 1982.
Crooker, N. U., Gosling, J. T., and Kahler, S. W.: Magnetic clouds at sector boundaries, J. Geophys. Res., 103, 301, doi:10.1029/97JA02774, 1998.
Crooker, N. U., Gosling, J. T., and Kahler, S. W.: Reducing helio-spheric flux from coronal mass ejections without disconnection, J. Geophys. Res., 107, 1028, doi:10.1029/2001JA000236, 2002. Crooker, N. U., Kahler, S. W., Gosling, J. T., and Lepping, R. P.: Evidence in magnetic clouds for systematic open flux transport on the Sun, J. Geophys. Res., 113, A12107, doi:10.1029/2008JA013628, 2008.
Farrugia, C. J., Vasquez, B., Richardson, I. G., Torbert, R. B., Burlaga, L. F., Biernat, H. K., M¨uhlbachler, S., Ogilvie, K. W., Lepping, R. P., Scudder, J. D., Berdichevsky, D. E., Semenov, V. S., Kubyshkin, I. V., Phan, T.-D., and Lin, R. P.: A reconnec-tion layer associated with a magnetic cloud, Adv. Space Res., 28, 759–764, doi:10.1016/S0273-1177(01)00529-4, 2001.
Fenrich, F. R. and Luhmann, J. G.: Geomagnetic response to mag-netic clouds of different polarity, Geophys. Res. Let., 25, 2999– 3002, doi:10.1029/98GL51180, 1998.
Gosling, J. T., Baker, D. N., Bame, S. J., Feldman, W. C., Zwickl, R. D., and Smith, E. J.: Bidirectional solar wind electron heat flux events, J. Geophys. Res., 92, 8519–8535, doi:10.1029/JA092iA08p08519, 1987.
Gosling, J. T., Skoug, R. M., and Feldman, W. C.: Solar wind elec-tron halo depletions at 90 deg pitch angle, Geophys. Res. Let., 28, 4155–4158, doi:10.1029/2001GL013758, 2001.
Gosling, J. T., Skoug, R. M., Feldman, W. C., and McComas, D. J.: Symmetric suprathermal electron depletions on closed field lines in the solar wind, Geophys. Res. Let., 29, 120000–1, doi:10.1029/2001GL013949, 2002.
Isavnin, A., Vourlidas, A., and Kilpua, E. K. J.: Three-dimensional evolution of erupted flux ropes from the Sun (2–20 Rs) to 1 AU, Solar Phys., doi:10.1007/s11207-012-0214-3, 2012.
Kilpua, E. K. J., Lee, C. O., Luhmann, J. G., and Li, Y.: Inter-planetary coronal mass ejections in the near-Earth solar wind during the minimum periods following solar cycles 22 and 23, Ann. Geophys., 29, 1455–1467, doi:10.5194/angeo-29-1455-2011, 2011.
Kilpua, E. K. J., Isavnin, A., Vourlidas, A., Koskinen, H. E. J., and Rodriguez, L.: On the relationship between interplanetary coro-nal mass ejections and magnetic clouds, Ann. Geophys., in re-view, 2013a.
Kilpua, E. K. J., Mierla, M., Rodriguez, R., Zhukov, A., Srivas-tava, N., and West, M.: Estimating travel times of coronal mass ejections to 1 AU using multi-spacecraft coronagraph data, Solar Phys., in press, 2013b.
Klein, L. W. and Burlaga, L. F.: Interplanetary mag-netic clouds at 1 AU, J. Geophys. Res., 87, 613–624, doi:10.1029/JA087iA02p00613, 1982.
Lepping, R. P., Berdichevsky, D. B., Wu, C.-C., Szabo, A., Narock, T., Mariani, F., Lazarus, A. J., and Quivers, A. J.: A summary of WIND magnetic clouds for years 1995–2003: model-fitted pa-rameters, associated errors and classifications, Ann. Geophys., 24, 215–245, doi:10.5194/angeo-24-215-2006, 2006.
Lugaz, N., Vourlidas, A., and Roussev, I. I.: Deriving the radial distances of wide coronal mass ejections from elongation mea-surements in the heliosphere – application to CME-CME inter-action, Ann. Geophys., 27, 3479–3488, doi:10.5194/angeo-27-3479-2009, 2009.
Montgomery, M. D., Asbridge, J. R., Bame, S. J., and Feldman, W. C.: Solar wind electron temperature depres-sions following some interplanetary shock waves: evidence for magnetic merging?, J. Geophys. Res., 79, 3103–3110, doi:10.1029/JA079i022p03103, 1974.
Richardson, I. G., Cliver, E. W., and Cane, H. V.: Sources of geomagnetic storms for solar minimum and maximum condi-tions during 1972–2000, Geophys. Res. Lett., 28, 2569–2572, doi:10.1029/2001GL013052, 2001.
Riley, P., Linker, J. A., Lionello, R., Miki´c, Z., Odstrcil, D., Hi-dalgo, M. A., Cid, C., Hu, Q., Lepping, R. P., Lynch, B. J., and Rees, A.: Fitting flux ropes to a global MHD solution: a compar-ison of techniques, J. Atmos. Solar-Terr. Phys., 66, 1321–1331, doi:10.1016/j.jastp.2004.03.019, 2004.
Shodhan, S., Crooker, N. U., Kahler, S. W., Fitzenreiter, R. J., Lar-son, D. E., Lepping, R. P., Siscoe, G. L., and Gosling, J. T.: Coun-terstreaming electrons in magnetic clouds, J. Geophys. Res., 105, 27261–27268, doi:10.1029/2000JA000060, 2000.
Steed, K., Owen, C. J., D´emoulin, P., and Dasso, S.: Investigating the observational signatures of magnetic cloud substructure, J. Geophys. Res., 116, A01106, doi:10.1029/2010JA015940, 2011. Thernisien, A., Vourlidas, A., and Howard, R. A.: Forward Model-ing of Coronal Mass Ejections UsModel-ing STEREO/SECCHI Data, Solar Phys., 256, 111–130, doi:10.1007/s11207-009-9346-5, 2009.