31
Chapter 3. Measuring changes in soil nutrient availability at the root surface
using ion-selective electrodes
Wells . M . D , Smith . J . S , Borras . J , Miller . J . A
Rothamsted Research, Harpenden, Hertfordshire AL5 2JQ , UK
uk . ac . bbsrc @ miller . tony : email ABSTRACT
For research on crop nutrition, in order to control nutrient supply to roots, plants have been usually
grown in hydroponic culture. There are some disadvantages in growing plants under these
conditions because this is an artificial situation due to the lack of a normal rhizosphere at the
root/soil interfaces. The rhizosphere and associated root morphology may have important
consequences for nutrient acquisition by roots. The aims of this research were to investigate more
fully nutrient availability in the soil/root interface by developing a method for growing roots in
rhizoboxes containing soil. This method allows direct access to the root surface and we have been
able to directly measure potassium and nitrate availability at the root surface using microelectrodes.
These measurements showed that gradients can develop along the length of the root. The
microelectrode measurements led to the idea that this methodology can be used for direct
evaluation of nutrient availability in the soil. In agriculture the efficient use of fertiliser by crops is
achieved by matching supply to demand but in practice this is very difficult to achieve, particularly
as the nutrient requirements for each type of crop are different and change throughout the season.
Regular and accurate measurement of soil nutrient status is very important in all agricultural
systems. The ability to manage soil nutrient supply to match the changing crop demand depends on
these measurements. However, soil nutrient status is dependent on a range of different factors
such as soil type, weather conditions (particularly temperature and rainfall), and previous cropping
32
method gives a value at one point in the field. Soil heterogeneity can be both spatial and temporal,
but usually soil measurements are taken shortly before a fertiliser treatment so that application
rates can be adjusted to account for what is available. The development of nutrient soil sensing
probes makes it possible to measure changes in soil nutrient availability throughout the year that
can be used to advise on future fertiliser applications.
Introduction
Soil nutrient availability is a key parameter for agriculture and the efficient use of fertiliser therefore
the methods for measuring it are very important. The methods for measuring soil nutrient status can
be divided into two types: 1) extraction methods and 2) direct soil water sampling methods.
Nutrients available for uptake by plant roots are dissolved as ions in the soil water solution and
therefore it is this pool which gives a direct measure of the nutrient supply at any one point in time.
Decisions on when and where to apply fertiliser can be made using measurements of soil available
nutrients. Such measurements can be more cost effective for farmers as the requirements of the
crop can be identified early, before yield is decreased. If action is delayed until deficiency symptoms
actually appear in crops, a sub-optimal yield will usually result.
Soil extraction methods provide a measure of the longer term potential to supply nutrients but the
release of these nutrients to make them available for uptake by plant roots depends on many
factors. These can be listed as: soil type, water content, the size of microbial populations and their
activity (in turn dependent on the available carbon supply), and pH. The extraction of plant nutrients
from soil is also complicated by the chemical strength of the extraction procedure, for example
many soil phosphate pools can be defined depending on the type of extraction procedure which is
used. These extraction procedures can be carefully defined but they have resulted in the use of
differing international standards for the measurement of soil available phosphate. For example,
‘Olsen P’ is the method used in the UK (Olsen et al., 1954) but ‘Mehlich 3’ is used in the USA
33
taken in the tests used for phosphate availability as the results can be influenced by other factors
(e.g. interfering chemicals, Axelrod and Greidinger, 1979). The Mehlich-3 assay is recommended
for any soil pH by Iowa State University, USA. Sodium bicarbonate extraction is used for Olsen P
but this extraction can be compromised by the centrifugation speed and organic carbon content of
the soil (Poile et al., 1990). Soil available potassium is usually also measured by exchanging the
cation from soil samples using high concentrations of inorganic salts (e.g. 1 M NH4NO3 or
ammonium acetate). While for measurements of soil available nitrate (NO3-) extraction washes with
a solution of 1 M KCl are used as one anion replaces the other to release the NO3- from the sample
(e.g. Djurhuus and Jacobsen, 1995). Soil water sampling methods involve the extraction of a soil
water sample for later laboratory analysis. The water samples are obtained by burying a water
permeable sampling device in the soil, commonly a ceramic suction cup, and then withdrawing and
small volume (e.g. Djurhuus and Jacobsen, 1995). This method has been modified to enable small
volume sampling to be used (Shen and Hoffland, 2007).
For crop nutrition, there has been a communication barrier between soil scientists and plant
biologists and this arises from the differing units that are used to measure soil available nutrients.
Plant biochemists and physiologists frequently use hydroponic systems for growing plants because
the nutrient supply can be easily controlled and measured by this method. On the other hand, soil
scientists commonly calculate nutrient availability using a chemical extraction procedure and then
express this figure in terms of a soil mass. Soil available nutrients are not usually expressed in
terms of the soil water content. Microelectrodes give a direct measure of the concentration of
nutrients, although more strictly it is differences in ion activity to which the electrodes actually
respond (Miller, 1995). Ion activity is the more biologically relevant parameter but it is closely
related and similar to concentration under most conditions. Ion-selective electrodes have been used
for measurements of pH in bulk soil (Quigley and Reid, 1995) and the rhizosphere (Nichol and Silk,
2001), their promise for soil K+ (Brouder et al., 2003) and NO3- (Clark et al., 2005) has been
34
producing rugged electrodes which provide an opportunity for long term in field monitoring of soil
nutrient availability and water status (in preparation). In this paper, we describe the use of
ion-selective microelectrode measurements to measure nutrient availability in the rhizosphere and
discuss how the technique may have wider applications for nutrient monitoring in the field.
Materials and methods
Soil and compost analysis. The soil was sampled from a field in Woburn, Bedfordshire, UK and it
belongs to the Stackyard series, described as a brown earth on sandy colluvium (Road Piece Field,
Catt et al., 1975). The soil pH was 7.33 and contained 1.15 % carbon with available NO3--N and
NH4+-N measured as 3.43 and 1.49 mg.kg-1 respectively. Sodium bicarbonate (pH 8.5) extractable
phosphate was measured as 55.2 mg.kg-1. Inductively coupled plasma atomic emission
spectrometry was used to measure cations following a hot acid digestion for total K+ and ammonium
acetate extraction for ‘available’ K+. Soil total and available K+ was 2148 and 132.2 mg.kg-1
respectively. The water holding capacity of an oven dried soil sample was 43 ml 100 g-1.
The compost used was obtained from Petersfield Products (Leicester, UK) and contains 75%
medium grade peat (supplemented with a wetting agent Ultrawet, Vitax Coalville, UK at 200 ml.m-3),
12% heat sterilised loam (<8 mm particle size), 3% medium grade vermiculite and 10% grit (<5 mm
particle size, lime free). The compost was supplemented with two types of fertiliser: a slow release
(3-4 months) 3.5 kg.m-3 Osmocote extract (Scotts Professional, Ipswich, UK), and 0.5 kg.m-3 PG
mix (Yara UK Ltd. Immingham, UK) quick release. The compost mix was finally amended with lime
to pH 5.5 to 6. The nutrient content of the compost for NO3--N and NH4+-N was 72.4 and 112 mg.kg -1
respectively; but the calculated total additional N available from the slow release fertiliser as NO3-
-N and -NH4+-N was 700 and 784 mg.kg-1 respectively. Sodium bicarbonate (pH 8.5) extractable
phosphate was in the range 20 to 723 mg.kg-1 with an average of 361 mg.kg-1. For compost the
amount of K+ added was 196.6 mg.kg-1, but an additional further total of 842 mg.kg-1 was available
in the slow release fertiliser. The water holding capacity of an oven dried sample of the compost
35
Plant materials. Barley seeds (Hordeum vulgare cv. Klaxon) were germinated for 2-3 days in a 10
cm Petri dish on paper towel soaked in 0.2 mM CaSO4 solution. These pre-germinated seedlings
were then transferred to a soil plastic bag system. These plastic growth pouches (Mega
International, Minneapolis, USA) were 145 x 155 mm in size and were made from gas permeable
transparent plastic containing a brown paper lining that is folded at the top to support the
germinated seed (Fig. 1). The barley seedlings were then grown for a further 4 to 7 days in these
bags that were filled with 200 g of soil or 100 g of compost also at 20˚C, 16 h daylength as
described previously (Walker et al., 1996). The soil or compost used was previously air dried and
50 mL of distilled water was added to the pouch after filling before seedling transfer. These
soil-filled pouches were covered with black plastic sheeting and placed in an upright position on a rack
that enabled the leaf to emerge into the light. These racks containing the vertical pouches were
placed in controlled environment cabinet until the seedlings were used for microelectrode
measurements. Plant tissue analysis for K+ was preformed as described previously (Walker et al.,
1996).
A.
[image:5.595.126.471.468.642.2]B
Fig. 1. Barley seedlings growing in soil pouches. A. View of 145 x 155 mm seedling growth pouch.
36
Microelectrode measurements. Double-barrelled glass microcapillary ion-selective microelectrodes
were made in the manner described previously for intracellular measurements (Miller and Zhen,
1991). These glass microelectrodes had fine tips of about 1 µm diameter and they were filled as
described previously using sensor cocktails for either potassium (Walker et al., 1996) or NO3- (Miller
and Zhen, 1991). A salt bridge for ground contact was constructed as described previously using
PVC tubing and agar as described previously (Miller and Zhen, 1991) but for K+ measurements
NaCl and not KCl was used for the agar backfilling solution. Applying the same criteria used for
intracellular recordings, the microelectrode calibration curves were compared before and after the
measurements and they were rejected when these values were not identical in the range reported.
For microelectrode measurements the soil pouches containing the seedling were placed
horizontally on the stage of a microscope and light was provided by a fibre optic source as
described previously (Cookson et al., 2005). A 5 mm thick Plexiglas sheet of the same size had
been previously placed under the soil-filled pouch on the microscope stage to support the whole
area during the measurements. Roots were visible in the soil and for microelectrode access at
specific locations a small hole (approximately 3 x 2 mm) was cut in the transparent plastic using a
scalpel. After a measurement the cut section was covered with a small piece of plastic tape before
a new location was chosen. For measurements along the surface of a root the ion-selective
microelectrode tip was repositioned for up to three measurements before recalibration was
performed. The microelectrode tip was placed in various locations with the salt bridge located
always less than 1 cm away. Preliminary measurements showed that repositioning of the salt bridge
to various different distances could alter the voltage reported by the reference barrel of the
ion-selective microelectrode. Therefore the reference barrel of the double-barrelled electrode, that
would be used to report the cell membrane potential during intracellular measurements, was used
ion-37
selective barrel in the soil (Miller and Wells, 2006) before using the calibration curve to calculate the
ion activity.
B = E
mA - B = a
iB
A
1
2
5
7
3
6
7
8
4
9
V
[image:7.595.171.559.178.539.2]7
Fig. 2. Diagrammatic representation of the arrangement for a double-barreled ion-selective
microelectrode to make measurements in the rhizosphere and soil around seedling roots. 1-
Silver/silver chloride, 2- Half-cell (electrode holder), 3- Tubing electrode, 4- 200 mM KCl or NaCl
(for K+ electrodes), 5- Agar salt bridge, 6- Silver wire, 7- 200 mM KCl, 8- Ion-selective membrane, 9- barley root A- Reference B- Ion-selective barrel C. electrometer.
Results
Figure 2 shows the experimental arrangement for measuring nutrient availability in the rhizosphere.
38
activity at various different locations were made using potassium and NO3
--selective
microelectrodes.
[image:8.595.156.556.158.478.2]
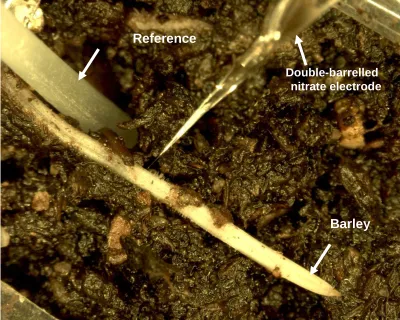
Fig 3. View under microscope of NO3
--selective microelectrode tip and agar salt bridge reference
alongside a barley root tip growing in soil (magnification x20).
Measurements were made on surface of the root and these were compared at various distances
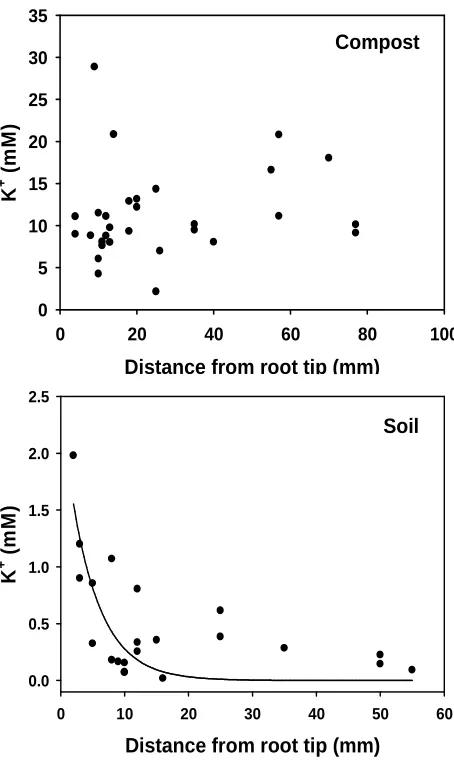
along the root moving from the tip. Figure 4 shows K+ -selective microelectrode data for barley roots
growing in compost (Fig. 4 upper) and soil (Fig. 4 lower). All the measurements in compost were
higher than those obtained in soil. The average of all the measurements gave a mean K+ activity for
roots of 11.3 ± 5.4 mM (n= 30) in compost and 0.5 ± 0.5 mM (n= 21) in soil. However, in soil the
measurements provided some evidence for a general depletion of K+ in the rhizosphere moving
away from the root tip (Fig. 4 lower). An exponential relationship could be fitted through this data
Reference
electrode
Barley
root
39
supporting this idea and a fitted line is shown (Fig 4 lower). Plant tissue analysis is frequently used
as a measure of crop nutrient status so we measured and compared the K+ concentration of leaf
tissue taken from the barley seedlings at the end of the measurements. We measured a 3-fold
higher tissue K+ concentration in the leaves of seedlings growing on compost when compared with
those in soil. The mean values in mmol.g-1 dry weight with the standard deviation for seedlings in
compost was 1.3 and in soil was 0.6 ± 0.2 mmol/g dry weight (n=4).
[image:9.595.95.322.246.632.2]
Fig. 4. Distribution of K+-selective microelectrode measurements behind the root tip for barley
seedlings growing in two different substrates. Upper. compost (top) Lower. Woburn soil (bottom).
The decaying exponential line fitted through the Woburn soil data is y = 2.38e-0.22X (Kolmogorov-Smirnov statistic = 0.164, significance level = 0.59).
Compost
Distance from root tip (mm)
0 20 40 60 80 100
K
+ (
m
M
)
0 5 10 15 20 25 30 35
Soil
Distance from root tip (mm)
0 10 20 30 40 50 60
K
+ (
m
M
)
40
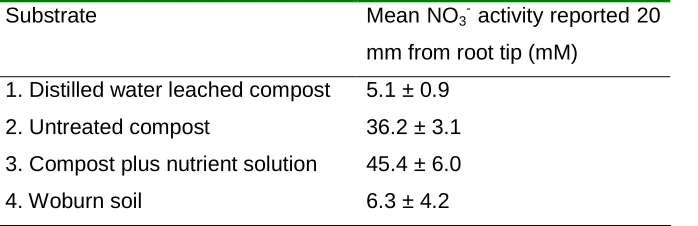
We also investigated the range of NO3
activities that could be measured at the root surface.
For these measurements the compost was given two different additional treatments. Firstly,
nutrients were leached from the compost by four washes with distilled water over 2 days. Secondly,
the compost was watered with a full standard nutrient solution containing 10 mM NO3- (Zhen et al.,
1991) and not with distilled water. Nitrate microelectrode measurements were made at the root
surface 20 mm from the tip of the primary root and the mean value obtained in each substrate in
[image:10.595.85.434.340.453.2]shown in Table 1.
Table 1 Nitrate-microelectrode measurements at the root surface of barley seedlings growing in soil
and compost. Mean ± SD for n=20
Substrate Mean NO3
activity reported 20
mm from root tip (mM)
1. Distilled water leached compost 5.1 ± 0.9
2. Untreated compost 36.2 ± 3.1
3. Compost plus nutrient solution 45.4 ± 6.0
4. Woburn soil 6.3 ± 4.2
All the NO3
measurements were in the mM activity range, but the values for roots growing in soil
and leached compost were significantly lower than those obtained for the other two treatments. For
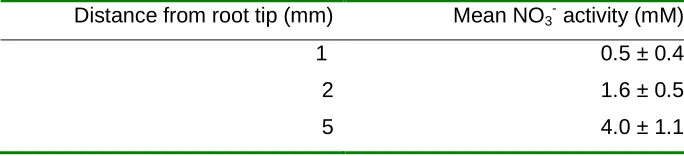
roots growing in the leached compost additional measurements were made at the root tip and these
measurements showed significantly lower NO3
activities in this region (Table 2). The mean NO3
-activity 1 mm from the root tip was 0.5 mM and this was an order of magnitude lower than the value
obtained alongside the more mature region of the root. These measurements show that the
steady-state NO3
concentration in the rhizosphere can be quite different over distances of a few
41
Table 2 Nitrate-selective microelectrode measurements at different distances behind the root tip of
a barley seedling growing in water-leached compost. Mean ± SD for n=4
Distance from root tip (mm) Mean NO3- activity (mM)
1 0.5 ± 0.4
2 1.6 ± 0.5
5 4.0 ± 1.1
Discussion
Both K+ and NO3
-selective microelectrodes were successfully used to measure the activities of
these ions at the surface of barley roots growing in soil and compost. These two different types of
substrate were chosen to provide large differences in nutrient availability. A nutrient rich compost
was compared with and a sandy poor soil with no added fertiliser. Using the soil analysis
information and water content (see Materials and Methods) we calculate the extractable K+ and
NO3
concentrations as 13 mM amd 1mM, respectively. These K+ values are 10 fold greater than
the concentrations reported by the microelectrodes near the root tip (see Fig 4) but they represent
the concentrations in the soil at the start of the experiment. For NO3
a higher concentration of 6 mM
was actually measured 20 mm behind the root tip (Table 1). These values may reflect the relative
mobility of nitrate in the soil as transpiration by the barley seedling is likely to draw water to the root
surface. Furthermore, nitrification of ammonium will tend to increase NO3- availability at the root
surface. For the compost the concentrations of both K+ and NO3- were higher. However, half the
volume was used (see Materials and Methods) and the slow release fertiliser component makes it
very difficult to predict nutrient availability accurately. Using the figures for the quick release fertiliser
we calculate the K+ and NO3
concentrations to be 10.1 mM amd 10.3 mM, respectively. These
compost values for K+ are similar to those measured with microelectrodes (Fig. 4) but as found for
soil, the NO3
concentrations at the root surface are higher (Table 1) than those calculated using the
42
seedlings growing in leached compost showed lower NO3
availability than the calculated figure
(see Tables 1 and 2). Furthermore, adding more nutrients increased the NO3
activity reported at
the root surface by the microelectrodes (Table 1).
The microelectrode measurements provided some evidence for gradients in nutrient
availability along the surface of roots growing in these solid substrates. Interestingly, the apparent
gradients for K+ and NO3- behind the root tip are in opposite directions but note that the scales are
different. We cannot explain why these gradients are different except to comment that this may
reflect root developmental differences and this requires further investigation. The results suggest
that experiments involving roots grown in hydroponics or on agar Petri dishes may not completely
reflect what happens in the rhizosphere environment .
For K+, there was some evidence for a relationship between the ion activity and the distance
of measurement from the root tip but this was only seen for seedlings growing in soil (Fig 4B).
These results suggest that under sub-optimal K+ supply a depletion zone may develop along the
root with the higher concentrations available at the root tip. The compost supplies very high
concentrations of K+ and this is reflected by the ‘luxury’ leaf tissue accumulations of the nutrient.
The mean tissue K+ concentrations were 1.3 mM/g dry weight in compost and 0.6 mM/g dry weight
in Woburn soil and the ratio is 2.3 i.e. the K concentration is 2.3 times higher than in Woburn soil.
Ion-selective microelectrode measurements of the soil K+ activity gave a 22 fold greater availability
in the compost when compared with the soil and this ratio is much larger than the leaf tissue
differences that were obtained. However, the barley seedlings were only grown for 7 days in the
pouches in these experiments. During the early growth stages the seed reserves of potassium are
important and these may lessen the effects of the large differences in soil available K+ between the
two substrates. Furthermore, the results are complicated by the fact that the mean leaf biomass
was almost two-fold greater in seedlings growing in compost when compared with those in soil
43
and error to yield optimal growth. The microelectrode measurements suggest that roots in compost
will have an optimised supply in the range that is given in hydroponic experiments. By contrast, in
soil the K+ supply is sub-optimal resulting in decreased growth by the barley seedlings and lower
leaf tissue concentrations. Only under this sub-optimal supply does a pattern of depletion appear
along the root length (Fig 4B). Such an uneven distribution of K+ supply is unlikely to be found in
hydroponically grown roots and this may have important consequences for attempts to use solution
culture to simulate the soil environment. For example, the pattern of gene expression of K+
transporters along the root may be very different and this could a significant factor in the tolerance
of drought, K+ deficiency (Walker et al., 1998) and NaCl toxicity (Carden et al., 2003).
In hydroponics it has been shown that the resting membrane potential of cells is very
dependent on the external concentration of K+ (Pitman et al., 1971; Hirsch et al., 1998). We know
from functional analysis of transporter proteins that the membrane potential is an important
parameter for regulating nutrient uptake. For example, the membrane potential not only provides
the electrical energy for nutrient uptake, but can also modify the affinity (Km) of a transporter protein
for an ion (Tong et al., 2005). Even though the resting membrane potential is negative, this is true
for both cations like K+ and anions, such as NO3
as the ion is co-transported with two protons
(Miller et al., 2007). Therefore the localised depletion of K+ along the root length may also alter
membrane potential and thereby influence the uptake of other nutrients such as NO3
from the soil.
The physiological characterisation of K+ uptake by roots has identified two mechanisms of
uptake each operating in different external concentrations (Maathuis and Sanders, 1996). Low
affinity K+ uptake activates at relatively high external K+ levels in the millimolar range and is
'passive' i.e. down the electrochemical gradient for potassium. High affinity K+ uptake from
micromolar external K+ levels is coupled to H+ transport. Measurements of root NO3- uptake have
led to the conclusion that plants have developed three types of transport system to cope with the
variations in NO3- concentrations in soils (Crawford and Glass, 1998). Two types of saturable high
affinity transport system (HATS) are able to take up NO3
44
1 mM). The constitutive system (cHATS) is available even when plants have not been previously
supplied with NO3
-. The inducible system (iHATS) is stimulated by NO3
in the external medium.
Both types of HATS are, like high affinity K+ uptake, coupled to H+ transport. The low affinity
transport system (LATS) displays linear kinetics and its contribution to NO3- uptake becomes
significant at external NO3- concentrations above 1 mM (Crawford and Glass, 1998). The
microelectrode measurements reported here suggest that in soil both mechanisms for transport of
K+ are necessary but in compost only passive uptake is required. For NO3- in both soil and compost
although the concentrations available fall in the LATS range both systems may contribute to uptake
by roots. The lowest concentration of NO3- was measured close to the root tips in leached compost
(Table 2), and at 0.5 mM the HATS uptake system is important. The microelectrode measurements
of nutrient pools on the root surface suggest that the relative importance of the different uptake
systems for K+ and NO3
may vary along the length of the root. The measurements in Table 2 show
that the steady-state NO3
activities in the rhizosphere can be quite different over distances of a few
centimetres. This local heterogeneity may be created by the root itself and to address this question
in more detail measurements in root-free bulk soil are needed to provide a comparison.
Ion-selective microelectrodes have been used to report pH and nutrient availability in the
bulk soil (Brouder et al., 2003; Clark et al., 2005). Recently design improvements have improved
the lifetime and stability of ion-selective microelectrodes. For example, the ion-selective sensor
molecules can be covalently bound into the polymer matrix of the sensor membrane to prevent
diffusion of the components into the soil (e.g. Qin et al., 2003; Puntener et al., 2004). A more
detailed comparison of this method with existing methods is required to evaluate the usefulness of
the electrode measurements. For example, more measurements of soil heterogeneity are needed.
Although soil electrode measurements provide an important biologically relevant direct measure of
nutrient ion activity in soil they are complicated by changes in soil water content. Measurements of
nutrient concentration depend on the soil moisture content and it may be necessary to monitor both
45 Conclusions
Ion-selective electrodes offer a new approach to measure soil nutrient availability. The method
provides a measure of the nutrient concentrations dissolved in the soil water and available to plant
roots and is therefore dependent on the soil water content. The electrode output provides a
measurement that is equivalent to the nutrient concentrations supplied in hydroponic culture
solutions and therefore provides a direct comparison between the conditions in these two very
different root environments.
Acknowledgements
We wish to thank Paul Dennis for the Woburn soil sample, Wendy Gregory for the soil analysis and
the University of Poitiers, France for funding JB. Rothamsted Research is grant-aided by the
Biotechnology and Biological Sciences Research Council (BBSRC) of the UK.
References
Axelrod S, Greidinger D 1979 Phosphate solubility test – interference of some accessory minerals. .
Sci. Food Agric. 30, 153-157
Brouder SM, Thom M, Adamchuck VI and Morgan MT 2003 Potential uses of ion-selective
potassium electrodes in soil fertility management. Comm. Soil Sci. Plant Anal. 34, 2699-2726.
Carden DE, Walker DJ, Flowers TJ and Miller AJ 2003 Single-cell measurements of the
contributions of cytosolic Na+ and K+ to salt tolerance. Plant Physiol. 131, 676-683.
46
Catt JA, King DW and Weir AH 1975 The soils of Woburn Experimental Farm. I. Great Hill, Road
Piece and Butt Close. In Rothamsted Report (Harpenden: Lawes Agricultural Trust,
Rothamsted Research), Part 2, pp5-28.
Clark LJ, Gowing DJG, Lark RM, Leeds-Harrison PB, Miller AJ, D.M. Wells DM, Whalley WR and
Whitmore AP 2005 Measurement of soil conditions for crop growth: a review. J. Agric. Sci.
143, 347-358.
Cookson SJ, WilliamsLE and Miller AJ 2005 Light-dark changes in cytosolic nitrate pools depend
on nitrate reductase activity in Arabidopsis leaf cells. Plant Physiol 138, 1097-1105.
Crawford N, Glass ADM 1998 Molecular and physiological aspects of nitrate uptake in plants.
Trends Plant Sci. 3, 389-395.
Djurhuus J, Jacobsen, OH (1995) Comparison of ceramic suction cups and KCl extraction for the
determination of nitrate in soil. Eur. J. Soil. Sci. 46, 387-395.
Hirsch R, Lewis B, Spalding E and Sussman, M (1998) A role for the AKT1 potassium channel in
plant nutrition. Science 280, 918-921.
Hoagland DR, Arnon DI 1950 The water culture method for growing plants without soil. California
Agricultural Experiment Station Circular 347, 1-32.
Maathuis FJM, Sanders D 1996 Mechanisms of potassium absorption by higher plant roots.
47
Mehlich A 1984 Mehlich-3 soil test extractant – a modification of Mehlich-2 extractant. Comm Soil
Sci Plant Anal 15, 1409-1416.
Miller AJ 1995 Ion-selective microelectrodes for measurement of intracellular ion concentrations. Meth.
Plant Cell Biol. 49, 273-289.
Miller AJ, Zhen R-G 1991 Measurement of intracellular nitrate concentration in Chara using
nitrate-selective microelectrodes. Planta 184, 47-52.
Miller AJ, Wells DM 2006 Electrochemical methods and measuring transmembrane ion gradients. In:
Plant electrophysiology theory and methods. Volkov AG (ed.) pp. 15-34. Springer, Dordrecht.
Miller AJ, Fan X, Orsel M, Smith SJ and Wells DM (2007) Nitrate transport and signalling. J. Exp.
Bot. (published online).
Nichol SA, Silk WK 2001 Empirical evidence of a convection-diffusion model for pH patterns in the
rhizospheres of root tips. Plant Cell Environ. 24, 967-974.
Olsen SR, Watanabe FS, Cosper HR, Larson WE and Nelson LB 1954 Residual phosphorus
availability in long-time rotations on calcareous soils. Soil Sci. 78, 141-151.
Pitman M, Mertz SJ, Graves J, Pierce W and Higinbotham N 1971 Electrical potential differences in
cells of barley roots and their relation to ion uptake. Plant Physiol. 47, 76-80.
Poile GJ, Ring SM, Conyers MK and Slattery WJ 1990 The influence of centrifuging on phosphorus
48
Puntener M, Vigassy T, Baier E, Ceresa A and Pretsch E 2004 Improving the lower detection limit
of potentiometric sensors by covalently binding the ionophore to a polymer backbone. Anal.
Chim. Acta 503, 187-194.
Quigley MN, Reid WS 1995 Comparison of a combination pH electrode and field effect transistor
electrode for the determination of soil pH and lime requirement. Commun. Soil Sci. Plant
Anal. 26, 3371-3383.
Qin Y, Peper S, Radu A, Ceresa A and Bakker E 2003 Plasticizer-free polymer containing a
covalently immobilized Ca2+-selective ionophore for potentiometric and optical sensors.
Anal. Chem. 75, 3038-3045.
Shen J, Hoffland E 2007 In situ sampling of small volumes of soil solution using modified
micro-suction cups. Plant Soil 292, 161-169.
Tong Y, Zhou J-J, Li Z and Miller AJ 2005 A two component nitrate transport system in barley. Plant
J. 41, 442-450.
Wang ZY, Kelly JM and Kovar JL 2005 Depletion of macronutrients from the rhizosphere soil
solution by juvenile corn, cottonwood and switchgrass plants. Plant Soil 270, 213-221.
Walker DJ, Black CR and Miller AJ 1998 The role of cytosolic K+ and pH in the growth of barley roots.
Plant Physiol. 118, 957-964.
49
Walker DJ, Leigh RA and Miller AJ 1996 Potassium homeostasis in vacuolate plant cells. Proc. Natl.
Acad. Sci. USA 93, 10510-10514.
Zhen R-G, Koyro H-W, Leigh RA, Tomos AD and Miller AJ 1991 Compartmental nitrate concentrations
in barley root cells measured with nitrate-selective microelectrodes and by single-cell sap