0 INTRODUCTION
Cooling towers remain widely used in industry for cooling circulating water [1] to [3]. In a conventional cooling tower, fill material acts as the media of heat and mass transfer, by means of which the waste heat is rejected from the system. The effect of the fill is to distribute the water stream and provide a larger surface area for contact between the air and the water. However, fouling of cooling tower fill is one of the most important factors affecting its thermal performance as it reduces cooling tower’s efficiency and capability. In a conventional cooling tower, due to salt deposition on the packing and subsequent airflow block, cooling performance of the tower declines after a period of operation time [4] to [5]. On the other hand, the existence of the fill strongly increases the draught drag, which is the main constituent of power consumption. Eliminating the fill leaves the tower completely empty which is of far-reaching significance in cooling turbid water with high temperature [6]. The application of packed cooling towers to industry is not practical due to salt deposition on the packing and subsequent blockage.
Studies of shower cooling tower (SCT) have been reported sporadically over the years. Givoni developed a kind of SCT used for cooling buildings in 1995 [7] to [8], which consists of an open shaft with showers at the top and a collecting pond at the bottom. A pond at the bottom of the shaft collects the sprayed water for recirculation by a small pump. Givoni introduced the system and performed a test to analyze thermal performance. His students tested and compared the performances of this system in three very different climates in another paper. However, they didn’t give any theoretical analysis to assist the system. In China, SCT attracts many investigators’ attention and is becoming a research hotspot. However, there are no
papers presenting a detailed analysis of the cooling characteristics of an SCT.
Given the present state of research, no systematic theory for studying SCT is available. Most studies are focused on experiments, which deal with many parameters. So perpetual modifications in a great deal of experiments are needed to finalize the results [9]. Furthermore, the investigators come up against variour problems of technology and theory in the experimental investigation. The first part includes the movement mechanism of the droplets and the matching of various parameters. In order to solve this problem, the researchers need to carry out large-scale system experiments, which consume a lot of manpower and material resources. Moreover, the flexibility is worse when different experimental results are used to analyze the same problem, because the experimental results cannot conform to the diversity of the environment. The other part includes the creation of a mathematical model for SCT. The first part can be solved by solving the second part. Therefore it is important to establish a reasonable mathematical model of heat and mass transfer for the process of cooling hot water in the SCT, because the results of the numerical simulation can then guide the experimental research and theoretical analysis.
However, the process of heat and mass transfer between the air and the water in the tower is very complicated. The influence factors include the interior structure, the direction and amount of spraying water, environmental factors, the air mass flow rate, wind velocity, the mass flow rate and temperature of inlet water and so on. The cooling performance has a complicated non-linear relationship with these factors and it is difficult to establish perfect mathematical model for a SCT. The standard method for establishing a model can identify some quantitative relationships to show the heat and mass performance, but there are
Exergy Based Performance Analysis of a Shower Cooling Tower
Qi, X. – Liu, Y. – Liu, Z.
Xiaoni Qi1 – Yongqi Liu1,* – Zhenyan Liu2
1 Shandong University of Technology, College of Traffic and Vehicle Engineering, China 2 School of Mechanical and Power Engineering, Shanghai JiaoTong University, China
The present study provides a descriptive mathematical model of energy and exergy for a shower cooling tower (SCT). The model is used to predict the variation in temperature and exergy along the tower length. The validity of the model for predicting variations in gas and liquid characteristics along the tower length was examined against some operating data measured in a cooling tower company. The results show that the exergy of water decreases as tower height increases. The distribution of the exergy loss is high at the bottom and gradually decreases moving up to the top of the tower. Moreover, 1.50 m/s air velocity results in less exergy destruction. With a decrease in the size of the water droplets, the fluids carrying energy have more opportunities for mass and energy transfers.
too many assumptions, the process is complicated, and the precision is lower.
Exergy is the maximum work potential that can be obtained from a form of energy [10] and [11]. Exergy analysis is a useful method to complement, but not to replace, energy analysis. Exergy analysis yields useful results because it deals with irreversibility minimization or maximum exergy delivery. Exergy analysis can indicate the possibilities for thermodynamic improvement of the process under consideration. Exergy analysis has proven to be a powerful tool in thermodynamic analyses of energy systems. Recently, the concept of exergy has received great attention from scientists, researchers, and engineers, and the exergy concept has been applied to various utility sectors and thermal processes. In general, more meaningful efficiency can be evaluated by using exergy analysis rather than energy analysis, since exergy efficiency is always a measure of the approach to the ideal.
One important feature of exergy analysis for a system that undergoes a psychrometric process, such as in cooling tower operations, is that the total exergy can be split into thermomechanical and chemical components, thereby enabling one to quantify the contribution of each term to the total exergy through the tower. Shukuya and Hammache [12] stated that thermomechanical and chemical exergy play important roles in assessing the actual thermodynamic merit of psychrometric process application. Thirapong [13] used exergy analysis to explain the performance of a conventional cooling tower.
Currently, little is known about the applicability of exergy analysis to shower cooling tower studies. In this paper, shower cooling tower performance is predicted by using heat and mass transfer between water and air to drive the solution to steady-state conditions. The second law is used to take account of exergy distributions of water and air in the cooling tower. An investigation of the calculated results can be used to further understand the details of exergy in shower cooling towers.
1 EXPERIMENTAL SETUP - HEAT AND MASS TRANSFER OF AN SCT
In a SCT, for the sake of computational simplification, when deriving governing equations, the following assumptions were made, which have no evident influence on the cooling result:
1) Heat and mass transfer coefficients are constant within the tower. Both the cool air and hot water have constant physical properties.
2) The vapor pressure in the tower is so low that it has little influence on the pressure throughout the entire tower. Therefore the average value of atmospheric pressure is used in the calculation. 3) The water droplets moving in the tower are in the
shape of ball, and the Soter average diameter is assumed to be equivalent to the diameter of the drop.
4) The exterior and interior temperature of the drop is uniform, and thermal resistance for the water drop is negligible.
5) The Lewis factor is equal to 1 [14].
6) Because the whole motion direction of the water droplet is vertical, it is assumed that the water droplet rises or falls vertically in one dimension.
1.1 Mathematical Model at the Water Droplet Level
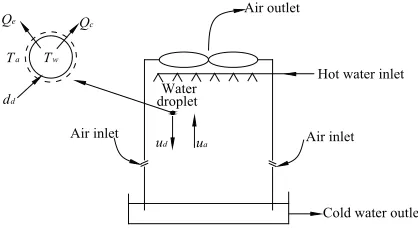
To better investigate the cooling performance of the SCT, it is helpful to first study the heat and mass transfer process at the single water droplet level. This situation is presented schematically in Fig. 1. The motion acceleration, turbulence intensity, internal gyration, and evaporation of the water droplet influence the motion characteristics in SCT. However, in order to describe the motion characteristics of the water droplet in mathematical language, some assumptions concerning the water droplet are made.
As shown in Fig.2, the water droplet is assumed to be spherical and its diameter is small enough so that the temperature of the water droplet can be assumed to be uniform; all water droplets have a uniform diameter and uniform motion tracks; the lesser impact factors such as the possibility of collision or scatteration of the water droplet during the motion process, libration and the nonuniformity of internal flow and temperature distribution and so on are ignored in this investigation.
Cold water outlet Air inlet
Air outlet
Air inlet
Hot water inlet
ud ua
Water Tw
Ta
Qc
Qe
dd droplet
The heat rejected from the water droplets includes convective heat and evaporative heat. The water droplet loses heat to the air at the expense of its internal energy, and an energy balance on a control surface surrounding the water droplet yields:
dU
dtd = −
(
Qdc+Qde), (1)
where:U
d=
m c T
d pw w,
(2)Qdc =h A T Tc d( w− a), (3)
Qde=h A wd d( sw−w ia) v, (4) Combining the above equations gives:
dT dt
h T T h w w i A m
h le i i
w c w a d sw v d
w d
d f masw ma
= − − + − =
= − − +
[ ( ) ( ) ]
[ ( )
ρ
6 (( )( ) ]
. 1−le w −w i cpwρw dd f sw v (5)
The water evaporation rate, associated with mass transfer, is equal to:
dm
dtd =h wd( sw−w Aa) ,d (6) where
h N uc= dλ/dd, (7)
Red =(u u dd+ a) / ,d ν (8)
Pr=µcpa/ ,λ (9)
Nu= +2 0 6. Re Pr1 2/ 1 3/ , (10)
dw dmm N dmm dt m
m h wm uw A dz
a w
a d
d a w
a
d sw a d
d d
= =
= −
=
( ) ( ) . (11)
Please refer to Bosnjakovic [8] for a discussion on the derivation and development of the Lewis factor.
1.2 Force Analysis of Water Droplets
In our previous publication, the force exerted on a single water droplet was analyzed in detail. Only the results are used in this work. In the motion process of a water droplet sprayed from the nozzle, the
forces exerted on the droplet moving with certain velocity include gravity, Gd, air buoyancy, Fd, and air
resistance, Rd. They are expressed as gravity:
Gd =m gd =π ρdd wg
3
6
/ , (12)
buoyancy:
Fd=πdd3ρag/ ,6
(13)
drag:
Rd=πCdρaU dd
2 2/ .8 (14)
According to the motion condition, the drag coefficient, Cd, is expressed as [9]:
Cd =
≤ <
(
)
18 5
1 9169 508 3917
3 5
. / Re ,
. Re . ,
/
transition flow (15)
Cd =
≥
(
)
0 44 508 3917
. ,
Re . , turbulence flow . (16)
The physical definition and Newton’s second law of motion is given as:
ud =dz dt/ , (17)
a du
dt u dudz
d = d = d d. (18)
Combining the two equations given above, we obtain the kinetic equation for water droplets in the SCT as:
ρw d d ρ ρ ρ
w a d a d a d
u du
dz =( − )g−3C (u +u ) /4d .
2 (19)
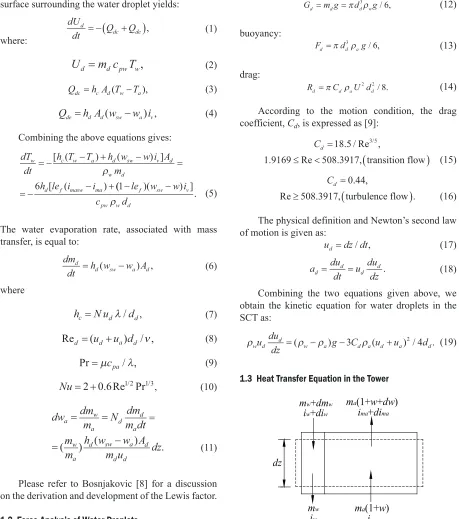
1.3 Heat Transfer Equation in the Tower
dz
mw+dmw
iw+diw
ma(1+w+dw)
ima+dima
mw
iw
ma(1+w)
ima
Fig. 2. Control volume of SCT
dQ dQ dQ= c+ e, (20)
where dQc is the sensible heat between the air and the
water caused by the temperature difference, which can be expressed as:
dQc=h T T dAc( w− a) . (21)
dQe is the evaporative heat caused by the
concentration difference between the saturated vapor around the water droplets and the ambient air which is expressed as:
dQ i h we= v d( sw−w dAa) . (22)
As the water temperature is Tw, the enthalpy of
the water vapor is iv = ifgw0 + cpv Tw , and the enthalpy
of the saturated water vapor is:
imasw=c Tpa w+wiv+(wsw−w i) .v (23) Combining the above two equations yields the following equation:
i
masw=
c T
pa w+
wi
v+
(
w
sw−
w i
) .
v (24)Because the enthalpy of wet air per unit mass of wet air can be expressed as:
ima=c T w ipa a+ (fgw0+c Tpv a). (25)
Subtracting Eq. (25) from Eq. (24) yields:
T T i i w w i
c
w a masw ma sw v
pma
− =( − ) (− − ) . (26)
Substituting Eq. (26) into Eq. (20) yields:
dQ h
c i i h
h
c i w w dA
pma masw ma d pma v sw
= − + − −
( ) ( ) ( ) .(27)
Supposing lef as 1 yields:
di dQ
m h
m i i dA
ma a
d
a masw ma
= = ( − ) . (28)
In the cooling tower without fill:
di d
dQ m
m m
h
u d i i
ma
z a
w a
d
w d d masw ma
= =( ) 6 ( − ).
ρ (29)
According to reference [15], when the relative velocity of the liquid droplet to the air stream is not
high (Re < 10), it can be regarded as an evaporation process for a static drop in the air; when the relative velocity of the liquid droplet to the airstream is higher (10 < Re < 1800), heat and mass transfer is promoted. Under this latter condition we can use a some of the heat and mass transfer equations given in previous references. After comparing the application range, the Frossling equations, whose application range is 10 < Re < 1800, were adopted.
As Ta is between 0 and 100 °C, let Sc = 0.63
and substitute this value into Eq. (11) to obtain the following:
h D
d Sc
d a c
d
d d
=ρ ( + . Re / / ),
1 0 276 1 2 1 3 (30)
Dc T
a a p
=0 0805 +273 × ×
273 9 8 10
1 8 4
.
( ).
. . (31)
1.4 Numerical Solution
In order to study the temperature and heat transfer of the water droplet, we divided the whole motion
process z into N finite sections with thickness dz.
Section n is filled with water droplets that enter the
section at a temperature of Tw,n and exit at Tw,n+1.
Consequently, the velocity, retention time, height at the outlet of the section n: uw,n+1, tn+1 and zn+1,
respectively differ from the inlet values- uw,n, tn and
zn, respectively. The Runge-Kutta method is applied to
solve Eqs. (5), (11), (19), (30) and (31), thus allowing us to obtain the temperature of the droplets in each differential section and the outlet water temperature.
2 EXERGY CALCULATION
According to recent definitions, the exergy of a system may be classified as having thermomechanical and chemical exergies. The former may be divided into three types: physical, kinetic, and potential exergies. Physical exergy is the maximum amount of obtainable work when the stream is brought, by a reversible process, from its initial state at T and p to a state at T0
and p0 that is in thermal and mechanical equilibrium
with the environment. The equilibrium state is referred to as the restricted dead state [10]. Most of the time, variations in potential and kinetic exergies can be neglected and hence they are not considered in exergy analysis.
chemical exergy of a material stream is the maximum achievable work needed to go from one restricted dead state to another dead state. It is said that the system is at dead state when its pressure, temperature, composition, velocity, or elevation are equal to the corresponding environment parameters.
The total exergy content of a material stream is calculated by summing up these above-mentioned exergies. The specific exergy in the psychrometric process – such as in the cooling tower operating mechanism, without the effect of kinetic and potential energy, in a steady state – can thus be generally represented as:
ex ex= th+exme+exch. (32)
The total exergy consists of three parts:
thermalmechanical exergy, exth, mechanical exergy,
exme,and chemical exergy, exch. The three items are
represented as:
ex c c T T
T
T T
th=( pa+ω pv) (0 − −ln ),
0 0
1 (33)
ex R T p
p
me= +(1 1 608. ) a 0ln ,
0
ω (34)
exch =R Ta 0[(1 1 608+ . ω)ln1 1 6081 1 608++.. ωω0s. (35)
So the total exergy can be written as:
X m c c T T T T
T
R T p
p R T
air a pa pv
a
a
= + − − +
+ + +
+
[( )( ln )
( . ) ln
ω
ω
0 0 0
0 0
1 1 608
00 0
0
0
1 1 608 1 1 608
1 1 608 1 608
( . )ln .
.
. ln ].
+ +
+ +
+
ω ω
ω
ω ω
ω
s
a
s
R T (36)
The rate of exergy destruction I, which is the loss
in potential of air to recover the exergy supplied by the water, can be determined from the control-volume exergy balance equation. This equation is applied under steady state conditions and undergoes an adiabatic process with no work delivered. Assuming that the air-water thermodynamics properties are known at discrete points along the tower height, the exergy destruction for each incremental tower height
dz is:
[ ]
[
, ( ) , ( )
,
X X
X
w z j air z j
w z
+ + =
=
1 Total exergy entering
(( )j +Xair z j, (+1)]+ I Total exergy leaving Destroyed
eexergy
. (37)
After rearrangement, the exergy destruction for
the discrete height dH will be:
I=[Xw z j, (+1)−Xw z j, ( )] [+ Xair z j, ( )−Xair z j, ( +1)]. (38)
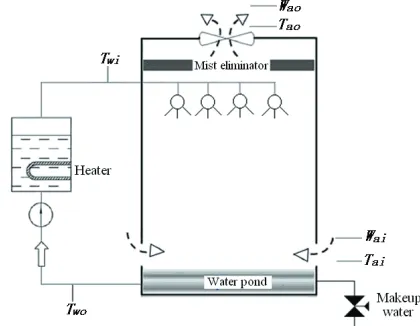
3 EXPERIMENTAL PROCEDURE
A schematic diagram of an experimental apparatus carrying out this study is shown in Fig. 1. The tested cooling tower is a mechanical draft-counterflow type where the height of the nozzle can be adjusted from 5
to 8 m, the cross sectional area is 10.87 m2. Hot water
is pumped from the storage tank, which is heated by heaters and controlled by temperature controller, and enters the cooling tower at the top. The water flow rate is adjusted by the flow control valve installed next to the pump where its value is read by flow meter. Cooled water exits the tower at the bottom and recirculates to the storage tank throughout the duration of the test. Moist air is brought in by a fan and enters from the bottom, flowing past the tower, and is finally discharged into the atmosphere at the top of the tower.
Fig. 3. Schematic diagram of experimental unit
are measured by thermocouples. Before doing the experiment, water that was collected in the storage tank was heated to the desired temperature. The flow control valve was adjusted and the water flow rate was measured. Air velocity was measured at the air inlet. During the experiment, water was uniformly distributed from nozzles, while air was blown upwards. Water temperatures and air conditions were measured after steady state operating conditions were obtained. The diameter of the droplets were measured using an intensified high-speed camera.
4 RESULTS AND DISCUSSIONS
4.1 Model Verification
The presented model was validated by using plant data obtained from Jiangsu Seagull Cooling Tower Co., ltd. in China. Table 1 represents the operating conditions and the characteristics of working fluids through the shower cooling tower. The comparative results are the outlet water temperature. It should be noted that the error between the predicted and experimental values are within 10%. Thus, this model can be used for predicting the conditions of water and air in shower cooling towers.
Table 1. Comparison of results of the heat and mass transfer model and the experiment data
Nozzle height [m] 8 6 7
Droplet diameter [mm] 1.1 0.8 0.8
Initial velocity [m/s] 4 6 5
Air velocity [m/s] 2 2.5 2.3
Air to water ratio 0.8 0.9 0.9
Dry-bulb temperature of inlet air [°C] 34 33 34 Humidity ratio of inlet air 0.78 0.7 0.68
Inlet water temperature [°C] 50 44 42
Experimental outlet water
temperature[°C] 43.7 37.8 36.2
Computed water temperature based
on heat and mass transfer model [°C] 44.3 38.1 36.7
Reletive error [%] 9.52 3.85 8.67
4.2 Exergy Analysis
Following the validation of the model, it seems appropriate to evaluate some exergic interactions in the SCT. Atmospheric conditions are considered to be at dead state with a dry-bulb temperature of 29 °C, wet-bulb temperature of 21.11 °C, and a pressure of
pt= 100.4 kPa. The cross-sectional area of the tower
is 10.87 m2, and the height of the nozzle is 5 m,
the water mass flowrate is 55.21 m3/h, the air mass
flowrate is 44206 m3/h.
Fig. 4. Temperature profiles of water and air, and humidity ratio profile through the shower cooling tower
Fig. 4 is a plot of the water temperature, the dry-bulb temperature, and the humidity ratio of the air versus height of the tower. The water falls from the top
and its temperature, Tw, decreases continuously as it
approaches the bottom of the tower. This is generally expected in a shower cooling tower because the water loses heat both by convection and evaporation. It is interesting to see that the air, which enters from the bottom of the tower with an initial dry bulb temperature, Tdb, decreases in temperature and then increases before leaving from the top of the tower. This can be explained by the fact that the water, which enters from the top of the tower, when it reaches the lower part, is cooled because of a predominantly evaporative mechanism. In this region, the water
temperature, Tw, is much lower than the entering air
dry bulb temperature, Tdb, however, as we note from
Fig. 3, when the tower height from the top reaches
above 2.9 m, the water temperature is less than Tdb.
This results in heat transfer from the air to the water (i.e. negative convection). The intersection point of the
Tdb and Tw curves indicates no temperature difference.
At this point, there is no convection heat exchange between the water and the air. Furthermore, below this point Tdb is less than Tw, which results in heat transfer
from the water to the air (i.e. positive convection).
Fig. 5 is a plot of water exergy, Xw, and water
temperature, Tw, versus tower height. As in a
Fig. 5. Exergy of water and water temperature profiles through the shower cooling tower
Fig. 6. Effect of tower height on water exergy through the shower cooling tower
The effect of the tower height on the exergy of water through the SCT is shown in Fig. 6. As the tower height increases, the exergy of water decreases because the heat and mass transfer rate from the water to the air is greater. The exergy of water supplied to the air decreases with decreasing height.
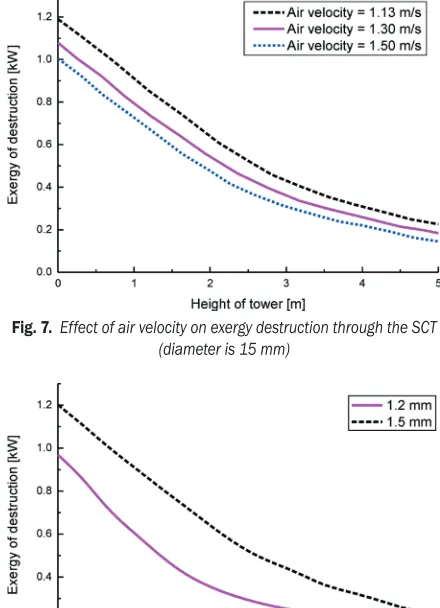
Exergy destruction is represented by the difference between the exergy change of water and the exergy change of air. Fig. 7. shows the exergy destruction along the SCT for three air velocities. It shows that the distribution of the exergy loss is higher at the bottom and gradually decreases towards the top of the tower. Hence, minimum exergy destruction is seen at the top of the tower for each air velocity. Moreover, it shows that 1.50 m/s air velocity resulted in less exergy destruction. This is due to a large transfer from water to air.
The effect of the size of water droplets on exergy destruction through the SCT is shown in Fig. 8. For example, 1.19 kW of exergy destruction is destroyed
when the tower bottom height is changed from 0.00 to 0.56 m. Furthermore, another 0.876 kW of exergy destruction is also destroyed when the tower height is changed from 0.56 to 1.12 m, and so on. These distributions of exergy destruction indicate that these are high at bottom and gradually a low at the top. The minimum value is found at the top. Fig. 8 also shows the effect of water droplet diameter on overall exergy destruction. Obviously, with a decrease in the water droplet diameter, the fluids carrying energy have more opportunities for mass and energy transfers. Highly intensive mass and energy interactions always occur with thermodynamic irreversibilities and entropy production, which result in increasing in exergy destruction.
Fig. 7. Effect of air velocity on exergy destruction through the SCT (diameter is 15 mm)
Fig. 8. Effect of size of water droplets on exergy destruction through the SCT
5 CONCLUSIONS
modeling and simulation results. The method was validated using experimental data. In fact, the irreversibilities of any process destroy some inlet exergies. The results also show that the exergy of water is not completely absorbed by air and a notable portion of the exergy is always destroyed, much more in the bottom sections. The exergy analysis shows that exergy destruction increases with increasing water droplet diameter.
Water exergy, defined as the available energy carried by supplying water, decreases continuously from top to bottom. For the air side, exergy means the available energy of air to recover or utilize that supplied by water. There are two kinds of exergy in air that are due to the exergy of air via convective heat transfer and the exergy of air via evaporative heat transfer. Exergy destruction is high at the bottom and lower at the top. 1.19 kW of exergy destruction is destroyed when the tower bottom height is changed from 0.00 to 0.56 m. Furthermore, another 0.876 kW of exergy destruction is also destroyed when the tower height is changed from 0.56 to 1.12 m, and so on. The distributions of exergy destruction can be used as a guideline for finding the optimal potential for improving cooling tower performance. As water droplets drop to the bottom, the droplets' velocity increases rapidly, which means that the heat and mass transfer process between the water and fresh air is extremely short. Therefore, the useful energy delivered from water to air decreases, that is, the exergy destruction increases. For a shower cooling tower, this is an important constraining factor.
5 ACKNOWLEDGMENTS
This work was supported by the Natural Science Foundation of China under contract No. 51249001 and the Jiangsu Seagull Cooling Tower Company Ltd.
6 NOMENCLATURE
A area [m2]
c specific heat [kJ/(kg·°C)]
Cd drag coefficient on droplet [-]
Dc diffusion coefficient [m2/s]
Fd buoyancy [N]
g gravitational acceleration [m/s2]
Gd gravity [N]
d equivalent diameter [m]
ex specific exergy [kJ/kg]
hc heat transfer coefficient[W/m2·°C]
hd mass transfer coefficient [kg/m2·s]
ifgw0 specific latent heat of water at 0 °C [kJ/kg]
imasw specific enthalpy of saturated air evalutated
at the local bulk water temperature [kJ/kg]
iv specific vaporization heat of water [kJ/kg]
I exergy destruction [kW]
m mass [kg]
i specific enthalpy [kJ/kg]
Lef Lewis factor [-]
Nu Nusselt number
Pr Prantdl number
Q heat transfer rate [W]
Rd drag [N]
Re Reynold number
Sc Schmidt number
Sh Sherwood number
t time [s]
T temperature [°C]
u velocity [m/s]
U internal energy [J]
w humidity ratio of moist air evaluated at Ta [-]
z vertical coordinate [m]
Greek Letters
λ thermal conductivity coefficient [W/m·K]
μ dynamic viscosity coefficient [Pa/s]
ρ density [kg/m3]
Subscripts
a air
c convection
d droplet
db dry bulb
e evaporation
s saturated
v vapor
w water
1 inlet
2 outlet
7 REFERENCES
[1] Dvoršek, M., Hočevar, M. (2011). The influence of
airflow inlet region modifications on the local efficiency of natural draft cooling tower operation. Strojniški vestnik - Journal of Mechanical Engineering, vol. 57, no. 10, p. 750-759, DOI:10.5545/sv-jme.2010.208. [2] Kröger, D.G. (1998). Air-cooled Heat Exchangers and
Cooling Towers, Begell House, New York, p. 50-56. [3] Geoffrey, F.H. (2002). Heat Exchanger Design
Handbook, Begell House, London, p. 137-151.
[4] Shi, L.Q. (2002). Application of the no-padding and atomizing cooling tower to industrial circulating cooling water. Metallurgical Power, vol. 3, p. 56-59. [5] Li, P., Yang, L.Q. (2003). Application of the no-padding
water in steel industry. Shandong Metallurgy, vol. 4, p. 66-68.
[6] Li, H.L. (2003). Investigation and application of the no-padding and atomizing cooling tower. Industrial Water Treatment, vol. 8, p. 56-58.
[7] Satoshi, Y. (1996). Experimental performance of the shower cooling tower in Japan. Renewable Energy, vol. 10, no. 2-3, p. 179-183.
[8] Givoni, B. (1997). Performance of the “shower” cooling tower in different climates. Renewable Energy, vol. 10, no. 2-3, p. 173-178, DOI:10.1016/0960-1481(96)00059-6.
[9] Kotas, T.J. (2006). The Exergy Method of Thermal Plant Analysis. Butterworths, London, p. 223-237. [10] Dovjak, M., Shukuya, M., Krainer, A. (2012). Exergy
analysis of conventional and low exergy systems for heating and cooling of near zero energy buildings.
Strojniški vestnik - Journal of Mechanical Engineering,
vol. 58, no. 7-8, p. 453-461, DOI:10.5545/sv-jme.2011.158.
[11] Moran, M.J. (1982). Availability Analysis: A Guide to Efficient Energy Use. Prentice-Hall, New Jersey, p. 91-108.
[12] Shukuya, M., Hammache, A. (2002). Introduction to the concept of exergy. Low exergy systems for heating and cooling of buildings. IEA ANNEX 37, p. 41-44. [13] Thirapong, M., Wanchai, A., Somchai, W. (2007). An
exergy analysis on the performance of a counterflow wet cooling tower. Applied Thermal Engineering, vol. 27, no. 5-6, p. 910-917, DOI:10.1016/j. applthermaleng.2006.08.012.
[14] Johannes, C.K., Detlev, G.K. (2005). The Lewis factor and its influence on the performance prediction of wet-cooling towers. International Journal of Thermal Sciences, vol. 44, no. 9, p. 879-884, DOI:10.1016/j. ijthermalsci.2005.03.006.