Surface Defect Detection on Power Transmission Belts Using
Laser Profilometry
Bračun, D. - Perdan, B. - Diaci, J.
Drago Bračun1,* - Boštjan Perdan2 - Janez Diaci1
1 University of Ljubljana, Faculty of Mechanical Engineering, Slovenia 2 Veyance Technologies Europe, d.o.o., Slovenia
Quality control in production of the power transmission belts currently relies mostly on visual inspection by skilled workers. They primary inspect belt geometry for defects like small bumps, dents and unformed teeth. Despite the controller experience, the result depends on the person’s mood and general condition. To avoid subjective inspection, an experimental system for automated inspection of the belt geometry is developed. It operates on the basis of the laser triangulation system, capable of acquiring a cloud of points in 3D space representing a complete belt surface. By processing the acquired data cloud, most typical belt defects can be identified and assessed. We demonstrate two different methods of data processing. The first one imitates the established “manual” procedure, where the individual tooth profile is compared to a template specified by a technical documentation. The second method uses a novel approach based on the deviation map. That enables automated analyses of the complete tooth surface (not only profile), identification of 4 typical surface defects and their pass/fail quality assessment.
We found shape of the surface defects sufficiently recognizable in the acquired data cloud, which means that point measurement accuracy of the developed laser triangulation system is sufficient. We demonstrate identification of the typical surface defects. We found that further work is needed to develop pass/fail criteria of the quality assessment to comply with the requirements of the industry.
©2011 Journal of Mechanical Engineering. All rights reserved.
Keywords: three-dimensional shape measurement, laser based active triangulation, laser profilometry, power transmission belts, surface defects, defect detection
0 INTRODUCTION
Efficient integration of all activities from design to manufacture often requires good knowledge of the product properties and management of the manufacturing process. Detection of flaws in the product often results in a decrease in product rejection, higher manufacturing efficiency and improved quality [1]. Assuring quality control is essential for every manufacturing process. Since 100% control is often too expensive, statistical process control (SPC) is recommended. In this case not all of the products are controlled directly, but the process is controlled on the basis of statistical samples. The most common way to procure SPC is the control chart. Many types of control charts have been developed (Shewhart, Cusum, Exponential moving average are presented elsewhere, e.g. in [2]). Their economic design is key to the successful control and minimum quality cost [3].
In the production of the power transmission belts quality control currently relies mostly on visual inspection by skilled workers. They visually inspect the surface of each belt (100% control by a naked eye). Some surface defects are also found by examining the teeth with a hand. Tooth profile of the sample belts is inspected by means of a profile projector and assessed with the help of a template. Although this is done by skilled workers, it is subjective because it depends on the person’s mood and general condition. To rule out subjectivity and allow detection of smaller defects that are difficult to detect by visual inspection alone, a quick and reliable automatic or semi-automatic measuring system is required.
the most important being impact sound made by meshing of the belt and pulleys and the sound made by transverse vibration of the belt that too is influenced by meshing. Belt geometry is defined by the tooling; it also depends on various cure process parameters and is subject to external influences that are sometimes difficult to control (mold damage, dirt on the mold, etc.). All these influences can cause different belt surface defects that need to be detected during the production process.
A wide range of non-destructive testing (NDT) techniques can be used when assuring quality control in the manufacturing process. Fast developing fields of laser technologies supported by advanced signal processing and high-speed computers accelerated the development of several novel non-contact NDT methods that are based on the interaction between the laser pulse and solids or liquids. By analysing the propagation of laser-induced ultrasonic and/or acoustic waves, properties of solids [7], liquids [8] or boundary regions [9] can be investigated. Non-contact measurement of a three-dimensional (3D) body shape gained acceleration with advancing vision systems [10]. In terms of speed and accuracy of measurement, laser triangulation systems exhibit several advantages and have been applied in several industrial applications such as resistance spot welding [11], weld shape inspection [12] and quality assessment of die-castings [13].
Advantages of laser triangulation systems directed us to applying this method to quality control in belt manufacturing process. The main idea is to have measurement system integrated into the belt production line to carry out 100% control of belts by on-line measurement of belt geometry and its assessment. This paper presents an experimental system for automated control of belt geometry. Its use is demonstrated on belt samples with different characteristic surface defects that
using the principle of laser triangulation. The later consists of a digital camera and laser line projector. A laser beam, formed into a narrow laser plane, illuminates the belt surface. A bright line (2) visible on the belt surface is acquired by a camera placed at a specific triangulation angle with respect to the direction of illumination. This arrangement enhances surface topography and enables determination of 3D shape [10]. The result of one measurement is a profile representing cross-section of the laser plane and the illuminated surface of the belt.
In the reported set-up laser profilometer has a digital camera with a monochrome 640 x 480 pixel CCD sensor and IEEE-1394 output. The optics was adjusted to the measuring range of 25 mm along the laser line and 20 mm perpendicular to the measured surface. One measured profile consists of 640 measured points. The profile measurement resolution was 0.04 mm (the distance between measured points in one profile). The 3D coordinates (x, y, Z) of the measured points are calculated by a triangulation model described in [14]. This model assumes a pinhole model of the camera, and treats the focal length of the camera optics separately for direction xc being parallel and yc perpendicular to the measured profile (subscript c denotes camera coordinate system). It is also capable of compensating for systematic measurement errors in optical triangulation originating from the camera optics and light sheet curvature. The set-up was calibrated using a planar checkerboard and verified by measuring the shape of the reference calibration body (v-groved plate) similar to how it is described in [13]. We found measurement precision of a particular point to be 0.035 mm (2σ).
between the speed of operation and the smallest defect we still need to detect and characterize. Experience shows that a resolution of 0.2 mm should suffice.
To measure the next tooth, belt is translated along its length for one tooth pitch length, by using a belt drive to move next tooth into the measuring field. The procedure of tooth scanning and belt translation is then repeated for all the teeth. Measurement of a complete belt with 100 teeth takes approximately 10 minutes.
a new shape profile is acquired. By repeating this procedure, acquired profiles can be set as little as 0.05 mm apart (scanning resolution).
This scanning procedure is carried out with frequency of 80 profiles per second. Measurement of one tooth (belt width 20 mm) takes about 5 seconds and is composed of approximately 400 profiles. For the initial measurements, maximum resolution was used to achieve good surface characterization, however for the inspection purposes a compromise will have to be made
a) b)
Fig.1.Experimental set-up, a) photo of the system: (1) laser profilometer module, (2) laser plane, (3) belt, (4) pulleys, (5) movable cart; b) schematic of the experimental system
a)
b) c)
by means of a weight suspended on a steel wire that is connected to the moveable chart. The belt is running on its back over the pulleys and over the belt support, which prevents belt vibrations and is the base for thickness assessment. In its present form the system is not yet ready for on-line assessment of belts in the production as it was designed for testing purposes and laboratory use only. To implement surface defect inspection procedure into the production, a faster performing laser profile module is required. Since the impact on the production process needs to be minimal, it will have to be integrated into the existing belt length measuring machine that is quite similar in design to our belt drive.
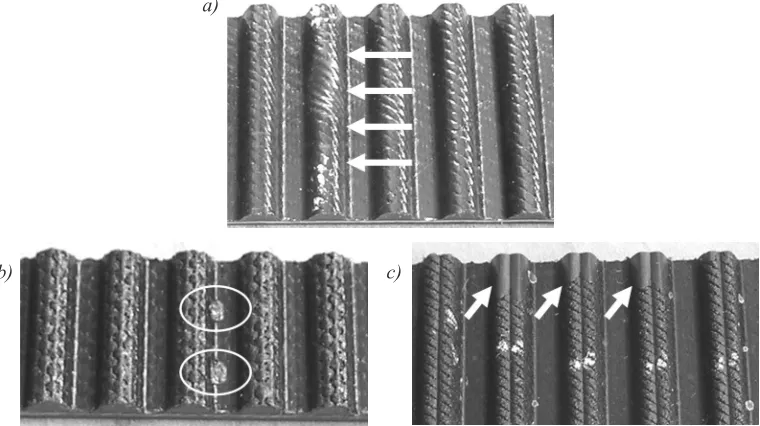
2 ExPERIMENT
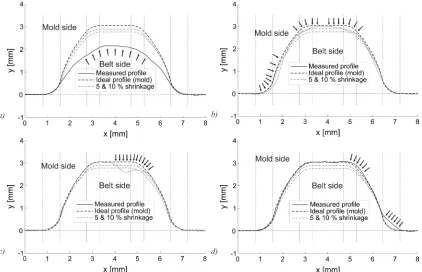
A measuring system can be used to inspect both multi rib and timing belts, however within scope of this paper we will only focus on timing belts, where tooth geometry plays an important role in load transmission. Belt defects can occur both during production and operation. In this case, interest lies primarily in identifying various surface defects that occur in production in order to use the surface defect detection procedure as a part of the quality assurance system. Surface defects that occur on teeth can generally be classified into 4 different categories: poor tooth formation, dented teeth, bumps on the surface and so called open splice defect; a few typical defects are shown in Fig. 2 and their cross section (profiles) depicted by drawings in Fig. 3. These show a comparison of the measured profile with the ideal shape defined by the mold. Profiles with 5 and 10% shrinkage in vertical direction are also added that are used to assess the profile and represent the tolerance range within which the tooth profile should be. Poor tooth formation is shown in Fig. 2a (note 2nd tooth from the left side marked with arrows); a cross section of an extreme example is
jump teeth and is not acceptable. A similar defect is “rounded teeth” depicted in Fig. 3b. These are difficult to spot by visual inspection alone because deviation is much less obvious and an experienced eye is required. In the case of doubt, the profile is checked using an optical projector and a template. This defect is also not acceptable as the possibility of belt jumping teeth is increased, especially at high loads. Dented teeth are caused by dirt that can get between the teeth on the mold and prevent the cover fabric to conform to the surface of the mold (see Fig. 3c). Dents are usually smaller in size and easily detected by visual inspection. They do not harm the performance of the belt as they do not affect the whole tooth width and are mostly of cosmetic nature. Nevertheless, they are not acceptable as they put a bad image to the quality of the product. Bumps on the surface are the opposite of dented teeth and are the consequence of mold damage (dents, etc.). An example is shown in Fig. 2b (marked with two ellipses) and depicted in Fig. 3d. These too are small in size but easy to spot. As there is excess of material on the tooth, this can cause problems with tooth meshing into the sprocket and are not acceptable. They will usually occur in the land area between the teeth as the mold (negative shape) is most likely to get damaged on the top of the teeth. Fig. 2c shows an example of open splice defect where rubber gum penetrated between the mold and the facing fabric (marked with arrows); this can only happen with the end belt and is recognized by a very smooth tooth surface. This defect will only have a small effect on the performance as there is a possibility of uneven local load distribution if the rubber would wear sooner than the fabric, but is not acceptable because of visual appearance of the belt.
rendered in OpenGL. Left image shows a tooth with poor tooth formation defect where we can observe a substantial cross section reduction as we move towards the middle of the tooth. In the right image a tooth with two bumps in the land area is
shown (note two light spots). These are outlined with ellipses for clarity. Lighter spots mean that measured points are above the reference surface, which means that defects are protruding the surface.
a) b)
c) d)
Fig. 3. Typical surface defects’ cross sections, a) poor tooth formation, b) rounded teeth, c) dented teeth, d) bumps on the surface
a) b)
added. The profile is considered acceptable if it falls within this range.
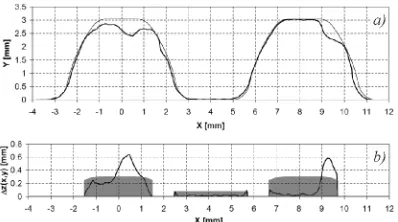
With this method only one profile of the belt at a time is measured. Top diagram in Fig. 5 shows a comparison of a belt profile measured in the middle of the belt (an example of dented teeth) and a template based on the technical drawing. Deviation diagram below shows absolute difference between the two profiles in vertical direction. Shaded areas represent the range within which the profile shape is considered acceptable. Only tooth tip and land area between the teeth are checked because deviation is calculated in a vertical direction, which produces inaccurate results for the tooth flanks. These are also the most likely to have a defect. Belt profile is defined by the negative shape of the mold, which is more likely to get damaged on the top of the teeth, producing a bump in belt’s land area; and since dirt will usually accumulate between the mold’s teeth, dents are formed on the top of belt’s teeth. In the case of tooth tip the outline of shaded area represents the allowed 10% shrinkage in vertical direction. The same approach cannot be used for the land area (allowed shrinkage would equal 0), so the range is defined with a constant that equals maximum allowed tip deviation divided by 4. In land area there are stricter requirements as there is usually an excess of material (a bump) that can interfere with the sprocket during operation which is not acceptable. A lack of material in tooth tip will have much less of an effect on belt performance.
Such a method is very strict because one point out of range is enough for the product to be classified as unacceptable. With this approach do Not all the information about the defect in question can be acquired in this way. This is because only one profile of the tooth in the particular position is measured and the surface defect can easily be missed or measured aside its maximal deviation.
required capable of identifying and evaluating various defects.
The second method is an upgrade of the first one, since the complete 3D shape of the tooth and not only one profile at the specific position on the tooth is analyzed. Our goal in developing the second method was derivation of characteristic parameters (numerical values), which could be used for an automatic defect evaluation and classification and would lead to similar conclusions that today an operator makes using a template and their common sense.
Fig. 5. Comparison of measured profile (thick
line) a) with a template (thin line), b) deviation diagram
by a technical drawing of the belt in question. However, in this case, RS is simply generated from the profile obtained as an average of several profiles measured on a good tooth (without defects). This is primarily intended for initial testing, while further RS will be based on the technical documentation.
When calculating DM, the coordinate system is oriented so that the differences between MS and RS are expressed only in vertical “z” axis
as ΔZ(X,Y), where X and Y are discrete values
representing the coordinates of each point in DM (for clarity written without any indices).
Dark areas of the DM show deviations from RS in a negative direction (in surface) and lighter areas in a positive direction (out of surface). With the example on the left (a) it is clear that it is poor tooth formation because in the middle of the tooth the whole profile is below the RS. Many slanted stripes across the tooth that represent the cover fabric texture can also be noticed. On the right (b) there is DM of the tooth with two bumps, which are observed as two lighter spots located in the land area of the tooth. They are above the RS (positive direction) and hence lighter colour.
Surface defect identification and tooth quality assessment are done by further analysis of DM. By processing the DM, like calculating deviations volume, area, average height and maximum height, surface defects can be identified and evaluated as acceptable or not-acceptable.
The use of the proposed method on two
typical surface defect examples shown in Fig˝s. 3
and 4 is demonstrated. DM was used to calculate defect volume above and below the RS:
Va X Y Z X Y Z X Y y
x
=∆ ∆
∑
∑
[
∆ ( , )]
∆ ( , ) 0> , (1)Vb X Y Z X Y Z X Y
y x
=∆ ∆
∑
∑
[
∆ ( , )]
∆ ( , ) 0< , (2)where Va is defect volume above RS; DZ(X,Y) > 0, Vb is defect volume below RS; DZ(X,Y) < 0,
DZ(X,Y) is difference between MS and RS, DX is distance between points in DM in x direction, DY is distance between points in DM in y direction.
Subscript DZ(X,Y) > 0 or < 0 means that only those DZ(X,Y) are summed, which are greater or less than zero. For each side a cumulative defect area is calculated:
Aa X Y Z X Y
y x
=
∑
∑
[
∆ ∆]
∆ ( , )>0, (3)Ab X Y Z X Y
y x
=
∑
∑
[
∆ ∆]
∆ <( , ) 0, (4)
where Aa is cumulative defect area above RS;
DZ(X,Y) > 0, Ab is cumulative defect volume
below RS; DZ(X,Y) < 0.
Average height is calculated as:
H
Z X Y
n
a
Z X Y y
x
a
=
[
]
>∑
∑
∆ ( , ) ∆,
( , ) 0
(5)
H
Z X Y
n
b
Z X Y y
x
b
=
[
]
<∑
∑
∆ ( , )∆,
( , ) 0
(6)
where Ha is the average defect height above RS;
DZ(X,Y) > 0, Hb is the average defect height below
RS; DZ(X,Y) < 0, na is the number of points above
RS, nb is the number of points below RS.
Maximum defect height and depth is found as:
Ha,max =max
(
∆Z X Y(
,)
>0)
, (7) Ha,min=min(
∆Z X Y(
,)
<0)
, (8)where Ha,max is maximum defect height above
RS; DZ(X,Y) > 0, Hb,max is maximum defect depth
below RS; DZ(X,Y) < 0.
The final value is total tooth area defined as:
A X Y
y x
=
∑
∑
∆ ∆ , (9)where A is the total tooth area.
These 9 values are then used to calculate characteristic parameters that define the type of defect and are used for defect classification:
Relative volume share of positive defect (above the RS) compared to total defect volume: VR = Va / (Va+ Vb); then the side with higher
volume share is further analyzed.
Table 1. Characteristic parameter values for the two given examples
Example 1 2
VR 6% 87%
AR 40% 22%
RH 1.84 2.77
HA [mm] 0.74 0.20
Parameters are used in an elimination process that brings us to a single possible defect. For the given examples, these are listed in Table 1 and the use of elimination process is demonstrated.
means that the defect is poor tooth formation (or rounded teeth defect, which falls under the same category). The small ratio of maximum and the average defect depth (RH = 1.84) means that
defect distribution is quite even, which confirms the previous conclusion. It is also quite substantial with an average depth HA of 0.74 mm and this
rules out the possibility of rounded teeth defect. Determined defect is poor tooth formation.
Example 2:
In this case positive defect volume share VR is quite large, which means there is an excess
a) b)
Fig. 6. DM of teeth shown in Fig. 4, a) poor tooth formation, b) bumps on the surface
of material and it can be concluded that there is a bump on the surface. This time the emphasis is on the positive defect and once again its cumulative area share AR is calculated and it amounts to
22% and confirms the initial conclusion, because defects caused by mold damage are usually small. The ratio of the maximum and average defect height RH is a bit larger this time probably because
the defect surface is isn’t parallel with the RS. The average defect height HA of 0.2 mm is quite
small but still relatively large if compared with the average depth of negative defect which is 0.03 mm. The above confirms that the defect is a bump on the surface caused by mold damage.
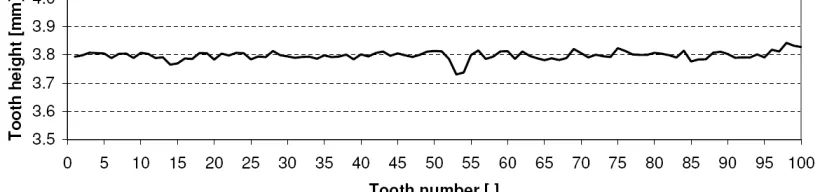
To demonstrate the use of the system on the whole belt a chart showing calculated, tooth height is shown in Fig. 7. Various parameters can be presented this way and tooth height was selected as it is easy to picture as a physical quantity and can serve as a parameter indicating teeth with possible defects which can be then analyzed in more detail. It can be seen from the chart that on a belt without defects, tooth height variation will normally be quite small (less than +/- 0.1 mm).
4 CONCLUSIONS
We have developed an experimental system for automated control of the belt geometry. A three-dimensional shape of the belt is acquired as a data cloud of points measured by a laser triangulation based measurement system. The acquired data can be further processed by two alternate methods. The first one imitates the current ‘manual’ procedure, where belt profiles are compared to the template defined by technical specifications. Quality assessment is based on 5 or 10% shrinkage control limits. The second method uses a novel approach based on the deviation map that enables automated identification of defects on complete teeth (not only one profile) and quality assessment of defects.
In this paper, the focus has been pimarily on quality assessment of timing belts. Timing belts with the most typical surface defects have been analyzed. The results show that the shape of the surface defects is sufficiently recognizable in the acquired data cloud. This means that point measurement accuracy of the developed
laser triangulation system is sufficient, i.e. the measurement system has the capability to measure the surface with the precision required for surface defect detection. Typical defects were classified into 4 categories: poor tooth formation, dented teeth, bumps on the surface and the open splice defect. This classification was found useful for the development of the defect characterization and detection methods.
Two defect characterization methods were examined. Both were based on the comparison of a measured 3D shape to a reference (or ideal) shape. The difference between the two shapes (called the deviation map) was used to calculate characteristic parameters, which were used for defect characterization. We found that by setting suitable limits to the characteristic parameters and their combinations it is possible to perform pass/fail classification of belts, accepting belts with insignificant (‘cosmetical’) irregularities and rejecting belts with significant surface defects. Further work is needed to develop the pass/fail criteria to comply with the requirements of the industry. The presented approach opens up the possibility of developing algorithms capable of automatic defect identification and classification, which would help the quality control personnel to identify the defect causes and sources.
5 REFERENCES
[1] Grum, J. (2003). Material and product quality assurance by application of non-destructive testing methods in automated manufacturing systems. 8th ECNDT
Barcelona 2002 – technical papers. Novice Društva za neporušitvene preiskave, vol. 11, no. 2, p. 53-62.
[2] Zupančič, R., Sluga, A. (2007). Statistical
process control: empirical comparison of control chart methods. Ventil, vol. 13, no. 1, p. 30-36.
[3] Zupančič, R., Sluga, A. (2008). Economic
design of control charts. Strojniški vestnik - Journal of mechanical engineering, vol. 54, no. 12, p. 855-865.
no. 3, p. 227-241.
[7] Hrovatin, R., Možina, J. (2000).
Non-destructive and non-contact materials evaluation by means of the optodynamic method. Insight, vol. 42, no. 12, p. 801-804. [8] Horvat, D., Možina, J. (2000). Optodynamic
measurement of ultrasound propagation in liquids. Insight, vol. 42, no. 12, p. 792-795. [9] Gregorčič, P., Petkovšek, R., Možina, J.
(2007). Investigation of a cavitation bubble between a rigid boundary and a free surface. Journal of applied physics, vol. 102, no. 9.
Feasibility study of in-process weld quality control by means of scanning laser profilometry. Optical Measurement Systems for Industrial Inspection, no. 5, p. 18-22. [13] Bračun, D., Gruden, V., Možina, J. (2008).
A method for surface quality assessment of die-castings based on laser triangulation. Measurement Science & Technology, vol. 19, no. 4, p. 1-8.
[14] Bračun, D., Jezeršek, M., Diaci, J. (2006).