in the population sciences published by the Max Planck Institute for Demographic Research Konrad-Zuse Str. 1, D-18057 Rostock · GERMANY www.demographic-research.org
DEMOGRAPHIC RESEARCH
VOLUME 27, ARTICLE 11, PAGES 299-338
PUBLISHED 23 AUGUST 2012
http://www.demographic-research.org/Volumes/Vol27/11/ DOI: 10.4054/DemRes.2012.27.11
Research Article
Mortality decline and reproductive change
during the Dutch demographic transition:
Revisiting a traditional debate with new data
Frans van Poppel Maria Sanchez-Dominguez
David S. Reher Erik Beekink
Alberto Sanz-Gimeno
© 2012 Frans van Poppel et al.
This open-access work is published under the terms of the Creative Com Attribution NonCommercial License 2.0 Germany, which permits use, reproduction & distribution in any medium for non-commerc provided the original author(s) and source are given cred
mons
ial purposes, it.
1 Introduction 300
2 Fertility limitation and the role of mortality during the demographic
transition 302
3 Materials and methods 308
4 The timing and pace of reproductive change 312
5 The role of mortality compared 317
6 The effect of religious affiliation and social class 321
7 Conclusions 323
Mortality decline and reproductive change during the Dutch
demographic transition:
Revisiting a traditional debate with new data
Frans van Poppel1
David S. Reher2
Alberto Sanz-Gimeno3
Maria Sanchez-Dominguez4
Erik Beekink5
Abstract
BACKGROUND
According to classic demographic transition theory, mortality change is the key factor that triggers a decline in fertility. Research on this topic has mostly relied on aggregate or time series data. Since fertility is based on the joint decisions of couples when confronted with specific fertility-childhood mortality outcomes, a focus on the experiences of individual couples is needed. Recently, Reher and Sanz-Gimeno used this approach to analyze individual longitudinal data for the Spanish town of Aranjuez.
OBJECTIVE
We investigate whether, in a country and in populations characterized by varying cultural and socioeconomic circumstances, family organization, and demographic regimes, the same mechanisms influenced the process of fertility decline as in Spain.
METHODS
The study uses micro longitudinal data from the Historical Sample of the Netherlands for a period stretching from the last quarter of the 19th century to the middle of the 20th century, and demographic measures identical to those used in the Spanish study to test
1 Netherlands Interdisciplinary Demographic Institute and Department of Sociology, Utrecht University,
Utrecht. E-mail: [email protected].
2 Universidad Complutense de Madrid. E-mail: [email protected]. 3 Universidad Complutense de Madrid. E-mail: [email protected]. 4 Universidad Complutense de Madrid. E-mail: [email protected].
whether the decline in fertility was triggered by the decline in mortality at the level of the family. As religious groups and social classes differed in their ability to correctly assess the implications of mortality levels, and in their willingness, readiness, and ability to react to these changes by adapting their reproductive behavior, we also compared the effect of mortality decline by the religion and the social class of the couples.
RESULTS
We observed that childhood survival had clear effects on reproduction, the chances of having another child, and the length of the intervals between births, which indicates that this variable was crucial for fertility decisions. This pattern was especially strong after 1900. There were rather consistent and expected differences in the reactions to the survival of children by social class and religious group. Whereas skilled workers were rather sensitive to the number of surviving children, farm families were much less likely to allow their chance to have another child and the length of the intervals between births to be affected by the number of surviving children. Liberal Protestant couples differed sharply from Orthodox Protestant and Catholic couples in their reactions to the increase in the number of surviving children. In both the Netherlands and in Spain, the familial experience of childhood survival was central in determining reproductive strategies, although interesting differences can be seen.
CONCLUSIONS
Our findings on the large differences in the fertility reactions to (changing) mortality patterns strongly support the idea that there were multiple fertility declines, or a variety of paths to lower fertility. Basically, whether couples implement fertility strategies in reaction to the number of surviving offspring is determined by how people perceive their lives. The willingness and the ability to implement such a reproductive strategy stem from the ability of couples to think about long-term goals; their ability to perceive the way the survival or the death of their offspring affects family size and family well-being over the short, medium, and long term; and the degree to which they are willing to make decisions to achieve those long-term goals.
1. Introduction
number of surviving children, and that fertility control was, at least originally, an effort to restore the balance in the family size that had been upset by declines in childhood mortality. This cornerstone of transition theory subsequently came under severe criticism, especially within the context of the Princeton European Fertility Project (Knodel 1978; Knodel 1974; Lesthaeghe 1977; Livi Bacci 1977; Matthiessen and McCann 1978; Palloni and Rafalimanana; Rosero-Bixby 1998; Van de Walle 1986). It is also true, however, that other scholars have insisted on its validity (Bhat 1998; Chesnais 1986; Cleland 2001; Galloway, Lee and Hammel 1998; Haines 1998; Kirk 1996; Knodel 1988).
An important reason for these differences of opinion among scholars is that the mechanisms by which mortality change intervened in reproductive decisions are not well understood because of a lack of requisite data. Many studies have relied on aggregate or time series data, which do not allow researchers to dig into the details of the history of a particular country or region (Guinnane and Brown 2002). Statistical correlations and indirect measures of fertility control cannot reliably be used to date the initial stages of the fertility transition (Guinnane, Okun and Trussell 1994). Since fertility is based on the joint decisions made by couples when confronted with specific fertility-childhood mortality outcomes, research that focuses on the experiences of individual couples is needed (Friedlander, Okun and Segal 1999).
Fertility responses to improved child survival may differ across groups. Among groups who saw large families as an asset and who had strong taboos about the use of contraceptives, an increase in the number of surviving children might not have led to the same fertility response as it would among groups for whom this was not the case. Individual maternity histories can often be linked to information about the socioeconomic position or religion of the couple, which makes the use of this kind of data even more valuable.
achieved almost entirely by stopping behavior, while both stopping and spacing were used at a more advanced stage of transition. Throughout the period studied, families appear to have been increasingly aware of the implications of having too many children, although they may not always have been successful in meeting their family size goals. Reher and Sanz-Gimeno explicitly posed the question of whether their results could be extrapolated to other historic populations or to other regions. Extrapolating the methods and the results to other historic contexts is an important starting point in assessing the relevance of this seminal paper.
A goal of our paper is to test the extent to which the type of mechanisms identified by Reher and Sanz-Gimeno existed in the Netherlands as well. The Netherlands clearly differed from Aranjuez in terms of its culture and socioeconomics, family organization, and demographic regime (Van Poppel and Röling 2003). Similar methods of analysis will be used to test the validity of Aranjuez’s conclusions. The source of the Dutch data is the Historical Sample of the Netherlands, a nationally representative sample of cohorts who gave birth to their first child between 1870 and 1950. This sample contains linked reproductive histories similar to those that exist for Spain, though the Dutch national sample is not local, and is more systematic and much larger and more versatile than the Spanish sample. The Dutch data also allow us to delve into issues that were barely mentioned in the original paper. Our approach differs from that of an earlier study, which examined the relationship between infant mortality and fertility in the Netherlands (Shepherd, Kok and Hsieh 2006). We focus on changes over time, use a different method for analyzing the effects of mortality, and make use of a much more extended database. We are able to explore the mortality-fertility links that existed in the Netherlands for different occupations and different religious affiliations. Religious groups and social classes not only differed in their levels of infant mortality, but presumably also in their ability to correctly assess the implications of these levels, and in their willingness, readiness, and ability to react to these changes by adapting their reproductive behavior. The results presented here will transform many of our original assumptions into a whole new set of issues that may be expected to influence future research on the subject.
2. Fertility limitation and the role of mortality during the
demographic transition
those who argued that there had been a process of adaptation, in which couples began making use of seemingly traditional methods—like abstinence, coitus interruptus, and
perhaps abortion—in order to compensate for improvements in child survival (Carlsson 1966; Guinnane, Okun and Trussell 1994; Knodel and Van de Walle 1979; Okun 1994; Santow 1995). The finding of the Princeton project that there was an almost simultaneous decline in fertility across Europe, despite the differing social, economic, and cultural circumstances of countries, seemed to support the arguments of those who believed in the primacy of innovation. However, historical evidence of the prevalence during this period of contraceptive methods that were neither new nor sophisticated, like coitus interruptus, appeared to support the adaptation premise, a concept that is
central to traditional demographic transition theory (Guinnane, Okun and Trussell 1994). The key underlying issue in the debate was the simultaneity of mortality improvement, rather than that of fertility decline. From the outset, important methodological objections were raised that tended to limit the reach and robustness of many of the conclusions stemming from the debate. Issues as important as whether or not fertility control actually existed, or even when the fertility decline occurred, have remained controversial, and a number of different methods for studying these questions have been proposed and eventually discarded because of ambivalent results (for a review, see, for example, Okun 1994). Even when using micro data, the preferred option, results have at times been less convincing than we might have hoped (Guinnane, Okun and Trussell 1994; Van Bavel 2004b).
Central to the debate regarding the nature of fertility limitation within marriage is the extent to which it was the result of stopping or spacing behavior. While starting (marriage) is also important for fertility outcomes, it tends to receive less attention, mainly because it is less clearly linked to the conscious reproductive decisions of married couples, which has long been the key issue for historical demographers of this period. While it is still insufficient, the evidence so far suggests that (a) stopping was the main mechanism for achieving a reduction in fertility, especially during the early part of the demographic transition (Knodel 1987); (b) spacing strategies existed before the first full-blown phase of the transition (Anderton and Bean 1985; Flinn 1981; Santow 1995; Van Bavel 2004a, 2004b), possibly at more advanced stages (Reher and Sanz-Gimeno 2007) and in other, more contemporary contexts (Friedlander, Eisenbach and Goldscheider 1980); and (c) there is little evidence of parity-specific fertility control—which has long been considered the hallmark of the demographic transition— in earlier pre-transitional and natural fertility populations (Coale 1973; Knodel 1987). None of these results have been fully confirmed by the historical record, but there is some evidence that points in this direction.
considered to be the result of a conscious decision not to have any more children, even though it is also influenced by the timing of marriage, underlying fecundity, incipient sterility (Ellison 2001; Wood 1994), and chance. The actual length of a birth interval is the result of the survival status of a previous sibling, the mother’s health, the existence and duration of breastfeeding, the duration of postpartum amenorrhea, coital frequency—which is itself influenced by the duration of the marital union, parity, and the physical makeup of the couple—and, of course, chance. Only some of the factors that influence stopping and birth spacing are related to choice, and even fewer are linked to the type of rational choice—i.e., parity-specific fertility control—thought to characterize the demographic transition. Some variables, like underlying fecundity, incipient sterility, the death of a previous child, or chance, are unrelated to choice. Breastfeeding itself is the result of rational decision making, but it appears to be a time-invariant type of choice affecting the entire reproductive period. There is no evidence that its duration varies over the reproductive period as the result of conscious decisions. While it is obvious that rational decision making also comes into play in both stopping and spacing behavior, it is only one of the factors involved. This often makes clearly identifying rational decision making quite problematic.
Oddly absent from the debates on the roots of fertility limitation is the role of mortality in conditioning reproduction. Ultimately, fertility limitation is normally attributed to social and economic change, to changes in cultural and political contexts (for example, secularization) or to the rather vague concept of “ideational change.” While all of these factors may have been potentially influential, it is surprising that the enormous changes in childhood survival rates, which occurred everywhere immediately prior to and during the fertility decline, have not attracted more attention in these debates. There are, however, many reasons why childhood mortality may have been especially relevant for fertility outcomes during this period.
Pebley and colleagues suggested that a decline in child mortality could affect fertility in three different ways: via level biological effects; via individual-level behavioral effects, and via both biological and behavioral community-individual-level effects (Pebley, Delgado and Brinemann 1979). The reduction in fertility as a result of increased pregnancy intervals is an example of individual-level biological effects of
decreased mortality: improved infant survival prolongs lactation, which in turn increases the average length of intervals between pregnancies. Behavioral reactions
may involve the replacement of a child who has died and a more general adjustment of fertility to ensure the survival of a minimal number of children to adulthood in response to oscillations in childhood mortality (hoarding). If couples adjust their fertility behavior to ensure that they have a certain number of surviving children, reductions in child mortality might change desired fertility. At the community level, child mortality
economic institutions, such as housing conditions and inheritance systems that were adapted to low levels of child survivorship.
For that to occur, however, it was important not only for childhood survival rates to improve, but also for prevailing mortality rates to stabilize at relatively low levels. The greater the perceived variability of survival within the household, the less likely it was that strategies designed to achieve a desired family size would be implemented. This is why we do not expect to see the mortality-fertility link nearly as clearly before the demographic transition as when the transition is in full swing.
The key questions here are whether families were aware of the implications of the number of surviving children before and during the demographic transition, and how their perceptions changed over time. In other words, was there an ideal family size during the early stages of the demographic transition? If there was, then we may assume that the massive decline in childhood mortality that took place during the same period must have had important implications for fertility. Etienne van de Walle hypothesized that numeracy regarding children—that is, the perception that having a particular family size was a goal that should be integrated into the long-term strategies of couples—did not appear until shortly before the fertility transition (Van de Walle 1992). Yet for Malthus, a clear notion of family size at the familial level was the basic building block of population stability, and the origin of the preventive check. Beyond Malthus, it is worth remembering that the low population growth rates that prevailed everywhere prior to the late 19th and early 20th centuries suggest that the net sibset size was small, not large. Similar results can be gleaned from the massive data about the (small) household size that existed for much of Europe before and during the demographic transition. If an ideal size existed, it must have been small, and it would have invariably referred to the number of surviving children, and not to the number of childbirths.
The behavioral adjustment of fertility desires is usually assumed to be a process by which couples accurately and consciously assess the current and expected chances of child survival. The change in family strategies that characterizes the demographic transition has been described as the replacement of the “reactive, largely biological family-building decision rules appropriate to highly uncertain environments by more deliberate and forward-looking strategies requiring longer time horizons” (Cohen and Montgomery 1998). The perceptions of couples might be shaped by their own mortality experiences, but also by those of family and friends, during both childhood and adulthood.
that the degree of uncertainty regarding child survival differed in time and space. Improvements in child survival occurred at different moments in time, and whether, when, and how families perceived these improvements might have influenced the preferences, beliefs, and modes of behavior of parents in relation to fertility decisions. Direct information on continuity and change in mortality perceptions is very rare and impressionistic.
Perceptions of mortality were not, however, the only factor influencing fertility. Lloyd and Ivanov (1988) have argued that the timing of changes in fertility behavior induced by specific improvements in mortality conditions also depends on the way in which the socioeconomic setting influences the demand for surviving children and birth control. The social correlates of the demand for surviving children include economic, institutional, and socio-cultural factors, such as the extent of urbanization, the mode of production, the system of beliefs, the role of women in society, education, and the availability of methods of birth control. Among groups who viewed large families as an asset, such as in labor-intensive agricultural societies, or among groups who had strong taboos around the use of contraceptives (such as Catholics), an increase in family size may not have elicited the same reactions as it did among groups who were less opposed to the use of contraception or whose families were less dependent on the contributions of their children.
By comparing the fertility response to child survival in the Netherlands, a country where levels of childhood survival were higher and had increased earlier than in Spain, we can test whether the same mechanisms played a role in varying circumstances. Our data also provide us with the opportunity to study the mortality-fertility link in different settings within the Netherlands. Different social groups in the Netherlands varied in
terms of their levels and trends in infant mortality, as well as in their abilities to correctly assess these levels, and in their willingness, readiness and ability to react to these changes by adapting their reproductive behavior. Research has shown that, in the Netherlands, white-collar, middle-class families were the forerunners in the decline in childhood mortality; and that religious groups also differed in their mortality levels: Jews had much lower childhood mortality than Liberal Protestants (Dutch Reformed) and Catholics (Van Poppel, Jonker and Mandemakers 2005; Van Poppel, Schellekens and Liefbroer 2002). Actual mortality trends and their assessment by couples could, however, deviate from these general trends.
lives made it difficult for the average person to comprehend that changes in the overall mortality level had occurred. Despite the continuous reality of infant death, Dye and Smith (1986) noted that there was a significant change in the responses of American mothers to death in their families over the period 1750-1920. From the mid-19th century onwards, mothers slowly came to replace God as the most important guarantors of their children’s welfare. Even with persistently high infant death rates, they came to believe that good mothering could ensure a baby’s survival. It was not until infant mortality began to decline significantly after 1900 that mothers were no longer plagued by incessant worries that babies might die. Smith and Hacker (1996) argued that the perception of typical mortality risk was above all informed by the uncertain timing of
death, which religion stressed so heavily. The emphasis on the uncertainty of life made it difficult for couples to feel sure that their target family size could be achieved.
Variations in the degree to which couples were able to perceive correctly the mortality risks of their children may have also existed. Urban, better educated, and more recently married couples of the elite and white-collar middle class should have been better able to “pinpoint” the realities and implications of net family size, as they had the ability to assess the potential risks and engage in a degree of abstraction. These were the groups that 19th-century hygienists, who were trying to increase the quantity and quality of data on mortality, and to disseminate these data more widely, focused on (Houwaart 1993). There were also differences among religious groups. Whereas in the Netherlands, Liberal Protestants were receptive to new scientific insights, and were inclined to grant the individual a large degree of autonomy in matters of family planning, Orthodox Protestants and Catholics had pronatalist doctrines, a fatalistic attitude towards life, and a low degree of receptiveness of new scientific knowledge. Orthodox Protestants focused (and still do) on the importance of trusting in divine providence, and they stressed the futility and impudence of rebelling against God's will in the face of illness (Ruijs et al. 2011). As recently as in the 1950s, many Catholic and Calvinist women were convinced that all children were a gift from God, and that they had to abandon themselves to the Lord. They therefore welcomed any number of children sent by God. Their ideal number of children was “as many as come,” “don’t know,” or “as many as God sends” (Diels 1951, 1953).
3. Materials and methods
To study the mortality fertility interactions in the Netherlands, we used information on full maternity histories of couples who were born between 1850 and 1922, and who had their children between 1870 and 1950.
Information on couples and on the timing of births and deaths of their children was deduced from a consecutive series of municipal population registers and its successors. Population registers, which were established in the Netherlands by the Royal Decree of December 22, 1849, combine census listings with vital registration in a linked format for the entire population of a municipality, with the household as the registration unit (Alter 1988). For each household member, date and place of birth, relationship to the head of the household, sex, marital status, occupation, and religion were recorded. New household members, including live births, were added to the list of individuals already recorded, and those who left the household due to death or migration were deleted with a reference to the place and date of migration or the date of death. As the municipal population registers allow us to follow couples from birth to death and, in the case of migration, from place to place all over the country, the data make it possible to reconstruct complete life histories of couples from 1850 until 1939, when the registers ended.
After 1939, the bound population registers were replaced by personal record cards, which largely included the same information as the population register, but with the individual person as the registration unit. If a person became the head of a family, his or her personal record card also contained information on the names and the dates and places of birth and death of the spouse and children of the head. The card followed the individual during his or her life from place to place. After the individual died, his or her card was sent to the Central Bureau of Genealogy (CBG) where it was kept in the Archive of Death Registration (Van den Brink 1966).
In 1994, this system was restructured into an electronic database, the so-called
Gemeentelijke Basis Administratie (GBA: Municipal Basic Administration) (Prins
Data from the registers, personal record cards, and personal record lists were collected in the framework of the Historical Sample of the Netherlands (HSN). This is a database with information on the complete life histories of a national random sample of the 1850-1922 birth cohorts in the Netherlands (Mandemakers 2001). The sampled individuals are followed from cradle to grave; information is also collected on the spouses of the sampled individuals, and on children born to these individuals, including the timing of their births and deaths, provided these events took place while the children were part of the household of the individual. Only women for whom we had full reproductive histories and whose spouses survived to age 45 have been included in the analysis.
The dataset covers a long time period and the entire country, and thus allows us to study a wide variety of contexts, including large cities and rural areas, agricultural and industrializing regions, and Catholic and Orthodox areas.
Our data do, however, have three serious limitations.6 The first one is related to the
replacement of the population register by the personal record card in 1938-39 and by the personal record list in 1994. Until 1994, information on the names and the dates of the births, deaths, or departures of the children of the sampled individuals were noted on the card of the head of the family; i.e., the card of the father or the widowed mother of the child (Lentz 1936). From 1994 onwards, only the names and the dates of birth of children of the head (no sex or death information) were noted on the card of the family head, and information on the sex and the dates of death or departure were noted solely on the child’s own card. As personal record cards and personal record lists are only available for deceased persons, the reproductive histories, including the dates of death of the children of the sampled males and females, are only known for couples among whom the male head died before October 1994 (Centraal Bureau voor Genealogie 2009).7
The second problem relates to the time frame of the database. The earliest cohort for whom we have information was born in 1850, and women from this cohort started reproducing in earnest only after 1875. Data for the 1870s will, by definition, therefore, mostly consist of maternity histories for women who started having children at an early age (age 20). This will cause a downward bias in the ages at which the mother gave birth to her first child, and an upward bias in the number of children born. The couples
6 Although the quality of these data is high, the population registers have their shortcomings (Janssens 1993;
Knotter and Meijer 1995; Meijer 1983; Vulsma 2002). Janssens (1993) found that some 0.2% of all live births were not entered in the population register, almost all of them being children who died very soon after birth. The omission of less than 1% of births should not alter our conclusions to a large extent.
7 It is possible to link most of the parents and children of all persons ever registered in the GBA from January
who had their first child in this period are thus not representative of all couples who had their first child in the 1870s.
A third problem is that, currently, the database for the earlier birth cohorts only covers part of the country. Data for all of the birth cohorts have been entered only for three of the 11 Dutch provinces (and for the city of Rotterdam), whereas information is available for all 11 provinces only from the birth cohort 1883 onwards. Thus, for the southern provinces, which until the 1960s had higher-than-average marital fertility and infant mortality rates (Engelen and Hillebrand 1986), the data cover a later period than is the case for Zeeland, Utrecht, and Friesland. By combining the data for all of the provinces, we in fact cause a distortion of the time trend in marital fertility, and slightly underestimate the decline in fertility. As we are primarily interested in the way in which mortality and fertility interact, and not so much in their levels, we do not consider this
to be a serious problem. Besides, information on the two characteristics that are at the root of the regional fertility differences, religion and social class, is available for the couples present in our database (Van Poppel 1985).
Occupations of the husband have been coded on the basis of the HISCO coding scheme (Historical International Standard Classification of Occupations) (Van
Leeuwen, Maas and Miles 2002), and were then classified according to the SOCPO social class scheme proposed by Van de Putte and Miles (2005). SOCPO (Social Power) is defined as the potential to influence one’s “life chances” through control of (scarce) resources, and is based on economic (self-employment, skill, and authority) and cultural resources (non-manual versus manual occupations, nobility and prestige titles). The merging of economic and cultural power dimensions leads to a scheme with six levels: the elite, the middle class, farmers, skilled workers, semi-skilled workers, and unskilled workers.
we expect that Liberal Protestant couples and mixed couples will have adopted forms of birth control earlier.
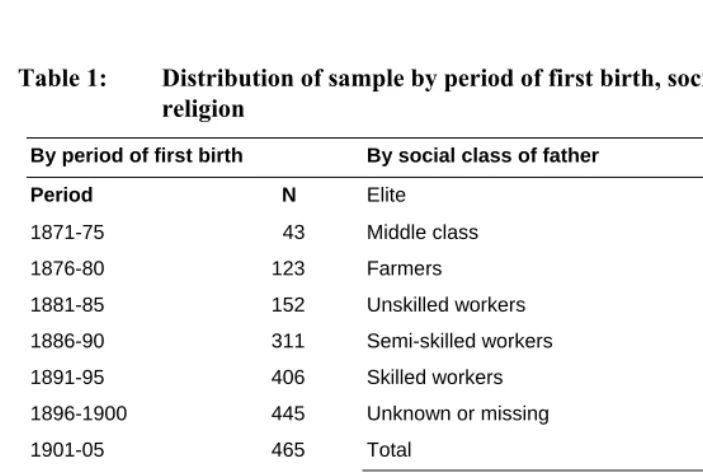
The HSN database includes information on 5,411 couples who gave birth to 25,126 children, 2,770 of whom died before the age of five. As was the case in the Spanish study, the reproductive histories have been organized by the date when the first birth took place. As Reher and Sanz-Gimeno noted, this makes interpreting the precise timing of trend changes difficult. Since the events affecting, for example, the 1901-05 first birth cohort actually happened between approximately 1901 and 1920, pinpointing the timing with respect to contemporary events is problematic. Table 1 shows the distribution of women by first birth cohort, social class, and religion.
Table 1: Distribution of sample by period of first birth, social class, and religion
By period of first birth By social class of father
Period N Elite 181
1871-75 43 Middle class 1170
1876-80 123 Farmers 657
1881-85 152 Unskilled workers 1139 1886-90 311 Semi-skilled workers 647 1891-95 406 Skilled workers 1082 1896-1900 445 Unknown or missing 508
1901-05 465 Total 5411
1906-10 538 By religion of couple
1911-15 688 Both parents Catholic 1358 1916-20 582 Both parents Liberal Protestant 1715 1921-25 429 One or both parents Orthodox Protestant 973 1926-30 283 Both Jewish 49 1931-50 946 Other, unknown, or missing 1175
Total 5411 Total 5411
4. The timing and pace of reproductive change
Figure 1 depicts three dimensions of the reproductive process: children ever born (CEB), the total number of children surviving to five years of age, and the number of childhood deaths, all grouped by first birth cohort.
Figure 1: Indicators of reproduction, Netherlands, by first birth cohort
0.0 1.0 2.0 3.0 4.0 5.0 6.0 7.0 8.0 9.0
1871‐75 1876‐80 1881‐85 1886‐90 1891‐95 1896‐1900 1901‐05 1906‐10 1911‐15 1916‐20 1921‐25 1926‐30 1931‐50
Children ever born
Childhood deaths
Surviving to age 5
As we mentioned above, the outcomes for the 1871-75 cohort are too high, and for that reason we focus on the development from the cohort 1876-80 onwards. The following conclusions can be drawn from an examination of Figure 1:
a) From 1876-80 onwards, the number of children ever born is roughly in line with what we would expect to find from more aggregate indicators, such as Ig or the marital fertility rate. Between 1876 and 1930, there is a
3.3. Afterwards, marital fertility hardly changed. It is comforting that the low interwar fertility levels in the Netherlands during the 1930s show up in these data (Van Bavel 2010).
b) Throughout the whole period, there was a gradual and continuous reduction in the number of children who died before they reached their fifth birthday. Over the entire period, women went from losing 1.51 children to losing about 0.12 children.
c) Net family size decreased in all cohorts, a decline which stopped only after the 1921-25 cohorts. In all of the cohorts, the decline in the number of CEB was stronger than the improved survivorship in childhood. This applied in particular to cohorts who had their first child in the 1890s and in the years 1916-30.
During the historic demographic transition, people ether spaced their childbirths by means of low-tech and relatively inefficient mechanisms, like prolonged breastfeeding and rhythm or coitus interruptus, or they ceased having children earlier than before.
Classic demographic theory suggests that stopping was the more prevalent form of behavior, and the age at last birth has frequently been used as the proof of this type of behavior. Some researchers have insisted on the existence of spacing as well, but normally as a complementary and less important source of fertility control. Spacing implies that child mortality must have been low and stable enough from the outset to enable people to formulate their reproductive strategies with reasonable certainty. When mortality was high and variable, people were less likely to have this degree of certainty, and setting fixed goals for the number of births at the time of marriage was hardly a rational strategy. In other words, the people who “turned down” their fertility via spacing must have had some goal with regard to the number of surviving children they wished to have (Fisher and Szreter 2003). Where mortality was high and variable, this goal might have been only approximate, but as childhood mortality declined and stabilized, it became much clearer and more precise.
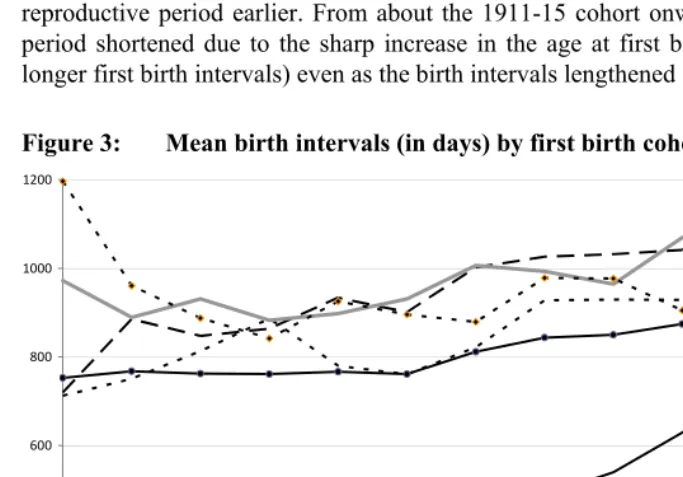
The process of fertility control in the Netherlands is shown in Figure 2 with respect to variation in stopping indicators over the period, and in Figure 3 with respect to birth spacing.
cohorts, or four years higher than in the reference cohort.8 The overall duration of
reproduction decreased continuously until the last cohorts. In the 1931-50 cohorts, it was less than half (six years) as long as it had been previously (12 years or more). The decline from the 1890s onwards was due to the gradual decrease in the age at the termination of childbearing, whereas in the latter cohorts, it was mainly due to increasing ages at the start of childbearing. The reduction in the number of children ever born to cohorts thus corresponded first with a period in which the ages at last birth fell, and the decrease in the number of children born to later cohorts corresponded with a gradual shortening of the reproductive period due to higher ages at the birth of the first child.
Figure 2: Start, end, and duration of reproductive period by first birth cohort, in years
0 5 10 15 20 25 30 35 40 45
1871‐75 1876‐80 1881‐85 1886‐90 1891‐95 1896‐1900 1901‐05 1906‐10 1911‐15 1916‐20 1921‐25 1926‐30 1931‐50
Age last birth
Length reproductive
period
Age first birth
8 The ages at first birth in the first cohorts were biased downwards by the process of selection mentioned
A look at the birth intervals in the Netherlands shows that there was a sharp increase in the length of these intervals from the cohorts who gave birth during the last quarter of the 19th century through the 1931-50 cohort (Figure 3). During this period, the mean interval between children increased by more than seven months. This was largely caused by an increase in the length of the first interval. However, the intervals between the first and second—and, to a lesser degree, the second and third and the third and fourth children—also increased sharply, particularly from the 1900-04 cohort onwards. These data suggest that, by 1920, spacing strategies were being implemented in the Netherlands from the very outset of women’s reproductive periods. In the first stage of the process of fertility decline in the Netherlands, women started to end their reproductive period earlier. From about the 1911-15 cohort onwards, the reproductive period shortened due to the sharp increase in the age at first birth (mainly caused by longer first birth intervals) even as the birth intervals lengthened substantially.
Figure 3: Mean birth intervals (in days) by first birth cohort
0 200 400 600 800 1000 1200
1871‐75 1876‐80 1881‐85 1886‐90 1891‐95 1896‐1900 1901‐05 1906‐10 1911‐15 1916‐20 1921‐25 1926‐30 1931‐50
Decomposing the relative effect for the total number of childbirths of changes in the length of the childbearing period and of the average birth interval enables us to pinpoint which of these factors predominates during any given period. The approach followed here is based on an idea elaborated by Peter McDonald (1984) and subsequently adapted by John Knodel (1987). The results are reported in Table 2. The 1891-1905 cohort has been used as the basis for the comparison.
In the first cohorts, all of the reproductive indicators, but particularly the higher age at first birth and the longer length of the average birth interval, contributed to the higher level of fertility relative to that of the 1891-1905 cohort. In the 1906-15 cohort, the main component of the fertility decline was the decrease in the age at last birth. The increase in the length of the average birth interval was a relevant factor, especially for the 1906-1915 and 1916-50 cohorts. In this last cohort, the decline in the number of children ever born was due to a mixture of a decrease in the age at first birth, a decrease in the age at last birth, and an increase in the length of the average birth interval. Thus, whereas at the start of the demographic transition, the main mechanism limiting the number of childbirths was the age at last birth, in the most recent stage, all of the reproductive indicators contributed almost equally to the reduction in fertility.
Table 2: Estimated effect of changes in age at first birth, average birth interval, and age at last birth on total number of childbirths (1891-1905 as reference)
% change expected due to observed change in
Cohort
Observed % change in total number of
childbirths Age First Birth Birth Intervals Age Last Birth N
1876-1890 14,24 7,66 4,41 2,16 586
1891-1905 Comparison Cohort 488
1906-1915 -9,56 -2,39 -8,32 -12,55 1361
1916-1950 -29,24 -19,08 -10,04 -15,12 2400
5. The role of mortality compared
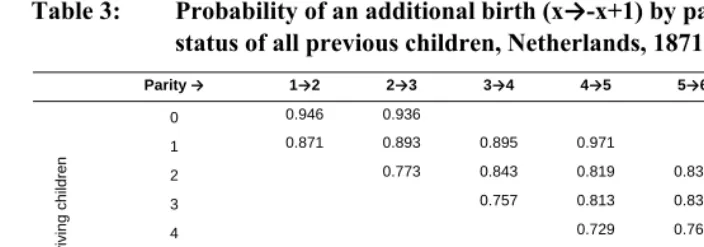
To examine the role of child survival in reproduction, the probability of having an additional child and the length of birth intervals will be analyzed in terms of parity and the precise number of surviving children in individual families.
In Tables 3 and 4, we assess how the likelihood of an additional birth (PPR: Parity Progression Ratio) or the mean duration of a birth interval by parity is influenced by childhood survival by controlling for the precise number of surviving children of individual women at any given parity. In these three-way tables, each column refers to different parities and each row refers to the precise number of surviving children from all previous births. Any given cell pinpoints women at a specific combination of parity and childhood survival during their reproductive lives.9
An examination of the contents of Table 3 suggests that women were actively adjusting their reproductive strategies to the realities of child survival. When read horizontally, the cells reflect the strict parity effect, independent of familial levels of child survival, which indicates that this effect is practically non-existent. Taking, for example, women who have two surviving children, we can see that the likelihood of having an additional child was 0.843 at parity three and was 0.838 at parity five. When we read the cells vertically, we can see that the net childhood survival effect on reproduction appears, which indicates that this variable was crucial for fertility decisions. The likelihood of having a fifth child when only one of the previous children was still alive was 0.971, whereas when all four of the previous children were alive, the probability declined to 0.729. With only one exception, at all parities the probability of having an additional child decreases as the number of surviving children increases. This pattern emerges even at very low parities (two or three), which seems to indicate that these sorts of decisions were made throughout the reproductive lives of parents. These results suggest that reproductive strategies were the product of rational decision making processes pegged fundamentally to the number of surviving children, though other factors not included in this analysis may have also influenced the results.
9 For those women who had an additional birth (parity x+1), the number of their surviving children at the time
Table 3: Probability of an additional birth (x→-x+1) by parity and survival status of all previous children, Netherlands, 1871-1950
Parity → 1→2 2→3 3→4 4→5 5→6 6→7 7→8
0 0.946 0.936
1 0.871 0.893 0.895 0.971
2 0.773 0.843 0.819 0.838 0.769
3 0.757 0.813 0.836 0.865 0.875
4 0.729 0.768 0.803 0.827
5 0.759 0.774 0.788
6 0.718 0.740
S
u
rvivin
g
ch
ild
ren
7 0.706
Total 0.875 0.789 0.779 0.759 0.772 0.754 0.744
Note: Proportion of women who have an additional birth [x+1] at different parities and numbers of surviving children. Total = likelihood of an additional birth independent of survival status of earlier children [all cases included]. Cells with very small numbers of cases (<25) are eliminated.
Table 4: Probability of an additional birth (x → x+1) by parity and survival status of all previous children, Netherlands. Change over time
Parity → 1→2 2→3 3→4 4→5 5→6 6→7 7→8
1871- 1901- 1871- 1901- 1871- 1901- 1871- 1901- 1871- 1901- 1871- 1901- 1871- 1901- Periods
1900 1950 1900 1950 1900 1950 1900 1950 1900 1950 1900 1950 1900 1950
0 0.973 0.924 0.935
1 0.947 0.848 0.953 0.850 0.933 0.821 1.000
2 0.893 0.734 0.895 0.794 0.858 0.750 0.880
3 0.854 0.721 0.863 0.766 0.855 0.805 0.859 0.880
4 0.819 0.691 0.840 0.708 0.832 0.765 0.827 0.829
5 0.829 0.726 0.770 0.778 0.844 0.697
6 0.734 0.713 0.794 0.690
S
u
rvivin
g
ch
ild
ren
7 0.733 0.694
Total 0.950 0.852 0.905 0.746 0.869 0.735 0.841 0.711 0.841 0.725 0.774 0.741 0.792 0.702
Note: Proportion of women who have an additional birth [x+1] at different parities and numbers of surviving children.
Total = likelihood of an additional birth independent of survival status of earlier children [all cases included]. Cells with very small numbers of cases (<25) are eliminated.
Results similar to those of the analysis of the parity progression ratios were produced when we looked at the median birth intervals (see Table 5). Birth intervals were estimated only for those women whose previous child had not died within six months of birth.10 This was done to avoid including women whose return to
fecundability was not due to choice, but was instead attributable to a previous death which had cut short the period of breastfeeding. There is strong evidence that increasing parities (net of childhood survival) led to shorter birth intervals (horizontal), and there is also clear evidence that the survival status of previous children (net of parity) led to longer median intervals. As the number of survivors increased, the time it took for another child to be born also lengthened; for example, for parity 5Æ6, the difference between two or five surviving children was 182 days. This pattern may have been the result of variations in the frequency of sexual relations, based on the assumption that relations were more frequent when the number of surviving children was lower. An alternative explanation for these results, in which it is posited that women with shorter birth intervals tended to experience higher levels of childhood mortality, either due to competition for resources within the family, or because of earlier weaning, can be
discarded: as only women whose previous child survived at least to the age of six months(the approximate moment of weaning) were selected, by definition the death of the child cannot be a biological determinant of the cessation of breastfeeding, though his or her survival status later on would certainly enter into the calculations of the family. It is the experience of childhood mortality (in terms of surviving sibs) that is an important factor in influencing the length of birth intervals, not vice versa.
Table 5: Median birth interval (days) by parity and survival status of all previous children, Netherlands, 1871-1950
Parity → 1→2 2→3 3→4 4→5 5→6 6→7 7→8
0 446 416
1 700 597 613 589
2 781 684 657 590
3 805 748 666 558
4 782 734 694 617
5 772 755 691
6 735 735
Surviving children
7 719
Total 682 746 773 757 741 721 717
Note: Median birth interval at different parities and numbers of surviving children. Total = median birth interval independent of survival status of earlier children [all cases included]. Cells with very small numbers of cases (<25) are eliminated. Only women whose previous child survived have been used in the estimation of birth intervals.
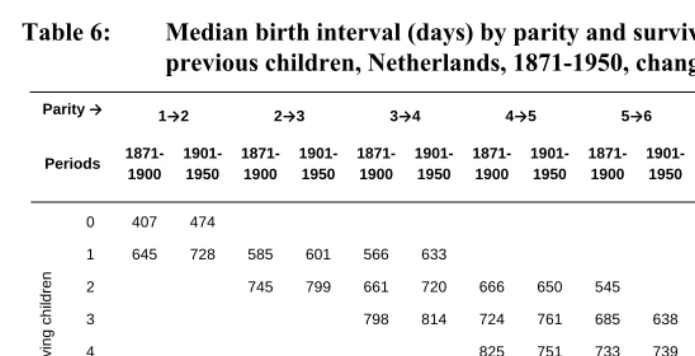
Table 6 again compares reproductive histories beginning in the 1871-1900 period with those starting after 1900. When we look at the median birth intervals, we can clearly see that spacing strategies were already in place before 1900; intervals were longer when for a given parity the number of surviving children was higher. For parities 1→2, 2→3, and 3→4, the intervals were much longer after 1900 than before that year; while for parities above five, this was not the case.
Table 6: Median birth interval (days) by parity and survival status of all previous children, Netherlands, 1871-1950, change over time
Parity → 1→2 2→3 3→4 4→5 5→6 6→7 7→8
1871- 1901- 1871- 1901- 1871- 1901- 1871- 1901- 1871- 1901- 1871- 1901- 1871- 1901- Periods
1900 1950 1900 1950 1900 1950 1900 1950 1900 1950 1900 1950 1900 1950
0 407 474
1 645 728 585 601 566 633
2 745 799 661 720 666 650 545
3 798 814 724 761 685 638 577
4 825 751 733 739 712 689 647 564
5 790 753 769 714 705 691
6 778 706 767 708
S
u
rvivin
g
ch
ild
ren
7 770 695
Total 626 710 717 775 744 797 769 748 744 738 742 702 749 697
Note: Median birth interval at different parities and numbers of surviving children. Total = median birth interval independent of survival status of earlier children [all cases included]. Cells with very small numbers of cases (<25) are eliminated. Only women whose previous child survived have been used in the estimation of birth intervals.
6. The effect of religious affiliation and social class
Our assumption was that the specific context in which couples lived could have had an effect on the mortality-fertility link, and we were particularly interested in the ways in which religion and social class affected how couples reacted to the increase in the survival of children. The size of the sample does not, unfortunately, allow us to study this process in every desired detail; we have therefore restricted the tables to those situations for which we had a sufficient number of couples (25).
For the four religious groups, the picture is clear as well. Among Liberal Protestants and among the “other” group, which consisted of some smaller Protestant groups, Jews, and people without religion, the parity progression ratios were much more strongly affected by the number of surviving children than was the case among Orthodox Protestants, but especially among Catholics. The median intervals were also longer with the increase in the number of surviving children among the Liberal Protestants, the other group, and the Orthodox Protestants than they were among the Catholics. These results are in line with our expectations.
Table 7: Probability of an additional birth (x → x+1) and median birth interval (in days) by parity and survival status of all previous children, by social class of the father
Number of surviving children Unskilled workers Semi-skilled workers Skilled workers
Farmers Elite and middle class Unskilled workers Semi-skilled workers Skilled workers
Farmers Elite and middle
class
Probability of an additional birth Median interval to subsequent birth (in days)
1→2 1→2
0 0.957 0.929 0.974 0.938 0.932 443 460 448
1 0.912 0.881 0.867 0.917 0.838 672 706 699 642 757
2→3 2→3
1 0.941 0.864 0.907 0.917 0.824 626 597 564 548 637
2 0.818 0.798 0.646 0.836 0.708 790 781 794 689 808
3→4 3→4
1 0.971 0.880 689
2 0.898 0.860 0.848 0.887 0.750 674 642 714 627 710
3 0.802 0.767 0.754 0.811 0.708 841 821 795 752 807
4→5 4→5
2 0.785 0.923 0.778 0.837 712
3 0.863 0.835 0.806 0.795 0.760 756 819 672 709 790
4 0.745 0.728 0.749 0.780 0.695 811 882 776 713 773
5→6 5→6
3 0.878 0.750 0.833 0.822 726 587 725
4 0.771 0.779 0.811 0.765 0.772 769 838 742 760 638
5 0.776 0.767 0.766 0.796 0.727 809 757 743 737 759
6→7 6→7
3 0.853 689 656 730
4 0.773 0.743 0.938 0.800 790 742 713 700 848
5 0.844 0.726 0.746 0.747 0.775 766 704 750 734 698
Table 8: Probability of an additional birth (x →x+1) and median birth interval (in days) by parity and survival status of all previous children, by religion of the couple
Number of surviving children Both Liberal Protestant Both Catholic At least one parent Orthodox Protestant
Other Both Liberal Protestant
Both Catholic
At least one parent Orthodox Protestant
Other
Probability of an additional birth Median interval to subsequent birth (in days)
1→2 1→2
0 0.922 0.960 0.947 0.969 455 412 458 440
1 0.865 0.921 0.894 0.815 772 586 705 756
2→3 2→3
1 0.892 0.944 0.881 0.822 625 570 577 670
2 0.729 0.885 0.808 0.690 878 658 811 825
3→4 3→4
1 0.897 0.889 0.897 618 515 566
2 0.814 0.887 0.867 0.778 751 597 731 712
3 0.709 0.858 0.775 0.681 879 699 829 846
4→5 4→5
2 0.679 0.866 0.938 0.840 667 537 677
3 0.807 0.838 0.852 0.720 834 634 806 744
4 0.664 0.817 0.729 0.683 839 691 835 828
5→6 5→6
3 0.881 0.857 0.783 0.781 655 636 686
4 0.785 0.822 0.713 0.670 828 633 769 798
5 0.741 0.829 0.751 0.669 829 711 806 810
6→7 6→7
4 0.766 0.793 0.805 0.903 705 604 707 818
5 0.683 0.837 0.763 0.797 850 661 793 767
6 0.676 0.772 0.727 0.653 788 669 856 781
7. Conclusions
with a lowering of the ages at the birth of the last child, and at a later stage with a gradual shortening of the reproductive period due to higher ages at the birth of the first child. Throughout the period studied, Dutch couples appear to have been aware of the implications of having too many children. There was a clear childhood survival effect on reproduction, on the chances of having another child, and on the length of the intervals between births, which indicates that this variable was crucial for fertility decisions. Although the number of surviving children already had a bearing on the likelihood of having an additional child and on the length of the intervals between births around the onset of the demographic transition, the pattern was much stronger after 1900. There were rather consistent and expected differences in the reactions to the survival of children by social class and religious group. Whereas skilled workers were rather sensitive to the number of surviving children, farm families were much less likely to have allowed their chance to have another child and the length of the intervals between births to have been affected by the number of surviving children. Liberal Protestant couples differed from Orthodox Protestant and Catholic couples in their reactions to the increase in the number of children who survived.
the effective reproductive period from almost 15 years to approximately six years in both cases, and a lengthening of most of the birth intervals in the two contexts beginning in 1910-1920, when the number of children ever born dipped below five.
However, in both the Netherlands and Spain, the familial experience of childhood survival was central in determining reproductive strategies. Here the similarities in the results are striking, and appear in both the likelihood of having an additional birth and the length of the birth interval. The existence of these patterns of mortality-fertility tradeoffs suggests that, in both the Netherlands and Spain, couples were making conscious reproductive decisions based on an ideal family size, and that this size tended to grow smaller over time. This does not mean that these goals were always realized— as chance, especially related to childhood survival, was always important—but it does imply that they made an effort to control family size. Our results also seem to suggest that couples were increasingly successful on this count, and that their desired family size became progressively smaller. By the 1930s, the ideal size among married couples had become rather small indeed (near or below three children) (Van Bavel 2010). Despite having started on this path much later, by the 1930s the reproductive preferences of couples in Spain were quite similar to those of the Netherlands.
The fundamental premise underlying this paper has been that the key variable for understanding the demographic transition and fertility limitation is net family size, not the number of children ever born. Studies based on childbirths incorrectly assess the economic, social, and even cultural implications of childbirth for family life, because these implications are determined by the actual family size. A second premise was that, to the extent that people may have been able to condition their fertility outcomes in terms of their own mortality experience, it is possible to talk about the existence of reproductive strategies. We can imagine that, in the early stages of the demographic transition, we would have seen mostly ad hoc strategies with only approximate goals regarding the ideal (net) family size; and that in the later stages, this would no longer be the case. In both cases, as mortality dipped to ever-lower levels, it appears that we are dealing with conscious decisions that were made at different moments of people’s reproductive lives.
Our findings on the large differences in the fertility reactions to (changing) mortality strongly support the assertions that there were “multiple fertility declines” (Szreter 1996: 360), “a variety of paths towards lower fertility” (Garrett et al. 2001: 322), “many patterns (…) in the overall decline” of fertility (Gillis, Tilly and Levine 1992: 4)—ideas that have acquired prominent places in the approaches to the historical fertility decline (Szołtysek 2007).
the ability of couples to think about long-term goals; their ability to perceive the way the survival or death of their offspring affects family size and family well-being over the short, medium, and long term; and the degree to which they are willing to make decisions to achieve those long-term goals—in other words, whether they are passive or active with respect to those goals and present realities. Our study showed that people in all social classes and from all religious groups reacted to some extent to the rise in survival levels, and that they did so increasingly over time. A more efficient system of reproduction was the result of this process.
The mortality-fertility link appears to have been strongest for couples who belonged to “other” religions, and for those among whom at least one of the spouses was a Liberal Protestant. With respect to occupation, the link was strongest among skilled workers and the elite. The link was less strong or absent for couples among whom both spouses were Catholic, and for couples who belonged to the unskilled and farmer occupational groups. The mortality-fertility link was strongest among those social classes and religious groups with the lowest levels of childhood mortality. Although the increase in the survival of children was the most important explanatory variable for the fertility level of the various groups, groups also differed in the degree to which they were implementing a more active strategy to react to changing survival prospects.
should maintain their strength in order to carry out their social justice and charitable duties. Moreover, realistic perceptions of health risks and ways to prevent them have been hampered by the greater vulnerability of Catholicism to popular cults involving distorted sacramental acts, which has led to more interest in the extra-medical treatment of illness.
Qualitative statements confirm this view for the Netherlands. A prominent Catholic writer (Truyen 1918a: 114) was among those who noted, in the first decade of the 20th century, that Dutch Catholics worried less about high infant mortality than other groups, and were right to do so as “low birth rates are more worrying than high infant mortality.” He even stated that the Catholic woman, “being averse to Neo-Malthusian ideas, accepted the burden and the risks of motherhood rather than being unfaithful to her natural and religious obligations; she deserves, consequently, in particular as a mother, our fullest appreciation; this religious, moral, and socially-principled women (...) who, merely because she, with those principles, gave life to many children and thus also lost more children than the mothers of small families, was called an inferior mother who neglected her duties, being an undeserved blame” (Truyen 1918b: 142).
The Protestant, mainly Calvinist position was different. Calvinist ethics, which demanded that believers work to honor God in a disciplined manner while employing continuous self-control, is implicitly related to a higher prevalence of health-promoting actions, in line with Weber's classical analysis of the Protestant life style, characterized by rationality and self-discipline. The individual’s trust in God does not imply fatalism, but rather the active participation of man: a sound and fair trust in God’s goodness does not suppress the intelligent foresight of the believer—indeed, it requires it, especially if he has social and familial responsibilities (Perrenoud 1974). The conception of work as a calling, the accompanying moral obligation to perform one’s calling to the best of one’s ability, and the nurturing of an ascetic spirit are closely identified with Calvinism, and may have led to the development of a worldview that emphasized involvement with and mastery over the real world. In addition, the belief in Scripture as the basis of doctrine led to an emphasis on Bible-reading among the laity, for which literacy obviously was a prerequisite. One consequence was a higher level of literacy, which may have worked in various ways to open the path to fertility control (McQuillan 1999). Improvements in education increased access to and acceptance of information about both contraception and child care, and fostered the replacement of a fatalistic attitude with a conviction that individuals could exercise control over their lives, their work, and the health and opportunities of their offspring (Thornton and Olson 1997).
question of whether mankind was allowed to fight the disease by resorting to worldly means. It has frequently been observed that the religious attitudes toward disease among Jews were less fatalistic and more effective in both curing and restricting the spread of disease (Reynolds and Tanner 1983). It was the duty and moral obligation of a Jew to use every possible resource to overcome disease and to maintain personal health. The alleged promptness with which Jews sought medical attention, and their purported willingness to accept new preventive measures and therapies, may also have stemmed from this attitude (Sawchuk, Herring and Waks 1985).
Differences in the degree of fatalism were also noticed between, for example, workers in unskilled occupations, farmers, and the elite. In general, it appears that workers whose income depended on their labor did not have a clear perspective on the acquisition of property. Yet within the working class, large differences existed between unskilled, semi-skilled, and skilled workers. Many unskilled individuals worked as day laborers and lacked the security of a permanent position. This uncertainty of income and position could easily lead to a lifestyle characterized by a more general indifference to the future and a habit of living from one day to the next. The laboring class were assumed to lack deliberate thought, order, and thrift (Van Poppel and Nelissen 1999). In their attitudes toward the life and death of children, fatalism dominated, according to numerous accounts of contemporary medical doctors and other observers of the conditions of this social class in the 19th century (Donkersloot, Van Hengel and Snijders 1880). Skilled laborers had more permanent positions, and the well-being of their families could easily be endangered by having unlimited numbers of children. The elite reached their positions in part because they were keenly aware of the strategies and the implications of events in life. For the elite and the middle class, who invested in education, built careers, and worked to ensure that they would have a secure and steadily increasing income in the years ahead, long-term planning for the future and prudence were the norm (Banks 1954).
It is therefore not surprising that the Jews, the Liberal Protestants, the skilled, and the elite were at the cutting edge of new developments. These leaders in the process of change tended to be people with the ability to think abstractly, to set and pursue long-term goals, and, of course, to care for their young children and to have fewer children than other groups in society.
the changed composition of the sample after 1900 (i.e., including the high-fertility southern provinces), or (c) both. The same applies to the time trends in the age at first birth and at the end of the reproductive period.
Second, some important factors have not yet been taken into account. Age at marriage, for example, is not controlled for, even though it is an important determinant of parity progression, and it was a factor that was changing during the study period (Shepherd et al. 2006). Third, perceptions of mortality were not based only on the experiences of the couples themselves and of their family and friends. We might also expect to find community-level effects, as rates of infant and child mortality in a community might have affected the behavior and attitudes of both married couples who lost a child, and those who did not. For example, if infant mortality levels are high, even couples who never suffered the loss of a child might fear such a loss, and decide to have additional children as insurance against risk (Heer and Wu 1978) Eventually, we hope to be able to take this factor into account by including municipal data on infant mortality in the analysis.
References
Alter, G. (1988). Family and the female life course: the women of Verviers, Belgium, 1849-1880. Madison: The University of Wisconsin Press.
Anderton, D.L. and Bean, L.L. (1985). Birth spacing and fertility limitation: A behavioral analysis of a 19th-century frontier population. Demography 22(2):
169-183. doi:10.2307/2061176.
Banks, J.A. (1954). Prosperity and parenthood. A study of family planning among the Victorian Middle Classes. London: Routledge and Kegan Paul.
Bhat, M. (1998). Micro and macro effects of child mortality on fertility: the case of India. In: Montgomery, M. and Cohen, B. (Eds.). From death to birth: mortality decline and reproductive change. Washington DC: National Academy Press:
339–383.
Carlsson, G. (1966). The decline of fertility: innovation or adjustment process.
Population Studies 20(2): 149-174.
Centraal Bureau voor Genealogie (2009). Persoonskaarten en persoonslijsten. http://www.cbg.nl/download/cbg_nl_persoonskaarten_200901.pdf.
Chesnais, J.C. (1986). La transition démographique. Etapes, formes, implications économiques. Paris: Presses Universitaires de France.
Cleland, J. (2001). The effects of improved survival on fertility: A reassessment. In: Bulatao, R.A. and Casterline. J.B. (Eds.). Global Fertility Transition. A Supplement to Vol. 27 of Population and Development Review. New York:
Population Council: 60-92.
Coale, A.J. (1973). The demographic transition reconsidered, International Population Conference Vol. 1. Liege: International Union for the Scientific Study of
Population: 53-72.
Cohen, B. and Montgomery, M. (1998). Introduction. In: M. Montgomery and B. Cohen (Eds.). From death to birth: mortality decline and reproductive change.
Washington, DC: National Academy Press: 1-38.
Diels, A. (1951). Opvattingen van ondertrouwde vrouwen omtrent de grootte van haar toekomstig gezin. (I Amsterdam, Rotterdam en 's Gravenhage). Amsterdam: Instituut voor sociaal onderzoek van het Nederlandse volk.
Nijmegen, Tilburg en Utrecht). Amsterdam: Instituut voor sociaal onderzoek van het Nederlandse volk.
Donkersloot, N.B., Van Hengel, J.F., and Snijders, C.J. (1880). Eerste verslag der commissie voor het onderzoek van den invloed der begrafenisfondsen op de kindersterfte in Nederland. Nederlandsch Tijdschrift voor Geneeskunde 16:
357-377.
Dye, N.S. and Smith, D.B. (1986). Mother love and infant death, 1750-1920. The Journal of American History 73(2): 329-353. doi:10.2307/1908225.
Ellison, P.T. (2001). On Fertile Ground: A Natural History of Human Reproduction.
Cambridge MA: Harvard University Press.
Engelen, T.L.M. and Hillebrand, J.H.A. (1986). Fertility and nuptiality in the Netherlands, 1850–1960. Population Studies 40(3): 487-503. doi:10.1080/0032
472031000142376.
Fisher, K. and Szreter, S. (2003). ‘They prefer withdrawal’: The choice of birth control methods in Britain, 1918-1950. Journal of Interdisciplinary History 34(2):
263-292. doi:10.1162/002219503322649507.
Flinn, M. (1981). The European Demographic System, 1500-1820. Baltimore, MD:
Johns Hopkins University Press.
Friedlander, D., Eisenbach, Z., and Goldscheider, C. (1980). Family size limitation and birth spacing: The fertility transition of African and Asian immigrants in Israel.
Population and Development Review 6(4): 581-593. doi:10.2307/1972927.
Friedlander, D., Okun, B.S., and Segal, S. (1999). The demographic transition then and now: processes, perspectives, and analyses. Journal of Family History 24(4):
493-534. doi:10.1177/036319909902400406.
Galloway, P.R., Lee, R.D., and Hammel, E.A. (1998). Infant mortality and the fertility transition. In: Montgomery, M. and Cohen, B. (Eds.). From death to birth. Mortality decline and reproductive change. Washington DC: National Academy
Press: 182-226.
Garrett, E., Reid, A., Schürer, K., and Szreter, S. (2001). Changing family size in England and Wales. Place, Class and demography, 1891-1911. Cambridge:
Cambridge University Press. doi:10.1017/CBO9780511495816.