DEMOGRAPHIC RESEARCH
VOLUME 30, ARTICLE 13, PAGES 377-412
PUBLISHED 6 FEBRUARY 2014
http://www.demographic-research.org/Volumes/Vol30/13/ DOI: 10.4054/DemRes.2013.30.13
Research Article
Ethnic differences in integration levels and
return migration intentions:
A study of Estonian migrants in Finland
Kristi Anniste
Tiit Tammaru
© 2014 Kristi Anniste & Tiit Tammaru.
This open-access work is published under the terms of the Creative Commons Attribution NonCommercial License 2.0 Germany, which permits use, reproduction & distribution in any medium for non-commercial purposes, provided the original author(s) and source are given credit.
1 Introduction 378
2 Diverging views on integration and return migration 380
2.1 Integration and return migration: A negative relationship 381
2.2 Integration and return migration: A positive relationship 382
2.3 Ethnic differences in integration and return migration 384
3 Emigration and the formation of the Estonian diaspora in Finland 385
4 Data and methods 388
5 Results 392
5.1 Sociocultural integration 392
5.2 Structural integration 393
5.3 Regression analysis on intentions regarding return migration 397
6 Summary and discussion 401
7 Acknowledgments 404
Ethnic differences in integration levels and return migration
intentions: A study of Estonian migrants in Finland
Kristi Anniste1
Tiit Tammaru2
Abstract
BACKGROUND
Immigrants‘ desire to stay in the host country or return to the country of origin depends largely on the balance between their degree of integration in the host country and their level of attachment to the country of origin. Ethnic diversity is growing rapidly in European countries, including in migrant-sending countries. It may be expected that members of the ethnic minority population and the majority population have different degrees of willingness to engage in return migration depending on their different levels of attachment to their country of origin.
OBJECTIVE
This study examines differences in the return migration intentions of members of the ethnic minority population and members of the majority population in the sending country. Specifically, we seek to answer two main research questions: (1) To what extent do members of the sending country‘s ethnic minority and majority groups differ in their desire to return to the sending country? (2) How does the degree of integration in the host country shape differences in the return migration intentions of members of the sending country‘s ethnic minority and majority groups?
METHODS
We use representative survey data on Estonian migrants in Finland and apply binary logistic regression on our data.
RESULTS
Results suggest that there are important differences in the integration levels and in the return migration intentions of the ethnic Estonians and the ethnic Russians from
1 Centre for Migration and Diaspora Studies, Department of Geography, University of Tartu Vanemuise
46, Tartu 51014, Estonia. E-Mail: [email protected].
2
Estonia living in Finland. Despite being much better integrated into Finnish society than ethnic Russians, the ethnic Estonians are much more likely to want to return to Estonia. Indeed, our study shows that ethnicity is one of the most important personal characteristics predicting return migration.
CONCLUSIONS
There is no obvious negative relationship between integration and return migration. Being a member of the sending country majority population is associated with a stronger intention to return, even when the migrant is well integrated into the new homeland.
1. Introduction
Migration from eastern to western Europe has led to a considerable loss of population in some eastern European countries over the past two decades (Apsite 2013; Anniste et al. 2012; Kahanec 2012). As Ivlevs and King (2012) have noted, many eastern European countries that won independence at the beginning of the 1990s have since lost a share of their people. Furthermore, since the individuals who leave the new member states of the European Union (EU) are more likely to be highly educated than those who stay, the discussions on east-west migration in Europe tend to revolve around the issues of brain drain, brain gain, and brain waste (Kahanec et al. 2010; Olofsson and Malmberg 2011; Olofsson 2012). The grim reality of high emigration rates can, however, be relieved by return migration, ultimately leading to a brain gain for the sending countries rather than for the receiving countries3 (Mayr and Peri 2009). This paper brings the ethnic dimension―i.e., being a member of a majority population or a minority population of the sending country―into the discussion on return migration. At the broadest level, the decision to stay or return depends on the balance between an immigrant‘s degree of integration in the host country and the strength of his or her attachment and ties to the country of origin. While there are studies on the onward migration of immigrants from one EU member state to another (e.g., Aptekar 2009; Nekby 2006), there are almost no studies on the extent to which members of minority ethnic groups and members of the majority population of the sending countries differ in their desire to return to the sending country. This trend is, however, a new and very interesting layer in the European migration system that is emerging in the
3
context of the free labour movement framework and the increased ethnic diversity in the EU. For onward migrants, their new homeland is a third country because the country of origin is not their historical homeland4. Members of sending country minority groups are more footloose (Ivlevs 2013): because they are less attached to the countries in which they live, they tend to be more responsive to welfare differences between European countries in the context of the free movement of labour within the EU. Members of minority groups may therefore be more likely to ―trickle up‖ into more attractive destination countries in Europe than members of the majority populations of EU countries.
Ethnic differences in return migration intentions are also closely related to the relationship between integration and return migration, a topic of migration research that has recently been revived by de Haas and Fokkema (2011). The integration of an immigrant into the host country evolves alongside his or her decision about whether to stay or return. Furthermore, the literature has identified a number of dimensions of the integration process, including the distinction between structural and sociocultural integration (Heckmann 2005; Fokkema and de Haas 2011). Because of these different dimensions the relationship between integration and return migration is complex, and both negative (a higher level of integration is related to a lower degree of willingness to return) and positive (a higher level of integration is related to a higher degree of willingness to return) associations between the two processes can emerge (de Haas and Fokkema 2011). It is therefore reasonable to expect that the balance of these factors can differ between members of the sending country‘s majority and minority ethnic groups, and that these differences can have varying effects on the migrants‘ intentions to return to the home country.
This study examines the differences in the return migration intentions of members of the ethnic minority population and of the majority population of the origin country, taking into account the extent to which they are integrated into their new homeland/host country. The central research questions this paper seeks to answer are therefore as follows:
1. How great are the differences in the return migration intentions of the members of the sending country‘s ethnic minority and ethnic majority groups?
4 We will not use the term ―third country‖ since it already has a different meaning in migration research.
2. How does integration in the host country shape differences in the desire to return for members of the origin country‘s ethnic minority and majority groups?
Within the context of east-west migration in Europe (Castles and Miller 2009; Cook, Dwyer, and Waite 2011; Kopnina 2005), the ethnic dimension is an important consideration for the Baltic countries (Ivlevs 2013; Anniste et al. 2012). Recently, King and Raghuram (2013) have also highlighted the need for quantitative survey-based studies that are specifically designed to examine the different types of migration. In our analysis, we use data from a representative survey to study immigrants in Finland who come from Estonia. Ethnically, these Estonian origin migrants fall into two main groups: ethnic Estonians and other (minority) ethnic groups, most of whom speak Russian or other Slavic languages as their mother tongue. Estonian, unlike Russian, is very similar to the Finnish language (Praakli 2011). Ethnic Russians living in Estonia face integration problems, and their level of attachment to Estonia is thus weaker than that of ethnic Estonians (Vihalemm 2012). However, Russians also have greater difficulties than Estonians in integrating into Finnish society, because of the relatively small linguistic distance between the Estonians and the Finns (Sarvimäki 2011). Thus, the case of Estonian migrants in Finland can provide us with interesting insights into how the issues of sending country ethnic minority-majority status, integration, and return migration interact with each other in increasingly complex ways within the emerging European migration system that allows for free labour mobility.
2. Diverging views on integration and return migration
in important life domains, such as the labour market (economic integration), living conditions (housing integration), and the acquisition of citizenship (political integration). Neither sociocultural nor structural integration necessarily require immigrants to give up their cultural and ethnic identities in a way of assimilation, but they do imply that immigrants are included in the majority society of the host country (Arends-Tóth and van de Vijver 2006). Usually, a negative relationship between integration and return migration is assumed: the greater their degree of integration, the less likely immigrants are to want to return. However, a recent study by de Haas and Fokkema (2011) called into question this intuitively appealing view by showing that a positive relationship between integration and return migration might exist as well: immigrants who are structurally better integrated into the host society may also be more willing to return home.
2.1 Integration and return migration: A negative relationship
Meurs 2009). Thus, immigrants who marry a member of the host society tend to be more willing to stay.
While intermarriage is an important indicator of integration, research on return migration—especially in the context of east-west migration in Europe—has shown that the degree of skills and labour market integration also plays a major role in an immigrant‘s decision about whether to stay or return (Zaiceva and Zimmermann 2012; Olofsson and Malmberg 2011; Mayr and Peri 2009). In general, having a full-time job has a negative effect on return migration, and unemployed immigrants (i.e., those who fail to integrate economically) are more likely to return to their country of origin (Constant and Massey 2002; Schmidt 1994; Velling 1994; Jensen and Pedersen 2007; Bijwaard, Schluter, and Wahba 2011).
Thus, return migrants are, in general, less successful economically than ―the stayers‖ (Borjas 1989; Massey 1987; Lindstrom and Massey 1994; King 2000; Jensen and Pedersen 2007; Bijwaard, Schluter, and Wahba 2011), and return migration could be seen as a corrective move resulting from ―failed migration‖ (DaVanzo and Morrison 1981, 1982; Massey and Espinoza 1997). Economic integration facilitates homeownership, which in turn further facilitates permanent settlement in the host country (Alba and Logan 1992). According to neoclassical migration theory, immigrants become less willing to return as they make greater investments in human capital. After successfully navigating the process of sociocultural and structural integration, immigrants become increasingly productive, and their contributions to the labour market of the host country become comparable to those of the natives. At the same time, their ties to their country of origin gradually weaken (de Haas and Fokkema 2011).
2.2 Integration and return migration: A positive relationship
2011). De Haas and Fokkema argued that being better integrated into the host society, especially economically, provides immigrants with more resources for communicating with and visiting friends and family in their home country.
Studies on the mobility patterns of highly skilled workers and university graduates who study abroad have provided further evidence of a positive relationship between integration and return migration. For example, Jasso and Rosenzweig (1988) and Gundel and Peters (2008) found that highly qualified immigrants are more likely to return than less skilled migrants. Findlay et al. (2012) have even suggested that an international, highly mobile class of managers and professionals have emerged whose skills are in high demand, and who are willing to move to pursue interesting career challenges. These highly skilled migrants are economically successful and are well integrated into the labour market of the host country, but they are not necessarily more willing to settle in their new homeland than less skilled migrants. Furthermore, they are not necessarily well integrated from a sociocultural perspective. The situation is often different for students, a category of international migrants that is growing all over the world(Findlay et al. 2012; King and Raghuram 2013). Students are often well integrated socioculturally (they use local social networks and are often proficient in the local language), which should make it relatively easy for them to establish themselves in the host country labour market. However, research has shown that most foreign students return to their homeland after finishing their studies (Bijwaard 2010).
in order to get a job, earn higher wages, or diversify the household‘s income sources (Castles and Miller 2009). This theory further asserts that these migrants and households have an interest in the migrants being well integrated in the host country so they can reap the maximum benefits from the higher earnings of the household members living abroad (de Haas and Fokkema 2011). The money these immigrants earn is generally remitted back home, and is often used to improve the living conditions of families, households, and communities in the country of origin (Elrick 2008; Vullnetari and King 2011). During times of economic crisis and increasing unemployment in the origin countries, these kinds of household strategies might be especially important (cf. Apsite 2013). De Haas and Fokkema (2011:24) therefore concluded:
―Importantly, this turns conventional interpretations of return migration upside down; that is, from an indication or result of integration failure to a measure of success. Particularly within a NELM perspective, non-achievement of the goal of return migration due to low income, unemployment or high costs will then lead to a prolonged stay. Permanent settlement then becomes the end result of repeated postponement of return because of integration ‗failure‘.‖
In this paper, our goal is to bring the ethnic status of migrants in the sending country―i.e., whether they were members of the majority or the minority population―into this interesting, emerging debate on whether the relationship between integration and return migration is positive or negative. We will explore this debate in the following section.
2.3 Ethnic differences in integration and return migration
minorities tend to be less attached to their sending country than members of the majority population.
For the immigrant sending countries with large ethnic minority populations, research on the emigration and return migration patterns of these groups is essential if we are to understand the relationship between integration and return migration. For the immigrants and ethnic minorities of the sending country, the new country of residence is the third country (see also footnote 2). Their weaker personal ties to a country of origin that is not their historical homeland, and their lower degree of attachment to this country relative to that of the majority population, could reduce their willingness to return, especially if the country to which they moved is more prosperous. Furthermore, large-scale disruptions of the political order, such as the end of the Cold War can lead to a redrawing of political borders, and the carving out of new ethnic geographies within the new nation states may further weaken such ties. The break-up of the Soviet Union and of Yugoslavia are the most important recent political disruptions that have shaped the evolving east-west migration system in contemporary Europe. For example, Hughes (2005), in a study of the Russian-speaking minorities in Estonia and Latvia, asserted that the emigration of these minorities from these former member states of Soviet Union was likely to increase. He further predicted that members of ethnic minority groups who have weaker historical roots to the country they left behind, and who experienced discrimination in the sending country, are also less likely to return. In the following section, we will discuss the context of Estonia in greater detail.
3. Emigration and the formation of the Estonian diaspora in
Finland
Estonia, Russians experienced a significant loss of political, managerial, economic, social, and cultural status (Lindemann and Kogan 2013; Lindemann and Saar 2009; Ohliger and Münz 2003; Vishnevsky 2003). According to the 2011 census, unemployment was 9% among ethnic Estonians and 17% among ethnic Russians living in Estonia (Statistics Estonia 2013).
Until the very end of the Soviet Union, Estonia―a country which was grouped together with the two other Baltic countries of Latvia and Lithuania under the heading of the ―Soviet West‖―was a country of immigration. But after the break-up of the Soviet Union, Estonia became a country of emigration (Anniste et al. 2012; Tammaru, Kumer-Haukanõmm, and Anniste 2010). Many members of ethnic minority groups saw emigration as a means of escape from discrimination in Estonia. In the 1990s, especially at the beginning of the decade, the ethnic Russians who migrated mainly returned to Russia. Based on census estimates, 24% of the ethnic minority population, or about 144,000 people, left Estonia in the 1990s. The net migration of ethnic Estonians was negative 1%, or about 11,000 people (Table 1). The emigration pattern of Estonia changed completely in the 2000s, especially in the second half of the decade. Estonia joined the European Union in 2004, which significantly simplified moves to older EU member states. Although the negative net migration of the ethnic minority population (-25,000 people, or a loss of 6%) was lower than it was in the 1990s, members of ethnic minority groups were still overrepresented among the emigrants.
Table 1: Components of population change, 1989–2000 and 2000–2012 (numbers are rounded)
Ethnic Estonians Ethnic minorities Total
Population 1989 963 000 602 000 1 565 000
Population 2000 930 000 440 000 1 370 000
Change 1989–2000 -33 000 -162 000 -195 000
Natural change -22 000 -18 000 -40 000
Net migration (residual) -11 000 -144 000 -155 000
Population 2000 930 000 440 000 1 370 000
Population 2012 902 000 392 000 1 294 000
Change 2000–2012 -28 000 -48 000 -76 000
Natural change -10 500 -23 000 -33 500
Net migration (residual) -17 500 -25 000 -42 500
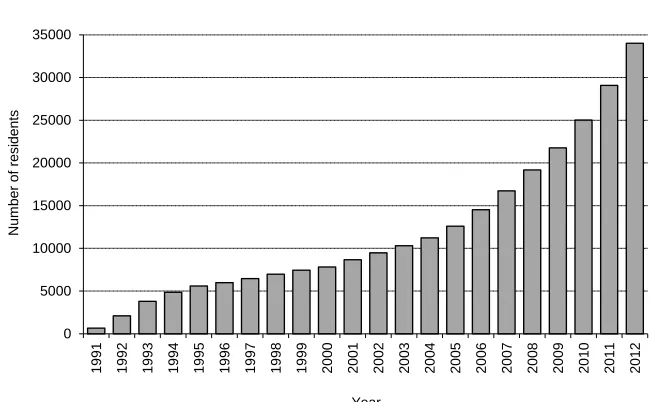
In the 2000s, the dominant migration trend among members of ethnic minority groups in Estonia was no longer to return to their historic homeland, but rather to emigrate to western countries, mainly to one of the older EU member states. While the bulk of eastern Europeans who have been migrating within Europe have been heading to the United Kingdom, Finland continues to be by far the most important destination for Estonian migrants (Anniste et al. 2012). There were almost no Estonian migrants in Finland in 1991, but today they constitute the largest Estonian migrant community in the world. Moreover, since 2010, Estonian migrants have outnumbered Russian migrants in Finland (Statistics Finland 2013). Estonian migration to Finland started immediately after Estonia regained its independence in 1991, but it increased dramatically after Estonia joined the EU, and has grown further since start of the economic crisis in 2008(Figure 1). Since 1991, a total of around 43,000 individuals have emigrated from Estonia to Finland; and about 8,000 individuals, or 19%, have returned to Estonia. Thus, at the end of 2012, around 35,000 Estonian migrants were living in Finland. Furthermore, many Estonians live and work in Finland on a temporary basis, since it is easy and relatively cheap to commute between the countries (Ahas 2012).
Figure 1: Changes in the number of Estonian immigrants in Finland
Source: Statistics Finland.
The popularity of Finland as a destination country for Estonian migrants can be explained by the following factors: first, Estonia and Finland are neighbouring countries; second, there are significant wealth differences between Estonia and Finland; and, third, the Estonian and Finnish languages are very similar. However, members of Estonian ethnic minority groups have not shown the same interest in emigrating to Finland as ethnic Estonians (Anniste et al. 2012). This is probably because the Russian-speaking minority population of Estonia do not have the linguistic and cultural similarities with the Finns that attract the ethnic Estonians.
However, the fact that Estonians and Russians are the largest immigrant communities in Finland suggests that Russian speakers from Estonia may be meeting and interacting with ethnic Russians from Russia while in Finland. There is even some evidence (based on qualitative information provided by our respondents) of family reunification, as family members who previously lived separately in Estonia and in Russia have moved to Finland so they can live together again. Ethnic Estonians and ethnic Russians do not, however, appear to be integrated into Finnish society to the same extent (Sarvimäki 2011). For example, according to Mannila and Reuter (2009), the risk of social exclusion is three times higher among Russians than it is among Estonians. The differences between the experiences of ethnic Estonian and ethnic Russian migrants in Finland are also partly related to the willingness of native Finns to accept the members of these two ethnic groups. For example, Mannila and Reuter (2009) found that Finns tend to have strong positive attitudes towards Estonians, while their attitudes towards Russians tend to be more neutral. Thus, previous studies suggest that the degree of integration in Finland of ethnic Estonians is higher than that of ethnic Russians. Studying the intentions of Estonian origin immigrants in Finland regarding return migration to Estonia can therefore make an important contribution to the emerging debate, initiated by de Haas and Fokkema (2011), about whether there is a positive or a negative relationship between integration and return migration.
4. Data and methods
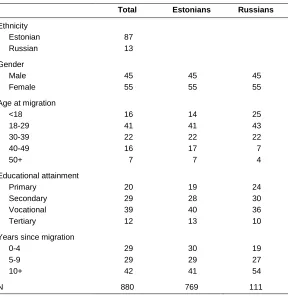
research on this group. In our analysis, we have chosen to focus on the two largest ethnic groups of migrants living in Finland: ethnic Estonians (n=769) and ethnic Russians (n=111). The ethnicity of the migrants is based on self-definition. The ethnic Russians in the survey were all born in Estonia. The socio-demographic characteristics of these two groups differ somewhat. For example, compared to the ethnic Estonians, the ethnic Russians were more likely to report that they had arrived as children, had lived in Finland for at least 10 years, and had no more than a primary education (Table 2). In the questionnaire, data were also collected on the respondents‘ circumstances prior to migration in Estonia, as well as on their circumstances shortly after arrival and at the time of the survey. These data allow us to cover issues related to structural integration. The respondents were also asked about their level of sociocultural integration and whether they intend to return to Estonia. Thus, our data enable us to analyse several indicators of structural integration (employment, housing, education, citizenship) and sociocultural integration (social intercourse, friendship, marriage) which may be expected to affect return migration intentions.
Table 2: Main characteristics of the research population (%)
Total Estonians Russians
Ethnicity
Estonian 87
Russian 13
Gender
Male 45 45 45
Female 55 55 55
Age at migration
<18 16 14 25
18-29 41 41 43
30-39 22 22 22
40-49 16 17 7
50+ 7 7 4
Educational attainment
Primary 20 19 24
Secondary 29 28 30
Vocational 39 40 36
Tertiary 12 13 10
Years since migration
0-4 29 30 19
5-9 29 29 27
10+ 42 41 54
N 880 769 111
Source: Sample Survey.
very easy and cheap by means of ferries which travel between Estonia and Finland numerous times a day. It would be interesting to learn whether the negative relationship between integration and return migration also applies to neighbouring countries, and which dimensions of sociocultural integration are affected. Understanding these sociocultural factors would be especially helpful when designing integration and migration policies in both the origin and the destination countries.
We have chosen to use separate indicators of sociocultural integration in our study in order to shed light on how they relate to the intention to return. Model 2 includes both ethnicity and all of the background variables, such as gender, age at migration, years lived in Finland, and education. The final Model 3 adds integration variables. As a robustness check (see Mood 2010), we applied a linear probability regression5 on our binary dependent variable in Model 3, and performed a variance inflation factor (VIF) test for multicollinearity. We then removed from our models all of the variables outside of the conservative VIF value range of 0.20 to five, as this exercise revealed that there were some problems with multicollinearity in our data, such as between proficiency in the Finnish language and the home language. Sociocultural integration in our final model (Model 3) is measured through family relationships (has Finnish partner=1, otherwise=0) and everyday contacts with Finns (has daily contacts with Finns=1, otherwise=0). Attachment to the home country is measured by the frequency of visits to Estonia (visits weekly=1). A recent study by Engbersen et al. (2013) showed that there is no strong relationship between integration in the host country and maintaining contact with the country of origin. The dimensions of structural integration include employment, homeownership, and citizenship (the variables can be found in Table 3 in the descriptive results section). We were also able to construct variables that reflect changes in the structural integration variables, such us occupational mobility in Finland and changes in housing tenure; but since none of these variables were found to be an important predictor of return migration, they were not included in our final model. In addition, we were unable to detect a significant association between satisfaction variables (work life, housing) and the respondents‘ intentions regarding return migration.
Immigrants generally decide whether to stay or to return based on the balance between their degree of integration in the host country, and the strength of their attachment and ties to the country of origin (de Haas and Fokkema 2011). We measured ties to the country of origin through the frequency of visits to Estonia. We did not ask specific questions about integration in the country of origin, as our focus was on the differences between the two ethnic groups in terms of their return migration intentions, and because ethnicity itself captures the migrants‘ level of
integration into Estonian society to a large degree. The question of what effect the degree of integration in the origin country has on the return migration intentions of members of an ethnic minority group is interesting in itself. However, this question should be addressed in future studies which draw upon a larger sample or an over-sample of the minority population, or which explicitly focus on the minority group.
5. Results
5.1 Sociocultural integration
Table 3 presents indicators of sociocultural integration for both the ethnic Estonians and the ethnic Russians who migrated from Estonia to Finland. As expected, we found that ethnic Estonians are, from a sociocultural perspective, better integrated into Finnish society than the ethnic Russians (all of the differences were statistically significant). This was found to be the case for all of the dimensions of sociocultural integration we measured in this study. More specifically, the results showed that, compared to the ethnic Russians, the ethnic Estonians have more personal contacts with native Finns outside of home and work, are more proficient in the Finnish language, are more likely to marry a Finn, and are more likely to speak Finnish at home (i.e., Finnish is one of the languages spoken at home between family members). The findings further revealed that 23% of Estonians are either married to a Finn or have a Finnish partner, and speak Finnish at home. This suggests that a high percentage of Estonians are not just integrated, but are also assimilating into Finnish society. Given these differences in their degrees of sociocultural integration, we might also assume that there are differences between Estonians and Russians living in Finland in their degrees of structural integration.
Table 3: Sociocultural integration of Estonians and Russians living in Finland (share of “yes” responses out of all responses, %)1
Total Estonians Russians
Has everyday non-work contacts with Finns 57 59 40
Fluent in Finnish language 69 72 45
Spouse/partner is Finnish 20 23 5
Speaks Finnish at home 21 23 7
1
5.2 Structural integration
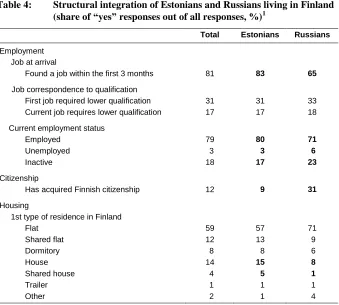
Table 4 presents the descriptive information on the indicators of structural integration for both the ethnic Estonians and the ethnic Russians who migrated from Estonia to Finland, starting with their levels of economic integration. Among ethnic Estonians, 83% started working immediately after arrival, while the respective figure for Russians was 65%. Around one-third of the migrants from Estonia stated that upon arrival in Finland they had to accept a job that was beneath their qualifications, with no differences found between the Estonians and the Russians (Table 4).
Table 4: Structural integration of Estonians and Russians living in Finland (share of “yes” responses out of all responses, %)1
Total Estonians Russians
Employment Job at arrival
Found a job within the first 3 months 81 83 65
Job correspondence to qualification
First job required lower qualification 31 31 33
Current job requires lower qualification 17 17 18
Current employment status
Employed 79 80 71
Unemployed 3 3 6
Inactive 18 17 23
Citizenship
Has acquired Finnish citizenship 12 9 31
Housing
1st type of residence in Finland
Flat 59 57 71
Shared flat 12 13 9
Dormitory 8 8 6
House 14 15 8
Shared house 4 5 1
Trailer 1 1 1
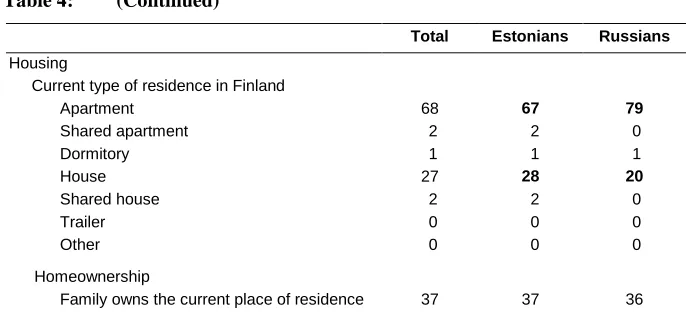
Table 4: (Continued)
Total Estonians Russians
Housing
Current type of residence in Finland
Apartment 68 67 79
Shared apartment 2 2 0
Dormitory 1 1 1
House 27 28 20
Shared house 2 2 0
Trailer 0 0 0
Other 0 0 0
Homeownership
Family owns the current place of residence 37 37 36
1
The percentages in bold indicate a statistically significant difference (p<0.05) between the two ethnic groups. Source: Sample Survey.
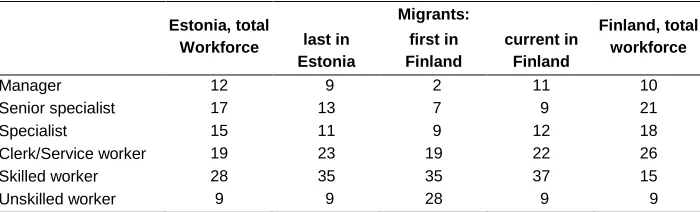
Table 5: Comparison of the occupational structures for migrants from Estonia to Finland, and for the total workforce of Estonia and Finland
Estonia, total Workforce
Migrants:
Finland, total workforce last in
Estonia
first in Finland
current in Finland
Manager 12 9 2 11 10
Senior specialist 17 13 7 9 21
Specialist 15 11 9 12 18
Clerk/Service worker 19 23 19 22 26
Skilled worker 28 35 35 37 15
Unskilled worker 9 9 28 9 9
Sources: Sample Survey, Statistics Estonia, Statistics Finland.
It is, however, interesting to note what happened to the migrants after they had been in Finland for a longer period (Table 5). First, we observed an interesting U-shaped change in the occupational composition. In the survey year, the share of managers and senior specialists was 20%, and the share of skilled and unskilled workers was 46%. These figures are comparable to those for the last job in Estonia. Compared to the breakdown for the total Finnish workforce in 2009, the shares of both managers and unskilled workers were similar, while the shares of skilled workers were significantly higher, and the shares of all of the other occupations were smaller. Second, we found some differences by migrant ethnicity in terms of the ability to climb the occupational ladder in Finland: ethnic Estonians were more successful than ethnic Russians in moving out of unskilled occupations and into managerial positions.
and Peters (2008) found that immigrants who have overcome the bureaucratic hurdles involved in acquiring citizenship are less likely to return.
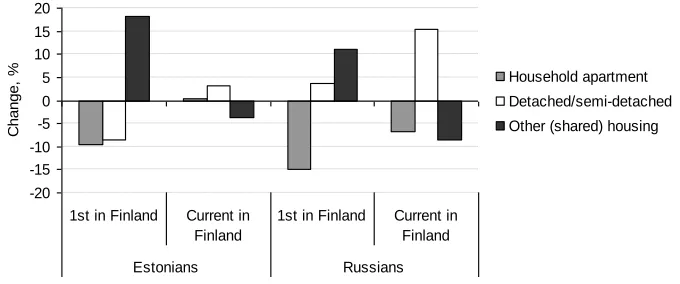
The third dimension of structural integration examined in our analysis was housing integration. Again, our data allowed us to trace longitudinally the changes in respondents‘ housing conditions. The results showed that the respondents‘ pre-migration housing conditions in Estonia were somewhat worse than those of the total population: compared to the population as a whole, the share of the migrants who were living in apartments occupied by members of their own household or in detached or semi-detached houses was smaller, while the share who were living in shared apartments or dormitories was larger (Table 6). The housing conditions in Estonia varied by ethnicity: 66% of the Estonians and 86% of the Russians had lived in apartments before moving to Finland, while 24% of the Estonians and just 5% of the Russians had lived in detached or semi-detached houses. In line with their occupational mobility pattern, the migrants moved several steps down on the housing ladder upon arrival in Finland. This type of downgrading often occurs among immigrants who lack both resources and information about the host country‘s housing market (Clark 1991; Myers and Liu 2005). The results showed that 28% of migrants from Estonia moved into shared apartments or dormitories, and that some even settled in campers or house trailers. There were substantial differences by ethnicity in the migrants‘ housing conditions upon arrival. Interestingly, the Estonians were found to have moved farther down the housing ladder than the Russians. This was probably because their housing conditions had been relatively good in Estonia, and they found it more difficult to find a housing situation similar to the one they had at home (Figure 2). It is also interesting to note that the Russian migrants not only downgraded to a lesser extent than the Estonians; the share of Russians living in a detached or a semi-detached house even increased following migration.
Table 6: Comparison of the housing conditions of migrants from Estonia to Finland, and for the total populations of Estonia and Finland
Estonia, total population
Migrants:
Finland, total population last in
Estonia
first in Finland
current in Finland
Detached/semi-detached 26 22 16 25 55
Household apartment 71 69 56 68 44
Other (shared) housing 3 9 28 7 1
Figure 2: Changes in the distribution of the types of residence by ethnicity (the last residence in Estonia vs. the first in Finland; the last residence in Estonia vs. the current residence in Finland)
Source: Sample Survey
The migrants‘ housing trajectories were similar to their occupational trajectories: the migrants‘ housing conditions underwent a U-shaped change and improved considerably with the length of time spent in Finland. This pattern is often observed among immigrants, as their resources and information about the housing market in their new homeland tend to be poor upon arrival, but improve thereafter (Clark 1991; Myers and Liu 2005). Our findings indicated that the share of migrants living in shared housing decreased from 28% to 7%, and that the shares of people living in their own apartments and in detached and semi-detached houses became comparable to the pre-migration distributions. The improvement in housing conditions was especially pronounced among the Russians: about 20% of them lived in a detached house in the survey year, up from 5% prior to emigration. However, this share was still smaller than the share for the ethnic Estonians (27%).
5.3 Regression analysis on intentions regarding return migration
Nearly one-quarter (24%) of the Estonian migrants surveyed said they intend to return to Estonia. This figure is slightly higher than the share of actual return migrants between 1991 and 2011 (19% have moved back to Estonia). Sharp
-20 -15 -10 -5 0 5 10 15 20
1st in Finland Current in
Finland
1st in Finland Current in
Finland
Estonians Russians
C
h
a
n
g
e
,
% Household apartment
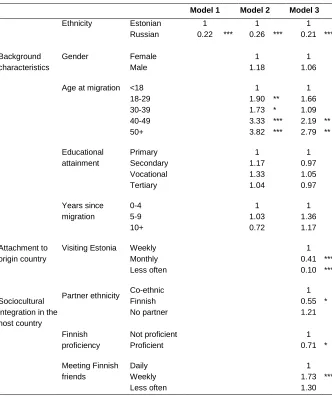
differences by ethnicity were revealed in the intention to return: just 7% of the Russians expressed a desire to return, compared to 28% of the Estonians. Our baseline regression model, in which only ethnicity was included, showed that ethnic Russians had about five times (1/0.22) smaller odds to want to return to Estonia than ethnic Estonians (Model 1, Table 7). In Model 2, we controlled for important background characteristics, including education. Interestingly, the results for ethnicity did not change relative to those of Model 1: again, ethnicity appeared to play an important role in the desire to return to Estonia. The results for the background variables were as follows. The respondents who arrived in Finland as children were the least likely to indicate they wanted to return. Interestingly, the level of education and the number years since migration were not found to be significantly related to the intention to return. When we compared our results with those of de Haas and Fokkema (2011), the most important difference was in education, as they found that members of the most educated migrant group were the most likely to want to return. It seems that, among the third country nationals included in their study, having a higher level of education was associated with having a higher level of mobility. However, our findings suggest that within the EU‘s common labour market, educational differences are not important. In other respects, the findings were qualitatively very similar, with no differences in the willingness to return identified by gender or years since migration.
Table 7: Intention to return (odds ratios). N=880
Model 1 Model 2 Model 3
Ethnicity Estonian 1 1 1
Russian 0.22 *** 0.26 *** 0.21 ***
Background characteristics
Gender Female 1 1
Male 1.18 1.06
Age at migration <18 1 1
18-29 1.90 ** 1.66
30-39 1.73 * 1.09
40-49 3.33 *** 2.19 **
50+ 3.82 *** 2.79 **
Educational attainment
Primary 1 1
Secondary 1.17 0.97
Vocational 1.33 1.05
Tertiary 1.04 0.97
Years since migration
0-4 1 1
5-9 1.03 1.36
10+ 0.72 1.17
Attachment to origin country
Visiting Estonia Weekly 1
Monthly 0.41 ***
Less often 0.10 ***
Sociocultural integration in the host country
Partner ethnicity Co-ethnic 1
Finnish 0.55 *
No partner 1.21
Finnish proficiency
Not proficient 1
Proficient 0.71 *
Meeting Finnish friends
Daily 1
Weekly 1.73 ***
Table 7: (Continued)
Model 1 Model 2 Model 3
Structural integration in the destination country
Finnish citizenship
No 1
Yes 0.67
Homeownership No 1
Yes 0.67 *
Labour market Not working 1
status Manager 2.81 **
Senior
specialist 2.04 **
Specialist 1.72
Clerk/Service
worker 2.50 ***
Skilled worker 1.95 **
Unskilled
worker 2.15 *
-2 Log likelihood 977.59 934.27 846.43
* Significant at 10% level; ** Significant at 5% level; *** Significant at 1% level. Source: Sample Survey
the role of ethnic differences in integration on return migration, we tried interaction effects between ethnicity and all of the integration variables, but none of them turned out to be statistically significant. However, this might have been due to the small sample size.
6. Summary and discussion
In the current study, we have widened the on-going discussion of east-west migration in Europe, which has mainly been focused on socioeconomic dimension (brain drain, brain gain, and brain waste) with ethnic dimension (ethnicity, integration). There are several reasons why it is important to consider the ethnicity component―i.e., whether the migrant is a member of the minority or the majority population of the sending country―when studying migration. First, in countries with large ethnic minority groups, such as the Baltic states, ethnic minorities make up a substantial share of the population. Thus, for these groups emigration is onward migration. Members of ethnic minority groups tend to be more footloose than the ethnic majority population (Ivlevs 2013). After they emigrate, the choice of whether to stay in the new host country or return to the country of origin is rooted in a complex context of migration and integration. Second, as the shares of immigrant and ethnic minority groups are gradually increasing in countries around the world, it is increasingly important that we take these groups into account in migration research. Because they are more mobile than the ethnic majority population, they could start to trickle up into the more prosperous countries of the EU, which is now possible under the conditions of the common labour market. While there are studies on the onward migration of immigrants and minorities (e.g., Aptekar 2009; Nekby 2006), differences in return migration patterns need to be studied more closely in ethnically diverse sending countries. Third, the degree of integration of the various ethnic groups in the destination countries may differ, for example, by the distance between the language of the host country and the language of the respective ethnic group. The primary language spoken by the members of the majority population of the sending country is often more similar to the primary language of the neighbouring country than the languages spoken by the members of minority populations of the sending country. The ability of immigrants to communicate with the local people is often considered the most important single factor that leads to social and economic integration (Dustmann and van Soest 2002).
Russians who were living in Finland, controlling for integration in Finland. For ethnic Estonians who leave Estonia, Finland is the main destination of emigration. For ethnic Russians who leave Estonia, the main migration destination since the dissolution of the Soviet Union has been Russia; they are, however, increasingly moving to European countries, including Finland. Our descriptive results uncovered important differences between ethnic Estonians and ethnic Russians living in Finland in terms of their levels of integration and their intention to return to Estonia. Compared to ethnic Russians, ethnic Estonians are more likely to be proficient in Finnish, to have personal relationships with Finns, and to live with a Finnish partner (to be intermarried). They are also more likely to be well integrated in the labour and housing markets.
(British Council 2013). Thus, the ethnic Russians from Estonia may be less integrated in Finland than the Estonians, but they face even bigger integration obstacles in Estonia. Second, the ethnic Russians may feel some bitterness towards Estonia, as their status in Estonia changed considerably after the break-up of the Soviet Union. Ladõnskaja (2013) compared the situation of Russians in Estonia after the break-up of the Soviet Union in 1991 to that of ―children of a split family.‖ These factors may have intensified the willingness of the ethnic Russians to build a new life in a new country, especially in a country like Finland, which has a stronger welfare system than Estonia.
Most of the integration factors―especially the sociocultural variables―were found to be negatively related to the intention to return. These findings are similar to those of de Haas and Fokkema (2011). Migrants who can communicate fluently in Finnish, who meet Finnish friends on a daily basis, or who live with a Finnish partner tend to prefer staying in Finland to returning to Estonia. Two structural integration dimensions were also found to be negatively related to the willingness to return to Estonia: i.e., having invested time (acquiring Finnish citizenship) or money (buying a home) in the integration process. However, integration in the labour market and return migration were found to be positively related: i.e., migrants who were working were more likely to want to return. Thus, the respondents who expressed a desire to return were more likely to be active and mobile members of society looking to take advantage of the EU common labour market. These results diverge from those of de Haas and Fokkema (2011), who found no differences between working and non-working migrants in their study of third-country nationals from Africa who were living in the EU. This seems to indicate that within the EU and its common labour market, worker mobility has become a norm irrespective of the particular occupation, and that the main demarcation line is between those who do and do not work. Within a common labour market, the migrants who work are more likely than those who do not work to view their stay in a foreign country as a temporary sojourn.
third-country nationals entering the EU (Castles and Miller 2009). Thus, circular migration in Europe appears to be accelerating (Skeldon 2012). This study adds an additional ethnic layer to these circular forms of migration: i.e., relative to members of the minority population of a European country, who are more likely to leave the country for good; members of the majority population of a European sending country are more likely to join the intra-European migration flows by taking temporary advantage of the labour market opportunities of the wealthier EU countries.
In conclusion, our results show that along with the increase in the onward migration of ethnic minorities and immigrants from less attractive immigration destination countries like the Baltic states, to more attractive immigration destination countries of Europe like the Nordic countries; the number of permanent settlers in the latter group of countries could increase as well. This suggests that a process is emerging in which ethnic minority groups who live in economically disadvantaged destination countries in Europe are trickling up to more prosperous destination countries in Europe, and that members of the majority population in these less attractive countries are temporarily taking advantage of better economic opportunities in the more attractive destination countries. To help us to better understand these trends, future studies should further explore the integration contexts of sending and receiving countries, and the motivation structures of minority migrants.
7. Acknowledgments
References
Ahas, R. (2012). Viewpoints of human mobility. Presentation presented at Helsinki-Tallinn Transport and Planning Scenarios Final Conference, Helsinki, Finland: November 22 2012.
Alba, R. and Logan J.R. (1992). Assimilation and stratification in the homeownership patterns of racial and ethnic groups. International Migration Review 26(4): 13141341. doi:10.2307/2546885.
Alba, R. and Nee, V. (2003). Remaking the American Mainstream: Assimilation and Contemporary Immigration. Cambridge, MA: Harvard University Press.
Anniste, K., Tammaru, T., Pungas, E., and Paas, T. (2012). Dynamics of educational differences in emigration from Estonia to the old EU member states. Trames: Journal of the Humanities and Social Sciences 16(1): 219235.
doi:10.3176/tr.2012.3.02.
Apsite, E. (2013). Will they return? Latvian immigrants in the United Kingdom. In: Muravska, T., Petrov, R., Sloka, B., and Vaivads, J. (eds.). European Integration and Baltic Sea Region: Diversity and Perspectives. Riga: The University of Latvia Press: 1124.
Aptekar, S. (2009). Contexts of exit in the migration of Russian speakers from the Baltic countries to Ireland. Ethnicities 9(4): 507526. doi:10.1177/14687968 09345433.
Arends-Tóth, J. and van de Vijver, F.J.R. (2006). Assessment of psychological acculturation. In: Sam, D.L. and Berry, J.W. (eds.). The Cambridge Handbook of Acculturation Psychology. Cambridge: Cambridge University Press: 142162. doi:10.1017/CBO9780511489891.013.
Bates, J. and Komito, L. (2012). Migration, community and social media. In: Boucher, G., Grindsted, A., and Vicente, T.L. (eds.). Transnationalism in the Global City. Bilbao: Universidad de Deusto: 97-112.
Bijwaard, G.E. (2010). Immigrant migration dynamics model for The Netherlands. Journal of Population Economics 23(4): 12131247. doi:10.1007/s00148-008-0228-1.
Bleakley, H. and Chin, A. (2004). Language skills and earnings: Evidence from childhood immigrants. The Review of Economics and Statistics 86(2): 481496. doi:10.1162/003465304323031067.
Borjas, G. J. (1989). Immigrant and emigrant earnings: A longitudinal study. Economic Inquiry 27(1): 2137. doi:10.1111/j.1465-7295.1989.tb01161.x.
Bratsberg, B., Raaum, O., and Sørlie, K. (2007). Foreign-born migration to and from Norway. In: Özden, Ç. and Schiff, M. (eds.). International Migration, Economic Development, & Policy: Overview. Washington, DC: The World Bank and Palgrave Macmillan: 259290.
British Council (2013). Migrant Integration Policy Index [electronic resource]. London: British Council and Migrant Integration Policy Group.
http://www.mipex.eu/.
Castles, S. and Miller, M.J. (2009). The age of migration. London: Palgrave Macmillan.
Chiswick, B.R. and Miller, P.W. (2001). A model of destination language acquisition: Application to male immigrants in Canada. Demography 38(3): 391409. doi:10.1353/dem.2001.0025.
Clark, J.M. (1991). The social impact of Cuban immigration in Florida. In: Jorge, A., Suchlicki, J., and Leyva de Varona, A. (eds.). Cuban Exiles in Florida: Their Presence and Contributions. University of Miami: North-South Center Press.
Constant, A. and Massey, D.S. (2002). Return migration by German guestworkers: Neoclassical versus New Economic theories. International Migration 40(4): 538. doi:10.1111/1468-2435.00204.
Cook, J., Dwyer, P., and Waite, L. (2011). The experiences of accession 8 migrants in England: Motivations, work and agency. International Migration 49(2): 5479. doi:10.1111/j.1468-2435.2009.00595.x.
Crul, M. and Vermeulen, H. (2003). The second generation in Europe. International Migration Review 37(4): 965986. doi:10.1111/j.1747-7379.2003.tb00166.x.
DaVanzo, J. and Morrison, P.A. (1982). Migration sequences. Who moves back and who moves on? Santa Monica, CA: Rand Corp.
de Haas, H. and Fokkema, T. (2011). The effects of integration and transnational ties on international return migration intentions. Demographic Research 25(24): 755782. doi:10.4054/DemRes.2011.25.24.
Dribe, M. and Lundh, C. (2008). Intermarriage and immigrant integration in Sweden. An exploratory analysis. Acta Sociologica 51(4): 329354.
doi:10.1177/0001699308097377.
Dustmann, C. and van Soest, A. (2002). Language and the earnings of immigrants. Industrial and Labor Relations Review 55(3): 473492. doi:10.2307/ 2696052.
Ellis, M., Wright, R., and Parks, V. (2004). Work together, live apart? Geographies of racial and ethnic segregation at home and at work. Annals of the Association of American Geographer 94(3): 620637. doi:10.1111/j.1467-8306.2004.00417.x.
Elrick, T. (2008). The Influence of Migration on Origin Communities: Insights from Polish Migrations to the West. Europe-Asia Studies 60(9): 15031517.
doi:10.1080/09668130802362243.
Engbersen, G., Leerkes, A., Grabowska-Lusinska, I., Snel, E., and Burgers, J. (2013). On the Differential Attachments of Migrants from Central and Eastern Europe: A typology of labour migration. Journal of Ethnic and Migration Studies 39(6): 959981.doi:10.1080/1369183X.2013.765663.
Faist, T. (2013). The mobility turn: a new paradigm for the social sciences? Ethnic and Racial Studies 36(11): 16371646. doi:10.1080/01419870.2013.812229.
Findlay, A.M., King, R., Smith, F., Geddes, A., and Skeldon, R. (2012). World class? An investigation of globalisation, difference and international student mobility. Transactions of the Institute of British Geographers 37(1): 118131. doi:10.1111/j.1475-5661.2011.00454.x.
Fokkema, T. and de Haas, H. (2011). Pre- and post-migration determinants of socio-cultural integration of African immigrants in Italy and Spain. International Migration. doi:10.1111/j.1468-2435.2011.00687.x.
Goodman, S.W. (2010). Integration requirements for integration‘s sake? Identifying, categorising and comparing civic integration policies. Journal of Ethnic and Migration Studies 36(5): 753772. doi:10.1080/13691831003764300.
Gundel, S. and Peters, H. (2008). What determines the duration of stay of immigrants in Germany? Evidence from a longitudinal duration analysis. International Journal of Social Economics 35(11): 769782. doi:10.1108/03 068290810905414.
Heckmann, F. (2005). Integration and integration policies: IMISCOE network feasibility study. Bamberg: European Forum for Migration Studies:
http://nbn-resolving.de/urn:nbn:de:0168-ssoar-192953.
Hughes, J. (2005). ‗Exit‘ in deeply divided societies: Regimes of discrimination in Estonia and Latvia and the potential for Russophone migration. Journal of Common Market Studies 43(4): 739762. doi:10.1111/j.1468-5965.2005. 00594.x.
Ivlevs, A. (2013). Minorities on the move? Assessing post-enlargement emigration intentions of Latvia‘s Russian speaking minority. The Annals of Regional Science 51(1): 3352. doi:10.1007/s00168-012-0534-0.
Ivlevs, A. and King, R.M. (2012). Family migration capital and migration intentions. Journal of Family and Economic Issues 33(1): 118129.
doi:10.1007/s10834-011-9269-9.
Jasso, G. and Rosenzweig, M. (1988). How well do U.S. immigrants do? Vintage effects, emigration selectivity, and occupational mobility of immigrants. In: Schultz, P.T. (ed.). Research of Population Economics: Vol. 6. Greenwich, CT: JAI Press: 229253.
Jensen, P. and Pedersen, P.J. (2007). To stay or not to stay? Out-migration of immigrants from Denmark. International Migration 45(5): 87113.
doi:10.1111/j.1468-2435.2007.00428.x.
Kahanec, M. (2012). Labor Mobility in an Enlarged European Union. Bonn: Institute for the Study of Labor (IZA). (Discussion Paper No. 6485)
Kaiser, R.J. (1995). Nationalizing the work force: ethnic restratification in the newly independent states. Post-Soviet Geography 36(2): 87111.
Kantarevic, J. (2004). Interethnic marriages and economic assimilation of immigrants. Bonn: Institute for the Study of Labor (IZA). (Discussion Paper No. 1142)
King, R. (2000). Generalizations from the history of return migration. In: Gosh, B. (ed.). Return Migration: Journey of Hope or Despair?. Geneva: International Organization for Migration: 130.
King, R. (2012). Geography and Migration Studies: Retrospect and Prospect. Population Space and Place 18(2): 134153. doi:10.1002/psp.685.
King, R. and Raghuram, P. (2013). International student migration: Mapping the field and new research agendas. Population, Space and Place 19(2): 127137. doi:10.1002/psp.1746.
Koelet, S. and de Valk, H. (2013). European Liaisons? A Study on European bi-national Marriages in Belgium. Population, Space and Place. doi:10.1002/ psp.1773.
Kopnina, H. (2005). East to West migration: Russian migrants in Western Europe. Aldershot: Ashgate Publishing Ltd.
Ladõnskaja, V. (2013). Lasnamäe Valge Laev. [The White Ship of Lasnamäe]. Tallinn: Petrone Print.
Lindemann, K. and Kogan, I. (2013). The Role of Language Resources in Labour Market Entry: Comparing Estonia and Ukraine. Journal of Ethnic and Migration Studies 39(1): 105123. doi:10.1080/1369183X.2012.711050.
Lindemann, K. and Saar, S. (2009). Non-Estonians in the labour market. In: Lauristin, M. (ed.). Estonian Human Development Report 2008. Tallinn: Eesti Koostöö Kogu: 95100.
Lindstrom, D.P. and Massey, D.S. (1994). Selective emigration, cohort quality, and models of immigrant assimilation. Social Science Research 23(4): 315349.
doi:10.1006/ssre.1994.1013.
Mannila, S. and Reuter, A. (2009). Social exclusion risks and their accumulation among Russian-speaking, ethnically Finnish and Estonian immigrants to Finland. Journal of Ethnic and Migration Studies 35(6): 939956.
Massey, D.S. (1987). Understanding Mexican migration to the United States. The American Journal of Sociology 92(6): 13721403.doi:10.1086/228669.
Massey, D.S. and Espinoza, K. (1997). What‘s driving Mexico-U.S. migration? A theoretical, empirical, and policy analysis. American Journal of Sociology 102(4): 939999. doi:10.1086/231037.
Mayr, K. and Peri, G. (2009). Brain Drain and Brain Return: Theory and Application to Eastern-Western Europe. The B.E. Journal of Economic Analysis & Policy 9(1). doi:10.2202/1935-1682.2271.
McDowell, L. (2009). Old and new European economic migrants: Whiteness and managed migration policies. Journal of Ethnic and Migration Studies 35(1): 1936. doi:10.1080/13691830802488988.
Meng, X. and Meurs, D. (2009). Intermarriage, language, and economic assimilation process: A case study of France. International Journal of Manpower 30(1/2): 127144. doi:10.1108/01437720910948447.
Mood, C. (2010).Logistic regression: why we cannot do what we think we can do, and what we can do about it. European Sociological Review 26(1): 67-82.
doi:10.1093/esr/jcp006.
Myers, D. and Liu, C.Y. (2005). The emerging dominance of immigrants in the US housing market 1970–2000. Urban Policy and Research 23(3): 347366.
doi:10.1080/08111470500197920.
Nekby, L. (2006). The emigration of immigrants, return vs. onward migration: Evidence from Sweden. Journal of Population Economics 19(2): 197226.
doi:10.1007/s00148-006-0080-0.
Ohliger, R. and Münz, R. (2003). Introduction. In: Münz, R. and Ohliger, R. (eds.). Diasporas and Ethnic Migrants: Germany, Israel and Russia in Comparative. London: Frank Cass: 317.
Olofsson, J. (2012). Go West: East European migrants in Sweden. [PhD thesis]. Umeå: Umeå University, Faculty of Social Sciences, Department of Geography and Economic History.
Praakli, K. (2011). The new Estonian community in Finland. In: Grünthal, R. and Kovacs, M. (eds.). Ethnic and linguistic context of identity. Finno-ugric minorities. Helsinki: University of Helsink: 217247.
Sarvimäki, M. (2011). Assimilation to a welfare state: Labor market perfomance and use of social benefits by immigrants to Finland. The Scandinavian Journal of Economics 113(3): 665688. doi:10.1111/j.1467-9442.2011. 01652.x.
Schmidt, C.M. (1994). The country of origin, family structure and return migration of Germany‘s guest-workers. In: Burkhauser, R.V. and Wagner, G.G. (eds.). Vierteljahrsheft zur Wirtschaftsforschung. Berlin: Duncker and Humblot: 119125.
Sheller, M. and Urry, J. (2006). The new mobilities paradigm. Environment and Planning A 38(2): 207226. doi:10.1068/a37268.
Skeldon, R. (2012). Going Round in Circles: Circular Migration, Poverty Alleviation and Marginality. International Migration 50(3): 4360.
doi:10.1111/j.1468-2435.2012.00751.x.
Statistics Estonia (2013). Online Population Database [electronic resource]. Tallinn: Statistics Estonia. http://www.stat.ee/sab-uuendus?db_update_id=14122.
Statistics Finland (2013). Statistical Databases [electronic resource]. Statistics Finland. http://pxweb2.stat.fi/database/StatFin/databasetree_en.asp.
Strömgren, M., Tammaru, T., van Ham, M., Marcinczak, S., Stjernström, O., and Lindgren, U. (2011). Pre-Hire Factors and Workplace Ethnic Segregation. Bonn: Institute for the Study of Labor (IZA). (Discussion Paper No. 5622).
Tammaru, T., Kumer-Haukanõmm, K., and Anniste, K. (2010). The formation and development of the Estonian diaspora. Journal of Ethnic and Migration Studies 36(7): 11571174. doi:10.1080/1369183X.2010.481614.
Thomson, M. and Crul, M. (2007). The second generation in Europe and the United States: How is the transatlantic debate relevant for further research on the European second generation? Journal of Ethnic and Migration Studies 33(7): 10251041. doi:10.1080/13691830701541556.
Triadafilopoulos, T. (2011). Illiberal means to liberal ends? Understanding recent immigrant integration policies in Europe. Journal of Ethnic and Migration Studies 37(6): 861880. doi:10.1080/1369183X.2011.576189.
van Ham, M. and Tammaru, T. (2011). Ethnic minority-majority unions in Estonia. European Journal of Population 27(3): 313335. doi:10.1007/s10680-011-9236-z.
Velling, J. (1994). The determinants of family reunification among German guest-workers. In: Burkhauser, R.V. and Wagner, G.G. (eds.). Vierteljahrsheft zur Wirtschaftsforschung. Berlin: Duncker and Humblot: 126132.
Vihalemm, T. (2012). Integration in Estonia: Different ways. In: Asari, E.-M. and Mätlik, T. (eds.). Impact of Culture on Integration: Conference Proceedings. Tallinn:Gravitas Consult LLC: 2229.
Vishnevsky, A. (2003). The dissolution of the Soviet Union and Post-Soviet ethnic migration: The return of diasporas? In: Münz, R. and Ohliger, R. (eds.). Diasporas and Ethnic Migrants: Germany, Israel and Russia in Comparative Perspective. London: Frank Cass: 155172.
Vullnetari, J. and King, R. (2011). Remittances, Gender and Development: Albania’s Society and Economy in Transition. London: I.B. Tauris & Co Ltd.
Zaiceva, A. and Zimmermann, K.F. (2012). Returning Home at Times of Trouble? Return Migration of EU Enlargement Migrants during the Crisis. Bonn: Institute for the Study of Labor (IZA). (Discussion Paper No. 7111).