ENGINEERING AND GINNING
Microbial Census and Evidence for a Direct Temporal Effect of Bale Moisture
on Color Grade during Six Months of Storage
David T.W. Chun*, David D. McAlister, III, Sidney E. Hughs, and Dean R. Cobb
D.T.W. Chun, USDA-ARS Cotton Quality Research Station, P.O. Box 792, Clemson, SC 29633; D. D. McAlister, III, Uster Technologies, Inc., 456 Troy Circle, Knoxville, TN 37919; S. E. Hughs, USDA-ARS, S.W. Cotton Ginning Research Laboratory, 300 E. College Drive, P.O. Box 578, Mesilla Park, NM 88047; D. R. Cobb, The Institute of Textile Technology, Inc. (ITT), 11 Caledon Court, Suite C, Greenville, SC 29615 * Corresponding author: [email protected] and [email protected]
ABSTRACT
As part of an ongoing investigation, a corrobo-rative study was conducted to follow changes in fiber quality, moisture content, and microbial population in cotton bales with high moisture contents for ap-proximately 1-, 2- and 6-mo storage periods. The target moisture contents were 6% (control/ambient moisture content), 8%, 10%, and 12%. The high target moisture content bales (12%) lost moisture after 6 mo of storage, while bales at the three other moisture levels retained the same moisture content. The distribution of moisture, however, was not uni-form in the treatment bales. Uneven distribution, or spottiness, increased with increased moisture treat-ment. Microbial populations did not change during the 1 and 2 mo of storage, which occurred during the colder winter months. The greatest microbial changes associated with moisture content occurred during the 6 mo of storage, which included warmer spring and summer months. Observations on fiber quality associated with moisture content directly linked color degradation to bale moisture content. Moisture was directly correlated with decreases in reflectance and increases in yellowness. The effect of moisture on yellowness and reflectance increased with exposure (storage duration), and the higher moisture treatments were associated with the greatest decreases in reflectance and increases in yellowness.
R
estoring moisture to ginned cotton has value in reducing bale-packaging forces, increasing the bale weight to make up for excessively dry cottonresulting from ginning, and possibly improving fiber quality and processing as shown by McAlister (1997). Anthony (2003) surveyed gins in Mississippi and Arkansas and found that the average moisture content was 5.1% prior to moisture restoration and 6.2% after moisture restoration, which is below the 8% moisture level generally considered safe for bale storage, but 8.6% of the bales exceeded the 8% level. In another survey, 7.8% of the bales were packaged at 7.5% or higher moisture content (Anthony, 2004), which may subject the bales to quality degradation during extended storage (Chun and Anthony, 2004). This study was conducted as a companion study to the research conducted at the Stoneville Ginning Laboratory (Chun and Anthony, 2004) in response to industry concerns about the adverse effect of high moisture during bale storage on fiber quality. The purpose was to determine an acceptable range of cotton bale moisture to avoid fiber quality degradation during long-term bale storage. This paper reports the effect on microbial populations and the color changes associated with bale moisture during a 6-mo storage period.
MATERIALS AND METHODS
Cotton. The cotton was harvested in the 2002 crop year. The cotton was an upland cotton cultivar, DP 565 (Delta and Pine Land Company; Scott, MS), grown in New Mexico by a producer that had a reputation for producing good quality cotton and could harvest at least four modules in good condition. These modules were harvested at the same time from the same field. The cottons were harvested without excess moisture and were stored as properly shaped and tarped modules on sandy, dry ground after har-vest and prior to ginning. The cotton was ginned on 12 Dec. 2002 at a commercial gin operating at its designed ginning capacity.
Normally, fiber moisture is regulated by an infrared sensor located just after the batter condenser strip-per roll, which would make sequential readings of lint moisture and running measurements of the seed cotton feed rate of each gin feeder and adjust the spray level accordingly with up to 5 active nozzles. For this study, the infrared sensor was bypassed. Preset amounts of water in kilograms were applied by the spray system to bring the bale moisture to predetermined levels based on an assumed initial bale moisture content of 6% (the moisture level of cotton harvested and placed in a module during the normally dry harvest conditions of the Southwest).
The approximate amount of moisture added to each bale was determined by the equation as follows:
Final moisture = [(dry cotton + I + M) – (dry cotton)] / (dry cotton + I + M),
where I is the initial moisture in the cotton and M is the amount of water needed to add to bring the cotton to the final moisture. The target bale weight was set at 217.7 kg (480 pounds) and the ambient moisture content was 6%, so initial moisture content was 13 kg (217.7 x 0.06) and the dry cotton weighed 204 kg (217.7 – 13).
To obtain the targeted final moisture contents of 8%, 10%, and 12%, 4.54 kg, 9.07 kg, and 13.61 kg (10 lb, 20 lb, and 30 lb, respectively) of water was added per bale, respectively. Approximately this amount of moisture is sprayed on the cotton during the time it takes for the conveyer belt to move 217 kg of cotton pass the sprayers.
The bales were wrapped with a polyethylene bag with plastic strapping. The bale ends were secured by sewing the ends closed instead of heat sealing. Nine bales were prepared for each of the moisture treatments, 6% (control, no moisture added), 8%, 10%, and 12% moisture, with the weight of all 36 test bales averaging 216.5 kg (477.4 lb). The fin-ished bales were stored inside the gin building (the ambient temperature and relative humidity on the day of ginning were approximately 10 °C and 26% RH) until they could be transported to the Cotton Quality Research Station (CQRS). At the station, they were stored at the USDA Warehouse, a conven-tional unheated and uncooled warehouse typical of the type used for storing commercial cotton, at the Agricultural Servicenter in Clemson, SC.
Initial moisture content at the time of baling was determined from samples taken from the lint slide after moisture application. A set of stairs was built
along the length of one side of the lint slide to allow access to the cotton. A person grabbed a section of the moving, treated batt and then removed excess fiber to obtain an approximately 30-g sample. This sample was then placed into a pre-weighed perforated metal basket, which was then sealed in a metal can until the entire sample could be oven dried to determine the moisture content (ASTM, 1971). Four samples were obtained for each bale; two at approximately 25% of the distance from the edge of the lint slide and two from the middle of the lint slide. There were a total of 144 moisture samples during the test run.
Microbial activity and fiber quality. Changes to the physical properties of the fiber were measured with the Advanced Fiber Information System (AFIS) and HVI (Uster Technologies; Knoxville, TN). The samples were tested on site at CQRS for the AFIS measurements. For the HVI analysis, the samples were sent to the USDA-AMS Cotton Division Class-ing Office in Memphis, TN. Only the color changes will be reported in this manuscript.
(ASTM, 1971), in which the dry weight is obtained after oven drying the samples to remove the moisture from the lint.
Experimental design and statistical analysis. The storage durations were designated as 1 mo, 2 mo, and 6 mo, but these were approximate periods. The actual sampling occurred on 17 Jan., 26 Feb., and 8 July 2003, respectively. For each storage period, 12 bales were used. Three bales from each moisture treatment were randomly removed from storage and sampled. Each bale was placed on its side and, before the plastic straps were removed, divided into 10 lay-ers or zones parallel to the compression laylay-ers. After the straps were cut, a cardboard template was placed on the top surface of each layer. This template had 14, 15.24-cm diameter holes. Each hole represented a fixed location that was equidistant from each other and outlined locations on the surface from which potential samples could be taken. One location was randomly chosen from each layer and enough lint was removed from that location to compactly fill a 0.95-L wide-mouth canning jar. The sampled layer was then removed and the layer below it was exposed and sampled. This continued until each of the 10 layers had been sampled. The samples were stored at room temperature in these tightly sealed canning jars until the samples could be removed for fiber quality and microbial population measurements. The four moisture level treatments with three replicates provided 120 samples for each of the storage times. Each of the 120 samples was randomly given a new and unique sample ID number. The samples were as-sayed sequentially. Microbial populations in colony forming units (cfu) per gram lint (corrected for dry weight), were transformed, log10(cfu+1), for the analysis of the microbial data. The moisture content derived from correcting the lint for dry weight in the microbial count transformation was used for
obtain-ing individual samples and over-all average moisture content. Data were analyzed with SAS (release 8.00; SAS system for Windows NT, SAS Institute Inc.; Cary, NC) and means separated using Duncan’s mul-tiple range test. Microsoft EXCEL 2000 (Microsoft Corporation; Redmond, WA) was used to randomize treatment assignments, to enter and store data, to sort data and prepare for SAS analysis, to correct data for dry weight, to transform data, to summarize and tabulate results, to obtain simple treatment statistics (means, standard deviations, regressions, etc.), and to perform other spreadsheet functions. SigmaPlot 2002 (version 8.0, SPSS, Inc.; Chicago, IL) was used for plotting the data.
RESULTS AND DISCUSSION
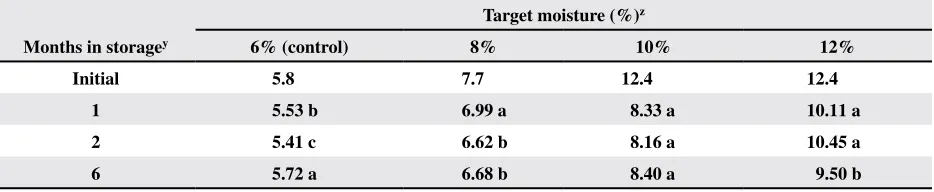
The actual ambient moisture content at ginning determined by the oven drying method was 5.8%. This small deviation from 6%, the moisture level of cotton harvested and moduled during the normally dry harvest conditions of the Southwest, was expected to have little influence on the moisture values of the other treatments. The initial moisture content after moisture restoration was 7.7%, 12.4%, and 12.4% for the targeted 8.0%, 10.0%, and 12.0% moisture treatments, respectively (Table 1). The reason for the 12.4% moisture content for the 10% treatment is unknown. It is unlikely that the variability of the oven-drying test increased with the higher moisture treatments. One explanation may be that a plateau for manual sampling occurred at the lint slide. Another explanation for the deviation was that the moisture restoration system was set wrong or was not work-ing properly, and too much water was added to the targeted 10% treatment. Later measurements of the 10% moisture bales during storage showed moisture contents considerably lower than the target 12%
Table 1. Moisture content of cotton bales after storage for 1, 2, and 6 mo
Target moisture (%)z
Months in storagey 6% (control) 8% 10% 12%
Initial 5.8 7.7 12.4 12.4
1 5.53 b 6.99 a 8.33 a 10.11 a
2 5.41 c 6.62 b 8.16 a 10.45 a
6 5.72 a 6.68 b 8.40 a 9.50 b
y Initial moisture content is the actual content at time of ginning in New Mexico. Values are the averages of 36 samples for each target moisture.
z Means within a column followed by the same letter are not significantly different according to Duncan’s multiple range
moisture bales, which also initially showed 12.4% moisture at the time of ginning (Table 1). This result lead to the indication that the manual sampling at the lint slide did not provide representative samples on which to base initial moisture content measurements at the higher moisture levels.
Bale moisture content tends to equilibrate during storage with losses and gains influenced by the ambi-ent warehouse environmambi-ent and by the bale covering used (Anthony, 2005; Anthony and Herber, 1991); therefore, the change in initial moisture content during storage was not unexpected (Table 1). While the mois-ture content of the control bales were all below the initial 5.8% at the gin and changed significantly during storage, they remained around 5.6%. Compared with the actual initial moisture content measured at the gin, however, moisture loss was apparent in the treated bales. The 8% moisture bales started at about 7.7% at the gin, but slowly lost moisture until they reached about 6.7% after 6 mo in storage. The 10% moisture treatment had an initial moisture content of 12.4%, but these bales had greatest moisture loss (approximately 4.1%) after just 1 mo in storage. The moisture content of the target 10% bales, however, did not change after the first month in storage and remained at about 8.3% through the 6 mo in storage, approximately 1.7% less than the 10% target moisture content. These results indicate that the high initial moisture content of 12.4% may be partially explained as sampling error at the gin. The samples of heavily wetted cotton taken by hand from the moving batt, where the moisture sprayed on top of the batt may not have immediately penetrated the batt layer, did not provide a representative average of the actual initial moisture. Through the 6 mo of storage, the control bales and the target 8% and 10% bales retained the same moisture content, while the target 12% bales lost the most moisture, even though it retained most of the water added at the gin. After just 1 mo of storage, the target 12% bales had dropped to 10.11%, a 2.3% drop in moisture. After 2 mo of storage, the moisture level had dropped about 1.95% from its initial moisture and by 6 mo, the moisture level was 2.9% less than its initial moisture, but still about 3.8% higher than the control bales.
While the treatments containing greater than 8% moisture content maintained an average moisture content above the recommended 7.5% was a concern (Anonymous, 2003), an even greater concern was the distribution of moisture within the bale. When the moisture content of each individual sample taken from the bale layers was plotted against the target
moisture content of that individual sample, all of the moisture restoration bale samples showed uneven distribution of moisture (Fig. 1). The greater the moisture content the greater the uneven distribu-tion. The moisture distribution of the 8%, 10%, and 12% treated bales became more uniform as storage time increased. Even though the target 8% moisture treatment averaged about 6.7% moisture content during storage and only 7.7% at the gin, these bales
5 6 7 8 9 10 11 12 13
4 6 8 10 12 14 16
One month
5 6 7 8 9 10 11 12 13
S
a
m
p
le
m
o
is
tu
re
(%)
4 6 8 10 12 14 16
Two month
Target moisture (%)
5 6 7 8 9 10 11 12 13
4 6 8 10 12 14 16
Six month
had individual sample locations above 8% moisture through 2 mo of storage. Only after 6 mo did all of the individual samples from the target 8% treated bales fall within the recommended 7.5% maximum moisture content. The 10% and 12% moisture treated bales had the greatest variability in moisture content. Some of the sample locations had moisture content more than 3% higher than the average bale moisture, and most of the sample locations had moisture above the 7.5% maximum recommended moisture content throughout the 6-mo storage period.
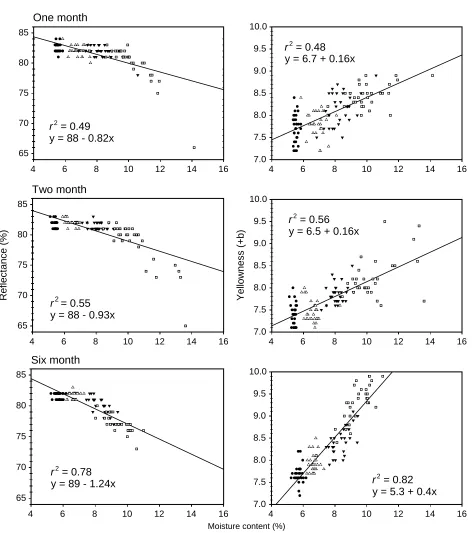
The consequence of storing cotton at moisture levels greater than recommended is apparent when the color of the individual samples was examined. Previous studies have indicated a link between added moisture with a decrease in grade because of color changes (Anthony, 2002; Chun et al., 2003; Chun and Anthony, 2004; Chun and Brushwood, 1998). In this study, the relationship between the moisture content of individual samples with their reflectance and yellowness measurements supports this asso-ciation (Fig. 2). The results showed that moisture is directly correlated with decreases in reflectance and increases in yellowness with the line slopes changing from -0.82 to -0.93 and -1.24 for reflectance, and 0.16 to 0.16 and 0.40 for yellowness, after 1, 2, and 6 mo of storage, respectively. In addition, the effect of moisture appears to be influenced by the dura-tion of exposure (storage duradura-tion). For reflectance, the correlation coefficient (r) changed from 0.70 to 0.74 to 0.88, after 1-, 2- and 6-mo storage periods, respectively. For yellowness, r = 0.69, 0.75 and 0.91,
after 1-, 2- and 6-mo storage periods, respectively. The higher moisture treatments were associated with the greatest decreases in reflectance and increases in yellowness (Fig. 2).
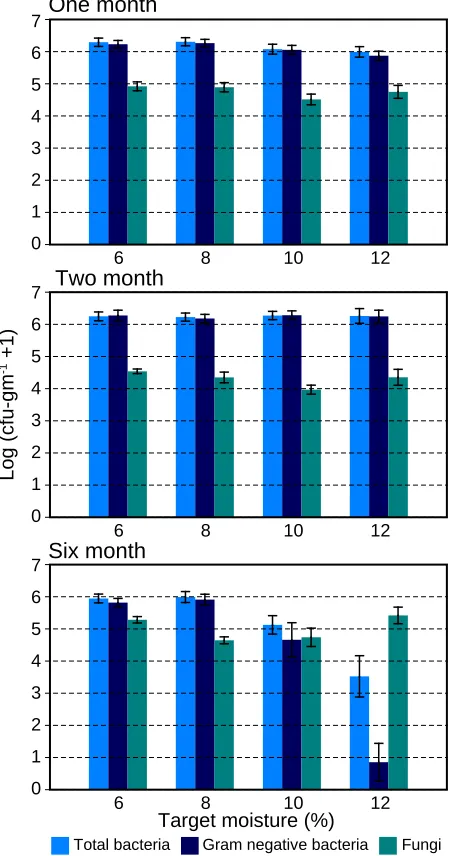
The effect of moisture restoration on the micro-bial population densities is not as obvious, because microbes are biological in nature. Given adequate moisture, nutrients, and a warm environment, mi-crobes are expected to flourish and their population density to increase. But the 1-mo and 2-mo storage periods occurred during the colder winter months that probably inhibited microbial activity compared with the warmer spring and summer months in-cluded in the full 6-mo storage period (Table 3). This was reflected in the small differences in the viable microbial populations during the 1-mo and 2-mo storage periods (Fig. 3 and Table 2). There were no significant changes in the total and Gram-negative bacterial populations after 1 and 2 mo of storage for each of the moisture treatments. Only in the 6-mo storage period did the bacterial populations change significantly. The decrease in bacterial population appeared to be associated with the higher moisture treatments. While higher moisture levels are gen-erally associated with higher microbial levels, the decrease in populations may be due to the death of the bacteria following an increase in population because of early moisture stimulation. The initial higher moisture content probably broke the microbial dormancy and resulted in higher microbial activity for the short-term. Over time, available nutrients may become limiting or depleted, so the microbes
Table 2. Microbial populations [log10(CFU+1/gm)] in cotton bales after storage for 1, 2, and 6 mo
Target moisture (%)z
Organism Months in storage 6% (control) 8% 10% 12%
Total bacteria 1 6.29 a 6.31 a 6.08 a 5.99 a
2 6.25 a 6.22 a 6.27 a 6.26 a
6 5.95 b 5.99 b 5.12 b 3.52 b
G(-) bacteria 1 6.29 a 6.26 a 6.06 a 5.87 a
2 6.25 a 6.18 a 6.28 a 6.25 a
6 5.95 b 5.91 b 4.66 b 0.85 b
Fungi 1 4.92 b 4.89 a 4.51 a 4.75 b
2 4.54 c 4.35 c 3.97 b 4.35 c
6 5.28 a 4.64 b 4.74 a 5.42 a
zMeans within a column followed by the same letter are not significantly different according to Duncan’s multiple range
are unable to sustain growth and begin to die, leav-ing a lower number of viable bacteria to be assayed. This explanation is suspect because of significantly lower populations at 6 mo of storage in the control bales (Table 2). Although little or no biological ac-tivity was expected with the control bales, because the moisture content of cotton at these levels is too
low to stimulate microbial activity, the decrease in population density in the control bales after 6 mo of storage might represent a decrease due to the normal mortality-survival rate of bacteria (Chun and Perkins, 1996). The likely role of moisture is shown in Figure 3, where the bacterial decline at 6 mo was associated with the higher moisture treatments.
4 6 8 10 12 14 16
7.0 7.5 8.0 8.5 9.0 9.5 10.0
4 6 8 10 12 14 16
7.0 7.5 8.0 8.5 9.0 9.5 10.0
4 6 8 10 12 14 16
7.0 7.5 8.0 8.5 9.0 9.5 10.0
4 6 8 10 12 14 16
65 70 75 80 85
One month
Two month
R
ef
le
ct
an
ce
(%
)
Ye
llo
w
ne
ss
(+
b)
4 6 8 10 12 14 16
65 70 75 80 85
4 6 8 10 12 14 16
65 70 75 80 85
Moisture content (%) Six month
r2= 0.49
y = 88 - 0.82x
r2= 0.55
y = 88 - 0.93x
r2= 0.78
y = 89 - 1.24x r2= 0.82
y = 5.3 + 0.4x
r2= 0.56
y = 6.5 + 0.16x
r2= 0.48
y = 6.7 + 0.16x
The fungal populations did not follow this trend. At the 6-mo storage period, instead of decreasing with added moisture, the fungal populations leveled off in the 8% and 10% target moisture treatments, while at the 12% target moisture treatment populations of fungi increased above populations in the control bales (Fig. 3). Since microbial activity was not expected to be very high at the control bale moisture level because of insufficient moisture to support biological activity, there was good reason to believe that the viable fungal populations at the 12% moisture treatment may rep-resent fungi that were biologically active during the storage period at this high moisture level.
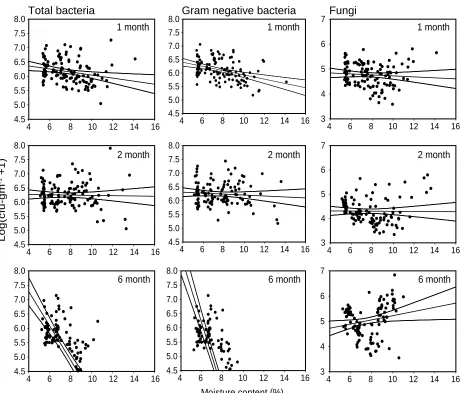
If the microbial population densities of the indi-vidual samples were plotted against their correspond-ing moisture content, the bacterial populations exhib-ited sharp decreases in population in the 6-mo storage period. The lower population distribution tended to be associated with the higher moisture content samples (Fig. 4), where the slopes were 0.053, 0.0 and -0.6 for total bacteria and -0.08, -0.02, and -1.18 for Gram-negative bacteria in the 1-, 2-, and 6-mo storage periods, respectively. By the 6-mo storage period, instead of declining, the fungal population density tended to increase and the distribution of the higher fungal density samples were associated with higher moisture content (Fig. 4). The slopes were -0.02, 0.0, and 0.08 in the 1-, 2-, and 6-mo storage periods.
CONCLUSION
Moisture restoration added additional weight to the baled cottons. Under the conditions of this study, weight gain was partially lost during stor-age with greater loss being associated with greater initial moisture content. When moisture restoration was targeted at more than 8%, even after a 6-mo
Table 3. Monthly average temperature, barometric pressure, and relative humidity in 2003 during the 6 mo of storage
Monthz Average temperature °C (°F) Barometric pressure
(hPa) Relative humidity(%)
Jan 4.5 (40.0) 1016.4 59.0
Feb 6.9 (44.4) 1014.7 73.3
Mar 12.8 (55.1) 1013.8 76.6
Apr 15.5 (59.9) 1013.8 76.9
May 19.7 (67.5) 1012.7 78.2
Jun 23.0 (73.5) 1012.6 79.1
July 24.7 (76.4) 1014.9 84.2
zWeather data compiled from Internet data provided by the Clemson-Oconee County Airport (airport code, KCEU).
Figure 3. Microbial populations in colony forming units (cfu) after 1, 2, and 6 month of storage at the 6% (control), 8%, 10% and 12% target moisture levels. Each half bar represents 2 standard errors.
6 8 10 12
6 8 10 12
6 8 10 12
Lo
g
(c
fu
-g
m
-1+1
)
One month
0 1 2 3 4 5 6 7
Two month
0 1 2 3 4 5 6 7
Target moisture (%) Six month
0 1 2 3 4 5 6 7
excessive moisture restoration at the time of baling. The coincidental increase of fungal density with increased moisture content and color degradation, while bacterial populations decreased during stor-age, indicates that researchers should reexamine the emphasis on bacteria (Fischer et al., 1980; Morey et al., 1982) and redirect resources to the role of fungi in cotton fiber quality (Nickerson & Tomaszewski, 1958; Perkins and Brushwood. 1997).
DISCLAIMER
Mention of a trademark, warranty, proprietary product or vendor does not constitute a guarantee by the U.S. Department of Agriculture and does not imply approval or recommendations of the product to the exclusion of others that may also be suitable.
Lo
g(
cf
u-gm
-1+1
)
Moisture content (%)
4 6 8 10 12 14 16
3 4 5 6 7
4 6 8 10 12 14 16
4.5 5.0 5.5 6.0 6.5 7.0 7.5 8.0
1 month
4 6 8 10 12 14 16
4.5 5.0 5.5 6.0 6.5 7.0 7.5 8.0
4 6 8 10 12 14 16
3 4 5 6 7
4 6 8 10 12 14 16
4.5 5.0 5.5 6.0 6.5 7.0 7.5 8.0
2 month
4 6 8 10 12 14 16
4.5 5.0 5.5 6.0 6.5 7.0 7.5 8.0
4 6 8 10 12 14 16
3 4 5 6 7
4 6 8 10 12 14 16
4.5 5.0 5.5 6.0 6.5 7.0 7.5 8.0
6 month
1 month
2 month
6 month
1 month
2 month
6 month
4 6 8 10 12 14 16
4.5 5.0 5.5 6.0 6.5 7.0 7.5 8.0
Fungi Gram negative bacteria
Total bacteria
storage period, the moisture content often exceeded the maximum 7.5% recommended by the National Cotton Council of America. In addition, moisture restoration resulted in uneven distribution of mois-ture. Greater variability in moisture distribution was associated with the greater moisture restoration, so that even when the low level restoration of 8% moisture was the aim, localized portions of the bale exceeded the recommended 7.5% moisture content during storage through 6 mo of storage. The recom-mendation that moisture levels of cotton bales at the gin not exceed a targeted level of approximately 7.5% appears to be a prudent recommendation in regard to minimizing microbial and color effects. A direct relationship of moisture content with decreased reflectance and increased yellowness of the fiber over time was observed and recommends against
REFERENCES
American Society for Testing and Materials (ASTM). 1971. Standard method of test for moisture in cotton by oven-drying, D 2495. p. 419-426. In Annual Book of ASTM Standards, Part 25. ASTM, West Conshohocken, PA. Anonymous. 2003. NCC quality task force adopts bale
mois-ture recommendation. News Release, 10 Oct. 2003. Natl. Cotton Counc. Am., Memphis, TN. Available at online at http://www.cotton.org/news/2003/bale-moisture.cfm (verified 31 Aug. 2006).
Anthony, W. S. 2002. Impact of moisture added at lint slide on cotton color. The Cotton Gin and Oil Mill Press 103(6):8-12.
Anthony, W.S. 2003. Survey of moisture restoration at mid-south gins in 2002. The Cotton Gin and Oil Mill Press 104(7):10-12.
Anthony, W.S. 2004. Survey of bale moistures at mid-south gins in 2003. The Cotton Gin and Oil Mill Press 105(15):8-11.
Anthony, W.S. 2005. Weight changes in cotton bales in woven polypropylene bagging. The Cotton Gin and Oil Mill Press 106(12):7-9.
Anthony, W.S. and Herber, D.J. 1991. Moisture transfer of cotton bales covered with experimental bagging. p. 978-980. In Proc. Beltwide Cotton Conf., San Antonio, TX. 6-10 Jan. 1991. Natl. Cotton Counc. Am., Memphis, TN. Chun, D.T.W. and W.S. Anthony. 2004. Effects of adding
moisture at the gin lint slide on cotton bale microbial activity and fiber quality. J.Cotton Sci. 8:83-90 (Online). Available at http://www.cotton.org/journal/2004-08/2/83. cfm
Chun, D.T.W. and D. Brushwood. 1998. High moisture stor-age effects on cotton stickiness. Textile Res. J. 68(9): 642-648.
Chun, D. T.W, D.D. McAlister, and D. Cobb. 2003. Microbial activity of stored cotton bales that had been baled at different moisture levels. p. 1982-1985. In Beltwide Cot-ton Conf., Nashville, TN. 6-10 Jan. 2003. Natl. CotCot-ton Counc. Am., Memphis, TN.
Chun, D. and R.E. McDonald 1987. Seasonal trends in the population dynamics of fungi, yeasts, and bacteria on fruit surface of grapefruit in Florida. Proc. Fla. State Hort. Soc. 100:23-25.
Chun, D.T.W., and H.H. Perkins, Jr. 1996. Effects of conven-tional cotton storage on dust generation potential, bacte-rial survival and endotoxin content of lint and dust. Ann. Agric. Environ. Med. 3:19-25.
Fischer, J.J., P.R. Morey, and P.E. Sasser. 1980. Gram-nega-tive bacterial content and fiber properties of raw cotton. Textile Res. J. 50(12):735-739.
McAlister, D.D. 1997. The impact of moisture on cotton fiber quality and processing. p. 147-159. In Engineered Fiber Selection System Research Forum Proc., 10th, Raleigh,
NC. 6-7 Nov. 1997. Cotton Incorporated, Raleigh, NC. Morey, P.R., J.J. Fischer, and P.E. Sasser. 1982. Endotoxin
content and fiber properties of raw cotton. Textile Res. J. 52:524-528.
Nickerson, D. and J.J. Tomaszewski. 1958. Color change in raw cotton related to conditions of storage. Textile Res. J. 28(6):485-497 & 528-529.
![Figure 1. The relationship between the moisture content of each sample after 1, 2, 6 months of storage and the target moisture [6% (control), 8%, 10%, and 12%]](https://thumb-us.123doks.com/thumbv2/123dok_us/8946273.1855641/4.612.316.539.211.689/figure-relationship-moisture-content-sample-storage-moisture-control.webp)
![Table 2. Microbial populations [log10(CFU+1/gm)] in cotton bales after storage for 1, 2, and 6 mo](https://thumb-us.123doks.com/thumbv2/123dok_us/8946273.1855641/5.612.80.540.525.717/table-microbial-populations-cfu-cotton-bales-after-storage.webp)