in the population sciences published by the Max Planck Institute for Demographic Research Konrad-Zuse Str. 1, D-18057 Rostock · GERMANY www.demographic-research.org
DEMOGRAPHIC RESEARCH
VOLUME 21, ARTICLE 11, PAGES 289-340
PUBLISHED 10 SEPTEMBER 2009
http://www.demographic-research.org/Volumes/Vol21/11/ DOI: 10.4054/DemRes.2009.21.11
Research Article
Sexual behaviour patterns in South Africa and
their association with the spread of HIV:
Insights from a mathematical model
Leigh F. Johnson
Rob E. Dorrington
Debbie Bradshaw
Victoria Pillay-Van Wyk
Thomas M. Rehle
© 2009 Leigh F. Johnson et al.
This open-access work is published under the terms of the Creative Commons Attribution NonCommercial License 2.0 Germany, which permits use, reproduction & distribution in any medium for non-commercial purposes, provided the original author(s) and source are given credit.
1 Introduction 290
2 Methods 291
2.1 Demographic assumptions 292
2.2 Sexual behaviour assumptions 292 2.2.1 Rates of sexual debut 294 2.2.2 Rates of short-term partnership formation 294
2.2.3 Rates of marriage 296
2.2.4 Average durations of partnerships 297
2.2.5 Commercial sex 297
2.2.6 Preferences regarding partner age and risk group 298
2.2.7 Frequency of sex 299
2.2.8 Condom use 300
2.2.9 The effect of HIV symptoms and treatment on sexual behaviour 300
2.3 HIV/AIDS assumptions 301
2.4 Statistical analysis 303
2.5 Behaviour change scenarios 305
3 Results 306
3.1 Comparison of prior and posterior distributions 306 3.2 Comparison with HIV prevalence data and sexual behaviour data 307 3.3 The effect of AIDS morbidity and mortality on sexual behaviour 311 3.4 The profile of new HIV infections, by sexual risk behaviour 312 3.5 The effect of changes in sexual behaviour 314 3.6 Bias in reported sexual behaviour 316
4 Discussion 317
Sexual behaviour patterns in South Africa and their association with
the spread of HIV:
Insights from a mathematical model
Leigh F. Johnson1
Rob E. Dorrington2
Debbie Bradshaw3
Victoria Pillay-Van Wyk4
Thomas M. Rehle5
Abstract
This paper aims to quantify the effects of different types of sexual risk behaviour on the spread of HIV in South Africa. A mathematical model is developed to simulate changes in numbers of sexual partners, changes in marital status, changes in commercial sex activity, and changes in the frequency of unprotected sex over the life course. This is extended to allow for the transmission of HIV, and the model is fitted to South African HIV prevalence data and sexual behaviour data. Results suggest that concurrent partnerships and other non-spousal partnerships are major drivers of the HIV/AIDS epidemic in South Africa.
1 Centre for Actuarial Research, University of Cape Town. Private Bag X3. Rondebosch 7701, South Africa.
Phone: +27 21 650 5761. Fax: +27 21 650 5937. E-mail: [email protected].
2 Centre for Actuarial Research, University of Cape Town.
1. Introduction
Understanding the relationship between sexual behaviour and the risk of HIV infection is critical to the development of HIV prevention strategies. Ideally, policymakers should have detailed knowledge of the relative numbers of new HIV infections currently occurring in different sub-populations and risk groups if they are to respond effectively (Bertozzi et al. 2008; Piot et al. 2008). However, measuring numbers of new HIV infections occurring in different risk groups through surveys is challenging, and, in view of the complexities involved, simulation models that are calibrated to available epidemiological data may provide an acceptable alternative method of assessing the relative significance of different risk behaviours (Bertozzi et al. 2008). Mathematical models can also be used to assess the likely effects of different types of behavioural change (Garnett and Anderson 1995; Korenromp et al. 2000; Bracher, Santow, and Watkins 2004; Hallett et al. 2007), and can play an important role in determining whether observed changes in HIV prevalence are attributable to changes in sexual behaviour (Hallettet al. 2006).
However, there are several difficulties associated with using mathematical models to assess the contribution of different sexual behaviours to the transmission of HIV. First, there is often a lack of reliable sexual behaviour data for setting the sexual behaviour parameters in these models. In South Africa, for example, hardly any nationally representative sexual behaviour data were collected prior to 2000 (Eaton, Flisher, and Aarø 2003), and as a result, many early models of the HIV/AIDS epidemic in South Africa were forced to rely on fairly arbitrary assumptions about sexual behaviour (Doyle and Millar 1990; Schall 1990; Groeneveld and Padayachee 1992; Johnson and Dorrington 2006).
explicitly, but have not considered the extent of the uncertainty regarding this bias (Van der Ploeget al. 1998).
A further difficulty in using deterministic models to assess the contribution of different risk behaviours to the spread of HIV is that most deterministic models are not sufficiently detailed to provide meaningful insights into sexual behaviour. With a few exceptions (Bongaarts 1989; John 1991), most deterministic models do not represent spousal and non-spousal relationships separately. Although heterogeneity in sexual behaviour is usually allowed for by dividing the sexually active population into ‘risk groups’, deterministic models typically assume that individuals do not move between risk groups over time, and hence conflate inter-individual and within-individual heterogeneity in HIV risk behaviour. Deterministic models also generally do not allow for concurrent sexual partnerships explicitly, although efforts have been made to extend pair formation models to include the formation of sexual partner ‘triples’ (Ferguson and Garnett 2000; Bauch and Rand 2000; Eames and Keeling 2004). The implicit assumption of ‘serial monogamy’ is an unfortunate limitation in view of the potentially significant role of concurrent partnerships in the epidemiology of HIV in Africa (Halperin and Epstein 2004; Morris and Kretzschmar 1997).
The objective of this paper is to estimate the extent to which different types of sexual risk behaviour are promoting the spread of HIV in South Africa, using a deterministic HIV/AIDS model. This paper also aims to extend the standard deterministic model of sexual behaviour to allow for changes in numbers of sexual partners, changes in commercial sex activity, and changes in marital status over the life course. In addition, this paper proposes a method for fitting a deterministic model of sexual behaviour to sexual behaviour data, using a Bayesian approach to quantify uncertainty regarding the key sexual behaviour parameters.
2. Method
2.1 Demographic assumptions
The basis of the model is a cohort component projection model, with the South African population divided by age (in five-year age groups) and sex. The projection begins at the middle of 1985, a few years ahead of the first reported heterosexual AIDS cases in South Africa (Schoub et al. 1988). Assumptions about fertility, non-AIDS mortality, and the 1985 population profile are obtained from the ‘lite’ version of the ASSA2003 AIDS and Demographic Model, a model of the South African HIV/AIDS epidemic (Dorringtonet al. 2006). Births and movements between age cohorts are calculated at annual intervals, while deaths and movements between sexual activity states and HIV states are calculated at monthly intervals. Further details on the demographic assumptions and the method used to determine the profile of the population at the start of the projection are contained in a supplementary data file on the journal website (‘SupplementaryData.xls’).
2.2 Sexual behaviour assumptions
Sexual behaviour is modelled by dividing the population into two sexual activity classes: individuals who have a propensity to engage in commercial sex and/or concurrent partnerships (‘high risk’), and individuals who are serially monogamous and never engage in commercial sex (‘low risk’). The proportion of the population in the high risk group is set at 35% in males and 25% in females, based on detailed sexual behaviour data collected in communities with high HIV prevalence (Dunkleet al. 2004; Jewkes et al. 2002). Nationally representative survey data suggest that the proportion of individuals who have multiple current partners is likely to be lower, e.g., 12%-18% among unmarried men and 1%-3% among unmarried women in the 2005 Human Sciences Research Council (HSRC) national household survey (Shisana et al. 2005). However, these are likely to be underestimates of the proportions of individuals with a propensity for concurrent partnerships, partly because of underreporting in FTFIs (i.e., social desirability bias), and partly because individuals with a propensity for concurrent partnerships do not have multiple partners all the time (Carteret al. 2007).
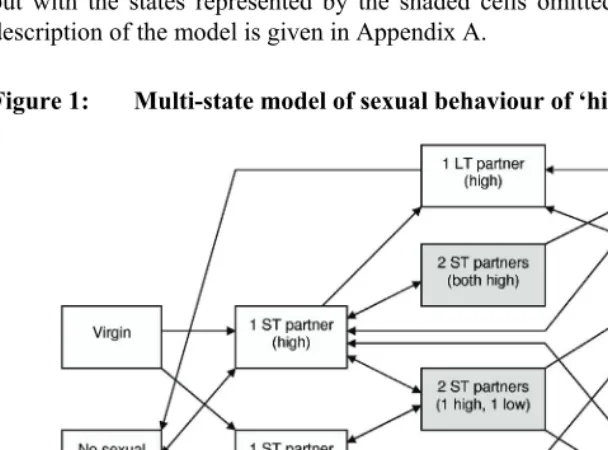
simplicity, it is assumed that individuals in the high risk group never have more than two current partners, though high risk men can continue to have contact with sex workers when they have two other partners. No allowance is made for polygyny, since it is relatively uncommon in South Africa (Budlender, Chobokoane, and Simelane 2004). The multi-state model used for men in the high risk group is identical to that shown in Figure 1, except that there is no ‘sex worker’ state. The model of sexual behaviour in the male and female low risk groups is the same as that shown in Figure 1, but with the states represented by the shaded cells omitted. A detailed mathematical description of the model is given in Appendix A.
Figure 1: Multi-state model of sexual behaviour of ‘high risk’ females
2.2.1 Rates of sexual debut
Assumed rates of sexual debut in the high risk group are shown in Table 1. Studies conducted in South Africa and Zimbabwe suggest that the rate at which ‘low risk’ individuals (however they may be defined) initiate their first sexual contact is typically between 20% and 60% of that in ‘high risk’ individuals (Dunkle et al. 2004; Mpofu et al. 2006; Pettifor et al. 2004b). It is therefore assumed that virgins with no propensity for multiple partnerships acquire their first sexual partner at a rate equal to half of that in virgins who subsequently enter the high risk group. The rates of sexual debut for the high risk group, shown in Table 1, have been determined in such a way that the overall levels of sexual experience for high and low risk groups combined are consistent with the reported rates of sexual experience in the 2005 HSRC household survey, based on the assumption that young women underreport sexual experience, and that young men slightly exaggerate their sexual experience (Mensch, Hewett, and Erulkar 2003; Hewett, Mensch, and Erulkar 2004; Turner et al. 1998). All individuals are assumed to be sexually experienced by age 30.
2.2.2 Rates of short-term partnership formation
) (
,l x
The parameter is defined as the rate at which an individual of sex g wishes to form new short-term partnerships if they are in risk group i, aged x, in HIV disease state s, and in relationship type l with a partner in group j (if the individual is currently single, j = 0 and the l subscript is omitted). This parameter is specified for a ‘baseline’ group (single HIV-negative individuals in the high risk group, who are aged 15 to 19), and a series of multiplicative adjustments are then specified to allow for the effects of age, risk group, HIV disease stage, and nature of current relationship(s). Based on data from pregnant teenagers who reported lengths of time between recent sexual partnerships (Jewkes et al. 2001), it is assumed that the rate of partner acquisition in single, sexually experienced, high risk women aged 15-19 is 14.6 per annum, which is equivalent to a mean interval between partnerships of 25 days. Since rates of secondary abstinence are typically higher in young men than in young women (Shisana et al. 2005; Reproductive Health Research Unit 2004; Human Sciences Research Council 2002), the corresponding rate for single, sexually experienced, high risk men in the 15-19 age group is assumed to be half of that in women, i.e., 7.3 per annum.
, , cs
j i g
scenarios, and the parameters obtained from the average of these fits are used as the default age-specific rates of short-term partner acquisition in the model. These rates are shown in Table 1.
Table 1: Sexual behaviour parameters, by age and sex
Proportion of sex act
s in
which condoms are us
ed ( b y age of f e ma le partner)
Annual rate of s
e
xua
l debut in high
risk group (
) Annua l ra te of s hort-te rm pa rtne r acquisition in singl e i ndividuals in
high risk group (
)
Annual rate of ma
rria
g
e
Annual rate of di
vorc e Annual rate at which single high risk m e n v isit CSWs * A verage age of sexu al part ner
Non-spousal partnerships Spousal partnerships Age (x)
M F M F M F M F M F 1985 2010 1985 2010
10-14 0.01 0.05 0.6 1.4 - - - - 0.29 12.5 15.8 0.011 0.537 - -
15-19 0.27 0.52 7.3 14.6 0.004 0.020 0.0003 0.0067 1.61 17.0 20.9 0.009 0.505 0.004 0.180
20-24 0.82 0.91 15.9 23.3 0.036 0.073 0.0163 0.0197 2.28 21.0 26.2 0.008 0.474 0.004 0.162
25-29 1.00 1.00 20.6 21.5 0.117 0.100 0.0252 0.0240 2.17 25.1 31.7 0.007 0.443 0.003 0.146
30-34 - - 20.8 15.2 0.128 0.092 0.0250 0.0236 1.70 29.0 37.0 0.007 0.412 0.003 0.131
35-39 - - 18.0 9.2 0.119 0.078 0.0218 0.0186 1.18 33.2 42.2 0.006 0.383 0.003 0.117
40-44 - - 14.0 5.0 0.105 0.063 0.0182 0.0160 0.76 38.0 46.7 0.005 0.354 0.002 0.105
45-49 - - 10.2 2.5 0.094 0.051 0.0145 0.0114 0.46 43.3 51.4 0.004 0.325 0.002 0.094
50-54 - - 7.1 1.2 0.087 0.041 0.0109 0.0077 0.27 48.0 55.7 0.004 0.299 0.002 0.084
55-59 - - 4.7 0.5 0.081 0.031 0.0071 0.0050 0.15 52.3 60.2 0.003 0.273 0.002 0.075
60-64 - - 3.0 0.2 0.077 0.023 0.0045 0.0028 0.08 56.8 64.7 0.003 0.249 0.001 0.066
65-69 - - 1.9 0.1 0.073 0.017 0.0036 0.0018 0.05 59.1 69.2 0.003 0.226 0.001 0.059
70-74 - - 1.1 0.0 0.069 0.013 0.0020 0.0006 0.02 64.9 73.5 0.002 0.205 0.001 0.053
75-79 - - 0.7 0.0 0.066 0.010 0.0015 0.0005 0.01 69.6 77.6 0.002 0.186 0.001 0.047
80-84 - - 0.4 0.0 0.064 0.007 0.0015 0.0005 0.01 73.1 81.8 0.002 0.167 0.001 0.041
85+ - - 0.2 0.0 0.062 0.005 0.0015 0.0005 0.00 74.4 85.6 0.002 0.151 0.001 0.037
Notes: * Rates vary slightly depending on assumed ratio c1,1,,(x) c1,1,0(x)
s s
l
j , which has been set at 0.65 for l = 1 and 0.35 for
The rate at which low risk individuals acquire new partners is assumed to be a constant multiple of the corresponding rate at which single high risk individuals acquire new partners. This multiple, cgs,2,0(x) cgs,1,0(x), differs for males and females, but is
assumed to be constant with respect to age and HIV disease stage. Although there are no published data indicating plausible values for this multiple, it would be expected that the multiple would be less than 1, and a uniform (0, 1) prior has therefore been assigned to this parameter, for both males and females.
High risk individuals are assumed to acquire new partners at a lower rate if they already have one partner than if they are single. The multiple csg,1,j,l(x) cgs,1,0(x)
)
is specified separately for males and females in non-spousal (l = 1) and spousal (l = 2) relationships, but is assumed to be constant with respect to the individual’s age, HIV disease stage, and the risk group of his or her partner. As there are no published data indicating the likely magnitudes of these parameters, uniform (0, 1) priors have been assigned to each of the four parameters.
Since the parameter determines the rate at which an individual wishes to acquire new partners, it is necessary to apply a balancing factor to this rate in order to achieve consistency between the number of new partnerships formed by men in risk group i with women in risk group j, and the number of new partnerships formed by women in risk group j with men in risk group i. This balancing factor, defined in Appendix A, is updated on a monthly basis, as the relative numbers of males and females in different sexual behaviour states change.
(
, ,
, x
cs l j i g
2.2.3 Rates of marriage
2.2.4 Average durations of partnerships
African surveys in which respondents are asked about the durations of recent non-spousal relationships have generally suggested average durations of between three and 12 months (Nnkoet al. 2004; Ferryet al. 2001; Jewkes et al. 2001). On the basis of these studies, it is assumed that the average duration of non-spousal relationships is six months, and that the rate of relationship termination is constant with respect to the relationship duration.
Registered divorce statistics are used to approximate rates of divorce in South Africa, although these are likely to understate the true rate at which spousal relationships are terminated. This is partly because reporting of divorces is incomplete (Bah 1999), but largely because our definition of spousal relationships includes unmarried cohabiting partners, who might be expected to have a higher rate of separation than couples in formal marriages (Porter et al. 2004). In addition, many formal marriages end in separation, which may precede divorce by several years (van Tonder 1985), and union dissolution is therefore often not reflected in published divorce statistics. To allow for this understatement, it is assumed that rates of spousal union dissolution are two times the age-specific rates of divorce estimated from published divorce statistics in 2004 (Statistics South Africa 2006). The resulting rates of spousal union dissolution are shown in Table 1. Allowance is also made for dissolution of partnerships due to the death of either partner.
2.2.5 Commercial sex
shows the assumed annual frequencies of sex worker contact, by age, for men in the high risk group who are single. Relative to men who currently have no sexual partner, the frequency of sex worker contact is assumed to be reduced by 50% in men who have one non-spousal partner, by 70% in men who have one spousal partner, by 80% in men who have two non-spousal partners, and by 90% in men who have a spousal partner as well as a non-spousal partner.
Women tend to engage in commercial sex work for short periods, mainly out of economic necessity, and the average duration of sex work in African countries is typically estimated to be between one and four years (Rees et al. 2000; Morisonet al. 2001; Abdool Karimet al. 1995). It is therefore assumed that sex workers discontinue sex work at a constant rate of 0.5 per annum. Women are assumed to become sex workers at a rate sufficient to meet the male demand for commercial sex, with the relative rates of entry into sex work at different ages being determined in such a way that the age distribution of sex workers is consistent with that observed in a study of sex workers in Johannesburg (Rees et al. 2000). Studies suggest that South African sex workers usually have between 20 and 25 sex acts with clients per week (Ramjee, Weber, and Morar 1999; Abdool Karimet al. 1995; Rees et al. 2000; Varga 1997a), and on the basis of this evidence, it is assumed that sex workers have an average of 1,000 sex acts with clients per annum.
2.2.6 Preferences regarding partner age and risk group
Mathematical models of sexually transmitted infections traditionally define patterns of mixing between risk groups in terms of a ‘degree of assortative mixing’ parameter, ε, which can take on any value between 0 and 1 (Garnett and Anderson 1996). When ε is 0, sexual mixing is said to be perfectly assortative, i.e., individuals only form relationships with partners in the same group. When ε is 1, sexual mixing is random, and individuals have no preferences regarding the sex activity class of their partner. Data from industrialized nations suggest ε values of between 0.65 and 0.92 (Laumann et al. 1994; Manhartet al. 2002; Garnett et al. 1996; Granathet al. 1991), and data from Botswana suggest a value of 0.53 (Carter et al. 2007). However, it is difficult to estimate ε reliably from empirical data, and Ghani et al. (1998) demonstrate that sampling bias is likely to lead to significant overestimation of ε. There is thus substantial uncertainty regarding the true value of ε, and this parameter has therefore been assigned a beta prior with a mean of 0.6 and a standard deviation of 0.15.
estimated from the 1998 DHS (Department of Health 1999), and the proportions of non-spousal partners in each age group, as estimated from non-spousal partner age differences in South African studies (Williamset al. 2000; Hallman 2004; Kelly 2000; Shisanaet al. 2005). The total numbers of partnerships between women of age x and men of age y are tabulated, and this is used to determine the proportion of female partners in each age group, for men of age y. The resulting estimates of the mean partner age, for men and women separately, are shown in Table 1, and the detailed partner age distributions are shown in the supplementary data file.
2.2.7 Frequency of sex
The method most commonly used to determine coital frequency in sexual behaviour surveys is to ask individuals about the number of times they have had sex in the last four weeks. Estimates of the daily probability of sex in married women obtained using this method typically lie between 0.098 and 0.240 in Southern and Eastern Africa (Brown 2000; Blanc and Rutenberg 1991). However, these reported frequencies are likely to overestimate the true coital frequency among married individuals, as several studies have found that when coital frequency is recorded over shorter time intervals, over which there is likely to be less recall bias, reported coital frequency is lower (Hornsby and Wilcox 1989; Lagarde, Enel, and Pison 1995; Høgsborg and Aaby 1992). It has also been found that coital frequencies among married women reduce significantly as they age (Brewis and Meyer 2005). On the basis of these studies, it is assumed that the average marital coital frequency among married women aged 20 to 24 is five times per month, and that this frequency reduces exponentially with respect to age, halving with every 20-year increase in age. Coital frequencies in married men are calculated to be consistent with these assumptions.
2.2.8 Condom use
Levels of condom use are assumed to depend on the individual’s age and sex and the nature of the relationship they are currently in. Levels of condom use are also assumed to increase over time, as there is strong evidence of trends towards greater condom use in South Africa (Katz and Low-Beer 2008), coinciding with increasing levels of condom distribution (Myer 2005). Table 1 shows the assumed proportions of sex acts in which condoms are used, by the age of the female partner and the relationship type, for two years: 1985 and 2010. The increase in condom use is phased in between these two dates using cumulative Weibull distributions with medians around 1997. The resulting levels of condom use, by age, year, and relationship type, are 40% lower than nationally representative survey estimates of the proportion of individuals using a condom at last sex (Shisanaet al. 2005; Department of Health 2004; Department of Health 1999). This is because survey estimates of the proportion of individuals using a condom at last sex are likely to overestimate the true proportion of recent sex acts that are protected, since individuals who have sex infrequently are more likely to use condoms than those who have sex frequently (Pettiforet al. 2004a; Hargreaves et al. 2007). The difference of 40% is consistent with the finding of Meekers and Van Rossem (2005) that the proportion of sex acts in the last day that were protected is typically around 40% lower than the proportion of individuals reporting use of a condom at last sex.
Separate assumptions are made about the frequency of condom use in contacts between commercial sex workers and their clients. The probability of condom use is assumed to increase from 0.2 in 1985 (Jochelson, Mothibeli, and Leger 1991), to 0.9 ultimately (Peltzer, Seoka, and Raphala 2004). As before, a cumulative Weibull distribution is used to phase in the increase in condom use, and this produces estimates of condom usage in the late 1990s consistent with the rates of around 60% observed at the time (Rees et al. 2000; Williamset al. 2000).
2.2.9 The effect of HIV symptoms and treatment on sexual behaviour
work. Evidence also suggests that sex workers are more likely to discontinue sex work in the later stages of HIV disease (McClellandet al. 2006), and the previously stated rates at which women are assumed to discontinue sex work are therefore increased by multiples shown in Table 2 if women are in more advanced stages of disease. Associated with the reductions in the rate of partner acquisition in the later stages of HIV disease are reductions in fertility. The assumed relative levels of fertility in the different HIV states (shown in Table 2) are based on estimates of the annual reduction in the rate of fertility per year of HIV infection (Johnson, Dorrington, and Matthews 2007) and the observed effects of antiretroviral treatment on fertility (Blairet al. 2004).
Table 2: HIV/AIDS assumptions
Parameter Primary HIV Asymptomatic HIV Pre-AIDS symptoms Untreated AIDS HAART
Average time spent
in stage (in years) 0.25 5.16 4.14 1.96 13.0
Infectiousness per sex act
(relative to stage 2) 10 1 2.5 5 0.5
Partner acquisition rate
(relative to uninfected) 1 1 0.65 0.25 0.8
Rate of entry into sex work
(relative to uninfected) 1 1 0.65 0.25 0.8
Rate of exit from sex work
(relative to uninfected) 1 1 1.5 3 2
Fertility rate
(relative to uninfected) 1 0.92 0.80 0.73 0.94
2.3 HIV/AIDS assumptions
(Johnson, Dorrington, and Matthews 2007; Johnson and Dorrington 2006). These are shown in Table 2.
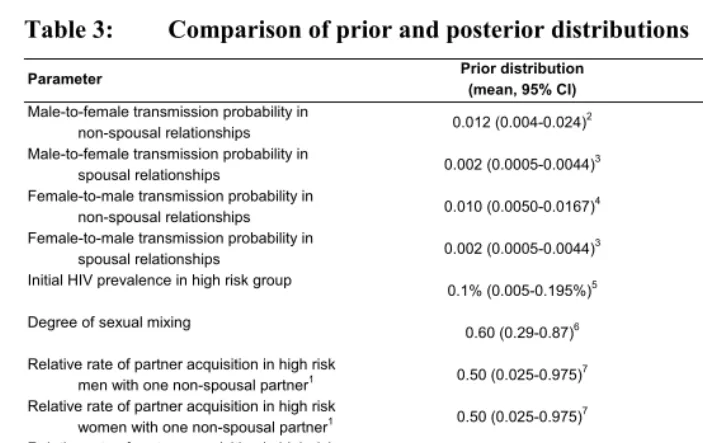
Table 3: Comparison of prior and posterior distributions
Parameter Prior distribution
(mean, 95% CI)
Posterior distribution (mean, 95% CI)
Male-to-female transmission probability in
non-spousal relationships 0.012 (0.004-0.024)
2 0.0065 (0.0044-0.0092)
Male-to-female transmission probability in
spousal relationships 0.002 (0.0005-0.0044)
3 0.0024 (0.0010-0.0044)
Female-to-male transmission probability in
non-spousal relationships 0.010 (0.0050-0.0167)
4 0.0036 (0.0024-0.0052)
Female-to-male transmission probability in
spousal relationships 0.002 (0.0005-0.0044)
3 0.0017 (0.0005-0.0035)
Initial HIV prevalence in high risk group
0.1% (0.005-0.195%)5 0.183% (0.141-0.199%)
Degree of sexual mixing
0.60 (0.29-0.87)6 0.56 (0.40-0.75)
Relative rate of partner acquisition in high risk
men with one non-spousal partner1 0.50 (0.025-0.975)7 0.64 (0.29-0.98)
Relative rate of partner acquisition in high risk
women with one non-spousal partner1 0.50 (0.025-0.975)7 0.54 (0.19-0.95)
Relative rate of partner acquisition in high risk
men with one spousal partner1 0.50 (0.025-0.975)7 0.41 (0.15-0.81)
Relative rate of partner acquisition in high risk
women with one spousal partner1 0.50 (0.025-0.975)7 0.17 (0.04-0.37)
Relative rate of partner acquisition in low risk
men1 0.50 (0.025-0.975)7 0.19 (0.01-0.76)
Relative rate of partner acquisition in low risk
women1 0.50 (0.025-0.975)7 0.60 (0.21-0.97)
Notes: 1 The rate of partner acquisition is expressed as a multiple of that in high risk individuals of the same age and sex who are
currently single.
2 The prior distribution is beta(5.679, 467.56), based on two South African studies of HIV transmission probabilities in young
women (Pettifor et al. 2007; Auvertet al. 2001a). In sex workers, the probability of transmission per act of sex with an infected
client is assumed to be lower (0.003), based on studies of HIV incidence in sex workers (Ramjeeet al. 2005; Hayes, Schulz
and Plummer 1995).
3 The prior distribution is beta(3.99, 1991.01), based on estimates of HIV transmission probabilities in cohabiting couples in
East Africa (Allenet al. 1992; Gray et al. 2001).
4 The prior distribution is beta(10.99, 1088.01), based on estimates of HIV transmission probabilities in unmarried men
(Mahiane et al. 2008; Baeten et al. 2005). The probability of HIV transmission per act of sex with an infected sex worker is assumed to be higher (0.03), based on evidence from Thailand (Mastro et al. 1994).
5 The prior distribution is uniform(0, 0.2%).
6 A beta prior is assumed, with parameters 5.80 and 3.867.
7 The prior distribution is uniform(0, 1).
2.4 Statistical analysis
The model is fitted to data from three sources: (1) antenatal clinic HIV prevalence data from the 1997-2005 period6 for each of five age groups, (2) HIV prevalence data from a
national household survey in 2005 by five-year age group and sex, and (3) data on
numbers of current sexual partners from the same 2005 household survey. The HIV prevalence data have been presented previously (Department of Health 2006; Shisana et al. 2005), and the method used to define the likelihood function in respect of these HIV prevalence data is described in Appendix B. The sexual behaviour data were collected in FTFIs, as part of the 2005 HSRC Household Survey, and are summarized in Table 4. The data relate to the reported numbers of sexual partners at the time of the interview, and are therefore cross-sectional rather than longitudinal or retrospective. Supposing that for a set of model parameters
φ
, the predicted proportion of individuals who have n partners is among individuals of sex g, aged x and of marital status l, the statistical model for the corresponding reported proportion (( )
n|φ, , Pgxl
( )n l x g,,
ψ ) is
( )
( ) (( )) gln gxln
l x g l x g l x g l x g b n P n P n n , , , , , , , , , , , , , | 1 | ln 1 ln ξ ψ ψ + + ⎟ ⎟ ⎠ ⎞ ⎜ ⎜ ⎝ ⎛ − = ⎟ ⎟ ⎠ ⎞ ⎜ ⎜ ⎝ ⎛ − φ φ
, (1)
where bg,l,n is a bias term, representing the extent of misreporting in FTFIs, and ~
N
(
. The terms are the standard errors shown in Table 4. The bg,l,n termsare assumed to be unknown a priori and are therefore estimated directly from the data using the formula:
n l x g,,, ξ 2
, , ,
,σgxln
)
σg,x,l,n0 ( ) ( ) (( ))
∑
⎟⎟ ⎠ ⎞ ⎜ ⎜ ⎝ ⎛ ⎟ ⎟ ⎠ ⎞ ⎜ ⎜ ⎝ ⎛ − − ⎟ ⎟ ⎠ ⎞ ⎜ ⎜ ⎝ ⎛ − =x gxl
l x g l x g l x g n l
g P n
n P n n b φ φ | 1 | ln 1 ln 5 1 ˆ , , , , , , , , , , ψ ψ
. (2)
Due to the small numbers of individuals reporting multiple partners, the likelihood is calculated only for five age groups, and all individuals reporting multiple partners (n > 1) are grouped together. The likelihood function for a single observation, , is calculated as
( )
n l x g,, ψ(
)
(
( ))
(
)
⎟ ⎟ ⎟ ⎠ ⎞ ⎜ ⎜ ⎜ ⎝ ⎛ − − − 2 , , , 2 , , , , , , , , , 2 ˆ | logit ) ( logit exp 2 1 n l x g n l g l x g l x g n l x g b n P n σ ψ σ π φ. (3)
combination, the likelihood of
φ
in respect to the sexual behaviour data, and the likelihood ofφ
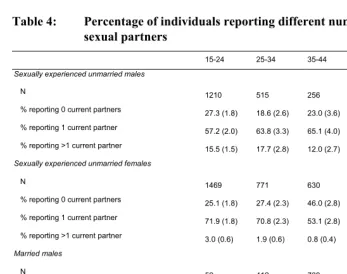
in respect to the HIV prevalence data. The posterior distribution of model predictions was simulated numerically using the Metropolis algorithm (Gelman et al. 2004), with convergence being achieved after a total run length of 100,000 simulations. All programming was done in C++.Table 4: Percentage of individuals reporting different numbers of current
sexual partners
15-24 25-34 35-44 45-59 60+
Sexually experienced unmarried males
N 1210 515 256 198 149
% reporting 0 current partners 27.3 (1.8) 18.6 (2.6) 23.0 (3.6) 39.2 (4.6) 76.1 (5.5)
% reporting 1 current partner 57.2 (2.0) 63.8 (3.3) 65.1 (4.0) 42.6 (5.2) 20.4 (5.2)
% reporting >1 current partner 15.5 (1.5) 17.7 (2.8) 12.0 (2.7) 18.2 (4.4) 3.5 (2.2)
Sexually experienced unmarried females
N 1469 771 630 771 696
% reporting 0 current partners 25.1 (1.8) 27.4 (2.3) 46.0 (2.8) 72.4 (2.4) 98.7 (0.5)
% reporting 1 current partner 71.9 (1.8) 70.8 (2.3) 53.1 (2.8) 26.8 (2.4) 1.3 (0.5)
% reporting >1 current partner 3.0 (0.6) 1.9 (0.6) 0.8 (0.4) 0.9 (0.4) 0.0 (-)
Married males
N 52 412 739 828 437
% reporting 1 current partner 91.6 (5.9) 92.7 (2.0) 95.3 (1.3) 94.2 (1.3) 96.4 (1.5)
% reporting >1 current partner 8.4 (5.9) 7.3 (2.0) 4.7 (1.3) 5.8 (1.3) 3.6 (1.5)
Married females
N 321 800 1154 1160 461
% reporting 1 current partner 98.8 (0.8) 99.4 (0.3) 99.7 (0.2) 99.9 (0.1) 100.0 (-)
% reporting >1 current partner 1.2 (0.8) 0.6 (0.3) 0.3 (0.2) 0.1 (0.1) 0.0 (-)
Individuals were asked to report the number of sexual partners they currently had at the time of the interview. Standard errors are reported in brackets.
2.5 Behaviour change scenarios
the purpose of assessing the likely impact of potential future changes in sexual behaviour:
• ‘Halve concurrence’: It is assumed that the rate at which new partners are acquired is halved among those individuals who are already in partnerships. • ‘Halve partner acquisition’: The rate at which new non-spousal partners are
acquired is halved, but the rate at which marriage occurs is unchanged.
• ‘Halve rate of sexual debut’: The rate at which virgins enter their first sexual relationship is halved (this is equivalent to a roughly two-year increase in the median age at first sex).
• ‘Halve sex worker contacts’: The rate at which men visit commercial sex workers is assumed to be halved.
• ‘Double incidence of marriage’: The age-specific rates of marriage are doubled (this is equivalent to a roughly three-year decrease in the median age at first marriage).
• ‘Halve unprotected non-spousal sex’: The proportion of sex acts in non-spousal relationships that are unprotected is assumed to be halved.
• ‘Halve unprotected spousal sex’: The proportion of sex acts in spousal relationships that are unprotected is assumed to be halved.
3. Results
3.1 Comparison of prior and posterior distributions
low risk group have a rate of partner acquisition approximately 40% lower than that of their counterparts in the high risk group. Men in the low risk group, on the other hand, have a rate of partner acquisition roughly 80% lower than that of men in the high risk group.
3.2 Comparison with HIV prevalence data and sexual behaviour data
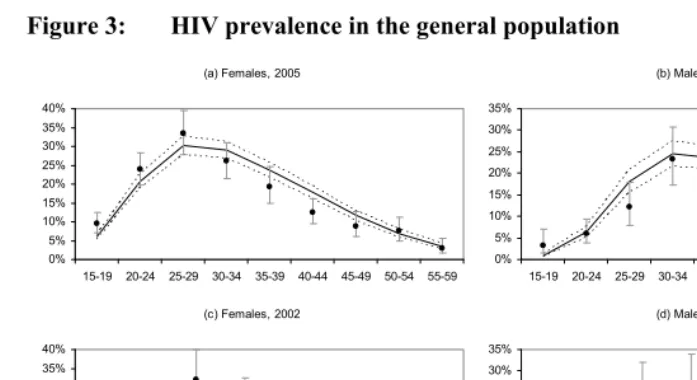
The model fits well to both the HIV prevalence data and the sexual behaviour data. Figure 2 shows that the posterior mean HIV prevalence levels predicted for pregnant women in each five-year age band are reasonably consistent with the results from the national antenatal clinic surveys over the 1997-2005 period, although the irregular trend in HIV prevalence observed in the 15-19 age group (particularly in 1998) is difficult to replicate. In addition, the posterior mean HIV prevalence levels for all pregnant women are consistent with data collected prior to 1997 and after 2005 (Figure 2a), although these data were not included in the likelihood definition due to differences in survey protocols prior to 1997 and after 2005. Model predictions of HIV prevalence in the general population are also consistent with levels of HIV prevalence measured in the 2005 HSRC household survey, as shown in Figures 3a and 3b. The model predictions are further validated by HIV prevalence data collected in a similar household prevalence survey conducted in 2002 (Connolly et al. 2004), although the 2002 data were not used in defining the likelihood function (Figures 3c and 3d).
Figure 2: HIV prevalence in pregnant women attending public antenatal clinics (b) 15-19 0% 5% 10% 15% 20% 25%
1997 1998 1999 2000 2001 2002 2003 2004 2005
(c) 20-24 0% 5% 10% 15% 20% 25% 30% 35%
1997 1998 1999 2000 2001 2002 2003 2004 2005
(d) 25-29 0% 5% 10% 15% 20% 25% 30% 35% 40% 45%
1997 1998 1999 2000 2001 2002 2003 2004 2005 (e) 30-34 0% 5% 10% 15% 20% 25% 30% 35% 40%
1997 1998 1999 2000 2001 2002 2003 2004 2005
(f) 35-39 0% 5% 10% 15% 20% 25% 30% 35%
1997 1998 1999 2000 2001 2002 2003 2004 2005 (a) 15-49 0% 5% 10% 15% 20% 25% 30% 35% 199 0 199 1 199 2 199 3 199 4 199 5 199 6 199 7 199 8 199 9 200 0 200 1 200 2 200 3 200 4 200 5 200 6
Figure 3: HIV prevalence in the general population
(a) Females, 2005
0% 5% 10% 15% 20% 25% 30% 35% 40%
15-19 20-24 25-29 30-34 35-39 40-44 45-49 50-54 55-59
(b) Males, 2005
0% 5% 10% 15% 20% 25% 30% 35%
15-19 20-24 25-29 30-34 35-39 40-44 45-49 50-54 55-59
(c) Females, 2002
0% 5% 10% 15% 20% 25% 30% 35% 40%
15-19 20-24 25-29 30-34 35-39 40-44 45-49 50-54
(d) Males, 2002
0% 5% 10% 15% 20% 25% 30% 35%
15-19 20-24 25-29 30-34 35-39 40-44 45-49 50-54
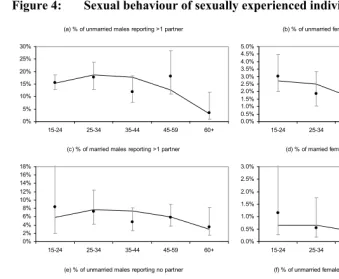
Figure 4: Sexual behaviour of sexually experienced individuals
(a) % of unmarried males reporting >1 partner
0% 5% 10% 15% 20% 25% 30%
15-24 25-34 35-44 45-59 60+
(b) % of unmarried females reporting >1 partner
0.0% 0.5% 1.0% 1.5% 2.0% 2.5% 3.0% 3.5% 4.0% 4.5% 5.0%
15-24 25-34 35-44 45-59 60+
(c) % of married males reporting >1 partner
0% 2% 4% 6% 8% 10% 12% 14% 16% 18%
15-24 25-34 35-44 45-59 60+
(d) % of married females reporting >1 partner
0.0% 0.5% 1.0% 1.5% 2.0% 2.5% 3.0%
15-24 25-34 35-44 45-59 60+
(e) % of unmarried males reporting no partner
0% 10% 20% 30% 40% 50% 60% 70% 80% 90%
15-24 25-34 35-44 45-59 60+
(f) % of unmarried females reporting no current partner
0% 10% 20% 30% 40% 50% 60% 70% 80% 90% 100%
15-24 25-34 35-44 45-59 60+
Figure 5: Proportions of individuals who are married or in cohabiting relationships
(a) Males, 1996
0% 10% 20% 30% 40% 50% 60% 70% 80% 90% 15 -19 20 -24 25 -29 30 -34 35 -39 40 -44 45 -49 50 -54 55 -59 60 -64 65 -69 70 -74 75 -79 80
-84 85+
(b) Females, 1996
0% 10% 20% 30% 40% 50% 60% 70% 80% 15 -19 20 -24 25 -29 30 -34 35 -39 40 -44 45 -49 50 -54 55 -59 60 -64 65 -69 70 -74 75 -79 80
-84 85+
Model 1996 census
(c) Males, 2001
0% 10% 20% 30% 40% 50% 60% 70% 80% 90% 15 -19 20 -24 25 -29 30 -34 35 -39 40 -44 45 -49 50 -54 55 -59 60 -64 65 -69 70 -74 75 -79 80
-84 85+
(d) Females, 2001
0% 10% 20% 30% 40% 50% 60% 70% 80% 15 -19 20 -24 25 -29 30 -34 35 -39 40 -44 45 -49 50 -54 55 -59 60 -64 65 -69 70 -74 75 -79 80
-84 85+
Model 2001 census
(e) Males, 2007
0% 10% 20% 30% 40% 50% 60% 70% 80% 90% 15 -1 9 20 -2 4 25 -2 9 30 -3 4 35 -3 9 40 -4 4 45 -4 9 50 -5 4 55 -5 9 60 -6 4 65 -6 9 70 -7 4 75 -7 9 80 -8 4 85 +
(f) Females, 2007
0% 10% 20% 30% 40% 50% 60% 70% 80% 15 -1 9 20 -2 4 25 -2 9 30 -3 4 35 -3 9 40 -4 4 45 -4 9 50 -5 4 55 -5 9 60 -6 4 65 -6 9 70 -7 4 75 -7 9 80 -8 4 85 + Model 2007 CS
The mean of the posterior model predictions is represented by the solid black line. Reported proportions married or in cohabiting relationships are represented by closed circles.
3.3 The effect of AIDS morbidity and mortality on sexual behaviour
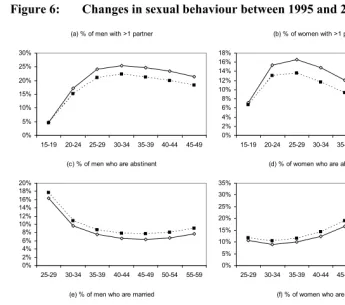
behaviour changes are attributable to the effects of AIDS mortality and morbidity. Figure 6 shows that AIDS has reduced significantly the proportion of men and women with multiple partners, with the reduction among men being greatest between the ages of 40 and 44 (14.6%, 95% CI: 11.4-18.1%) and the reduction among women being greatest between the ages of 35 and 39 (23.1%, 95% CI: 19.9-26.5%). AIDS has also increased significantly the proportion of men and women who have no current partner, with the increase in men being greatest between the ages of 45 and 49 (21.6%, 95% CI: 17.9-26.5%) and the increase in women being greatest between the ages of 35 and 39 (15.9%, 95% CI: 11.8-20.1%). AIDS has also reduced slightly the proportion of the population who are married, though this effect is relatively small. A more significant reduction in the proportion married is likely to have occurred as a result of reducing rates of entry into marriage over time (Garenne 2004), which are not allowed for in the model.
3.4 The profile of new HIV infections, by sexual risk behaviour
Figure 6: Changes in sexual behaviour between 1995 and 2005, by age and sex
(c) % of men who are abstinent
0% 2% 4% 6% 8% 10% 12% 14% 16% 18% 20%
25-29 30-34 35-39 40-44 45-49 50-54 55-59
(d) % of women who are abstinent
0% 5% 10% 15% 20% 25% 30% 35%
25-29 30-34 35-39 40-44 45-49 50-54 55-59
1995 2005 (a) % of men with >1 partner
0% 5% 10% 15% 20% 25% 30%
15-19 20-24 25-29 30-34 35-39 40-44 45-49
(b) % of women with >1 partner
0% 2% 4% 6% 8% 10% 12% 14% 16% 18%
15-19 20-24 25-29 30-34 35-39 40-44 45-49
1995 2005
(e) % of men who are married
20% 30% 40% 50% 60% 70% 80% 90%
25-29 30-34 35-39 40-44 45-49 50-54 55-59
(f) % of women who are married
35% 40% 45% 50% 55% 60% 65% 70% 75%
25-29 30-34 35-39 40-44 45-49 50-54 55-59
1995 2005
Proportions are means of posterior model predictions. Proportions in panels (a)-(d) have not been adjusted to reflect reporting bias (as in Figure 4), i.e., they represent the true proportions of individuals with the indicated numbers of partners.
result of infection by spouses has increased from 9.4% (95% CI: 4.3%-16.3%) to 21.3% (95% CI: 13.0%-29.6%). Although the proportion of new HIV infections occurring in unmarried men (excluding those resulting from commercial sex) has remained relatively stable at around 25%, the proportion of new HIV infections occurring in unmarried women has declined from 47.8% in 1990 (95% CI: 41.0%-54.1%) to 42.5% in 2010 (95% CI: 37.8%-47.3%). The proportion of new HIV infections occurring in sex workers has remained negligibly small at all stages in the epidemic (<0.2%), as this is a relatively small sub-population.
Figure 7: Profile of new HIV infections according to type of sexual risk
behaviour
(a) Number of new HIV infections in 2010, by age
0 10 000 20 000 30 000 40 000 50 000 60 000 70 000 80 000 90 000 10 -14 15 -19 20 -24 25 -29 30 -34 35 -39 40 -44 45 -49 50 -54 55 -59
(b) Profile of new HIV infections in 2010, by age
0% 10% 20% 30% 40% 50% 60% 70% 80% 90% 100% 10 -14 15 -19 20 -24 25 -29 30 -34 35 -39 40 -44 45 -49 50 -54 55 -59
Men infected by sex workers Unmarried women infected by ST partners
Unmarried men infected by ST partners
Married women infected by LT partners
Married men infected by LT partners
Married women infected by ST partners
Married men infected by ST partners
(c) Annual number of new HIV infections over age 10
0 100 000 200 000 300 000 400 000 500 000 600 000 19 90 19 92 19 94 19 96 19 98 20 00 20 02 20 04 20 06 20 08 20 10
(d) Profile of new HIV infections over age 10, by year
0% 10% 20% 30% 40% 50% 60% 70% 80% 90% 100% 19 90 19 92 19 94 19 96 19 98 20 00 20 02 20 04 20 06 20 08 20 10
Men infected by sex workers Unmarried women infected by ST partners
Unmarried men infected by ST partners
Married women infected by LT partners
Married men infected by LT partners
Married women infected by ST partners
Married men infected by ST partners
LT = long-term (spousal); ST = short-term (non-spousal). All proportions and numbers are posterior averages (95% confidence intervals not shown).
3.5 The effect of changes in sexual behaviour
would have been expected over the 1990-2000 period, if the behaviour changes had occurred in 1990. In general, the behaviour changes have a significantly smaller effect on HIV incidence when introduced in the later stages of the HIV/AIDS epidemic (2010) than when introduced in the early stages of the epidemic (1990). As shown in Figure 7, a high level of HIV transmission is occurring in non-spousal relationships, and the greatest reductions in future HIV incidence would therefore be achieved by halving the rate of unprotected sex in non-spousal partnerships (35.9%, 95% CI: 31.8%-40.0%), and by halving the rate at which non-spousal partnerships are formed (15.1%, 95% CI: 13.0%-17.5%). Halving the incidence of concurrent partnerships would be only slightly less effective than halving the incidence of all non-spousal partnerships, with an average reduction of 11.4% (95% CI: 9.8%-13.1%) in HIV incidence. Halving the rate of sexual debut and doubling the incidence of marriage would have relatively little effect on the incidence of HIV. The latter could possibly even be associated with increases in HIV incidence, as condoms are used less frequently in marriage, and the frequency of sex in the early years of marriage is higher than that in non-spousal relationships.
Figure 8: Percentage reductions in numbers of new HIV infections due to
hypothetical behaviour changes
-10% 0% 10% 20% 30% 40% 50% 60% 70% 80%
Halve unprotected non-spousal
sex
Halve partner acquisition
Halve concurrence
Halve unprotected spousal sex
Halve rate of sexual debut
Halve sex w orker contacts
Double incidence of
marriage
1990 2010
Percentage reductions are calculated over the 10 years following the change in the behaviour. Bars represent means of posterior model predictions and error bars represent 95% confidence intervals.
57.5%-71.6%) is less than double the effect of reducing the proportion by 50% (35.9%, 95% interval: 31.8%-40.0%). In contrast, there are increasing marginal returns to reducing the rate at which concurrent partnerships are formed; the effect of reducing the rate of secondary partner acquisition by 100% (38.6%, 95% interval: 31.9%-45.2%) is more than three times the effect of reducing the rate by 50% (11.4%, 95% interval: 9.8%-13.1%). A similar difference in magnitude is estimated when considering the effect of this behaviour change in 1990: reducing the rate of secondary partner acquisition by 100% would have reduced the number of new HIV infections over the 1990-2000 period by 73.9% (95% CI: 68.6%-77.9%), roughly three times the reduction that would have been achieved if the rate of secondary partner acquisition had been halved (24.3%, 95% CI: 20.3%-27.8%). This suggests that the relationship between the rate of secondary partner acquisition and the incidence of HIV is highly non-linear. It also suggests that concurrent partnerships play an extremely important role in the spread of HIV in the early stages of the epidemic.
3.6 Bias in reported sexual behaviour
exp(−bg,l,n The bias parameters estimated in equation (2) can be exponentiated to obtain a ratio of the odds of having n partners to the odds of reporting n partners in an FTFI ( ). The posterior estimates of these odds ratios are shown in Table 5. The results suggest that there is significant underreporting of concurrent partnerships in FTFIs in South Africa, particularly among women and among married individuals. However, there does not appear to be significant under- or over-reporting of being single among unmarried individuals who are sexually experienced.
)
Table 5: Odds ratios for actual behaviour versus reported behaviour
Marital status Behaviour Sex Symbol Odds ratio (95% CI)
Unmarried Multiple current partners M exp(−b1,1,2) 1.26 (0.87-1.54)
F exp(−b2,1,2) 6.3 (3.9-8.2)
Married Multiple current partners M exp(−b1,2,2) 3.3 (2.0-4.3)
F exp(−b2,2,2) 20.6 (9.5-31.0)
Unmarried No current partner M exp(−b1,1,0) 1.16 (0.60-2.00)
4. Discussion
A key conclusion from this analysis is that concurrent partnerships play a major role in the epidemiology of HIV in South Africa, accounting for roughly three-quarters of new HIV infections over the 1990-2000 period. It has been argued that the prevalence of partner concurrence in sub-Saharan Africa is higher than that in other global regions, and that concurrent partnerships may be one of the most important factors explaining the high prevalence of HIV in sub-Saharan Africa (Halperin and Epstein 2004). Mathematical models support the view that partner concurrence is a major factor promoting the spread of HIV (Morris and Kretzschmar 1997; Watts and May 1992), but there has been little effort made to estimate empirically the proportion of HIV incidence that is attributable to concurrent partnerships (Lurie and Rosenthal 2009).
It has also been hypothesized that late age at first marriage – and, more specifically, a long average interval between sexual debut and first marriage – is a key factor driving the spread of HIV, particularly in the countries of Southern Africa, where marriage tends to occur relatively late (Bongaarts 2007). The assumption underlying this argument is that marriage is protective against HIV. However, African studies that have examined the relationship between HIV and marital status have yielded conflicting findings, with some suggesting that marriage is associated with an increased risk of HIV (Auvert et al. 2001b; Clark 2004; Zuma et al. 2003), and others asserting the opposite (Shisanaet al. 2004; Bongaarts 2007). Our analysis suggests that increasing the rate at which individuals marry would have very little effect on HIV incidence, and could possibly even increase HIV incidence, due to the relatively high frequency of unprotected sex in the early years of marriage. However, it is possible that this result may be a reflection of the simplifying assumptions made in the model – for example, the assumption that high risk and low risk individuals marry at the same rate, and the assumption that all marital relationships begin as non-marital relationships. Until there is further investigation into the plausibility of these assumptions, the result should be treated with caution.
and other African countries (Tawfik and Watkins 2007; Orubuloye, Caldwell and Caldwell 1992; de Walque 2007) indicates that it is not uncommon for married women to engage in extramarital relationships, and a significant proportion of HIV infections in married women are likely to be the result of extramarital sex.
Mathematical models have an important role to play in understanding the patterns of sexual behaviour that favour the transmission of HIV. The models that have been developed to address this question can be classified as either static or dynamic: static models are designed to estimate the number of new HIV infections in the short-term future based on assumptions about current HIV prevalence levels (Gouws et al. 2006; Dunkleet al. 2008; Rehleet al. 1998), while dynamic models simulate the entire history of the epidemic and are capable of long-term projections of future HIV incidence (Brown and Peerapatanapokin 2004; van Vliet et al. 2001; Auvert et al. 2000). The advantage of the latter approach is that it provides more detailed output, and the model predictions of past HIV prevalence levels by age and sex provide a useful ‘reality check’ on the plausibility of the model. Like our model, other dynamic models of the HIV/AIDS epidemic in Africa have estimated that the proportion of new HIV infections occurring in non-spousal relationships is substantially greater than the proportion occurring in spousal relationships (van Vlietet al. 2001; Auvertet al. 2000). However, a recent static model of HIV transmission in Zambia and Rwanda estimated that more than half of all sexual transmission in these countries occurs between spousal partners (Dunkleet al. 2008), and another recent dynamic model of HIV transmission in Zambia estimated that almost half of all HIV transmission occurs in spousal unions (Leclerc, Matthews, and Garenne 2009). The relatively high contribution of spousal transmission in these models may be due to the relatively early age at first marriage in Zambia and Rwanda, compared to South Africa (Wellings et al. 2006). It is also likely that these results are partly due to the authors’ assumptions that there is no under-reporting of non-spousal relationships, and that HIV transmission probabilities are the same in spousal and non-spousal relationships. Our analysis suggests that these assumptions are probably unrealistic in the South African setting.
Africa in 1990, when the epidemic was in its early stages, the proportion of new HIV infections currently occurring in commercial sex encounters is only about 1%. Interventions that target commercial sex workers are therefore likely to have relatively little impact on overall HIV incidence in a mature epidemic, i.e., once HIV has reached a high prevalence in the general population.
This analysis suggests that individuals tend to underreport concurrent partnerships substantially in FTFIs. Several alternative interview formats have been tested in an attempt to reduce this bias, including audio-computer-assisted self-interviews (ACASI), informal confidential voting interviews (ICVI), and self-administered questionnaires (SAQ). Using these more impersonal interview techniques, it has been found that women’s odds of reporting multiple sexual partners are between 1.0 and 5.2 times those reported in FTFIs (Ghanem et al. 2005; Kissinger et al. 1999; Rogers et al. 2005; Gregson et al. 2004; Gregsonet al. 2002), with this multiple being considerably higher in married women than in unmarried women (Gregson et al. 2002). Men’s odds of reporting multiple partners in the more impersonal interview formats are between 1.1 and 1.7 times those in FTFIs (Ghanemet al. 2005; Rogerset al. 2005; Gregson et al. 2004; Gregson et al. 2002). The odds ratios that are shown in Table 5 are roughly consistent with the empirical estimates of bias, though the latter tend to be closer to one. It is likely that the alternative interview formats only partially reveal the extent of social desirability bias, since subjects will tend to worry about the confidentiality of their responses even when impersonal interview formats are used, and individuals who have had limited contact with computer technology are likely to be distrustful and fearful of computer-assisted methods (Mensch, Hewett, and Erulkar 2003). Although it is also possible that our model estimates of the extent of the bias may be exaggerated, it would be difficult to achieve consistency with observed age-specific HIV prevalence data if significantly lower levels of bias were assumed.
proportions reporting sexual abstinence, can be expected to occur as a result of HIV/AIDS morbidity and mortality, in the absence of any deliberate change in sexual behaviour. Caution must therefore be applied in the interpretation of cross-survey comparisons that purport to show ‘change’ in sexual behaviour.
As noted previously, most deterministic models of sexual behaviour assign individuals to fixed ‘risk groups’, with no allowance for movements between risk groups, no explicit allowance for concurrent partnerships, and no distinction between spousal and non-spousal relationships. The model presented here avoids the serial monogamy assumption implicit in most deterministic models. In addition to stratifying the population on the basis of rates of partnership formation (the conventional approach in deterministic models), the model stratifies the population on the basis of the actual number of current partners, the risk groups of partners, and the nature of partnerships (spousal/non-spousal), allowing individuals to move between these states as they form new partnerships, marry, and separate. This more realistic approach has several advantages over the approach conventionally adopted in deterministic models. First, it allows for a more detailed assessment of which sexual behaviours are contributing most to the spread of HIV, and which forms of behaviour change would have the greatest impact. Second, sexual behaviour data can be used to determine model parameters more reliably. HIV/AIDS models have typically been calibrated to retrospective data on numbers of partners over some past period (Merli et al. 2006; Leclerc and Garenne 2007); our model, by contrast, is calibrated to data on numbers of current partners at the time of the survey. These data are arguably more important than retrospective data because they provide information on the extent of concurrent partnerships. Retrospective data are affected by recall bias, and, since most surveys ask respondents about the number of partners they have had in the last year, rather than the number of new partners in the last year, they provide little information on the rate at which new partnerships are formed.
of time on an irregular basis, while others may be inclined towards longer-term partner concurrence. Similarly, some ‘low risk’ individuals may be inclined towards long periods of sexual abstinence, while others may be sexually active almost all the time, with relatively short gaps between partnerships. Another simplification that limits the model is the division of the population into five-year age groups; more detailed division by single-year age would be appropriate at young ages, when rates of sexual debut and rates of marriage change relatively quickly (Schoen 1988).
A further limitation of the model is that the rates of transition between the various states are assumed to be independent of the length of time spent in the relevant state. A semi-Markov approach, allowing for duration-dependent transition rates, would be more realistic, particularly in the modelling of divorce and remarriage (Schoen 1988), dissolution of non-marital relationships, and rates of HIV disease progression. However, this would add considerably to the complexity of the model and the time taken to run the model, and would require the estimation of additional parameters from individual-level data. An individual-based stochastic modelling approach might be a more practical means of incorporating duration dependency into the Markov model that we have proposed (Hansen 2000). An added advantage of the stochastic approach is that it would achieve exact consistency between the number of male partnerships and female partnerships formed and/or dissolved (the balancing mechanism used in our model achieves only approximate consistency). However, the stochastic approach would be associated with a considerably greater computational burden when applying standard Bayesian approaches to uncertainty analysis (Sevcikova, Raftery, and Waddell 2006).
with which men visit commercial sex workers, largely due to the uncertainty regarding the extent of male underreporting of this behaviour (Des Jarlais et al. 1999; Lau, Tsui, and Wang 2003; Morison et al. 2001).
There is also a degree of arbitrariness in several of the sexual behaviour parameters that have been chosen: e.g., the proportion of the population in the high risk group, the average duration of non-spousal relationships, and the relative rate of sexual debut in the low risk group. Although attempts were made to include these parameters in the uncertainty analysis, we found it to be extremely difficult to achieve convergence using the Metropolis algorithm if too many parameters were allowed to vary. This is probably because several of the sexual behaviour parameters are collinearly related to one another. In order to determine the sexual behaviour parameters more precisely, it will be necessary to improve the collection of sexual behaviour data. Including questions about durations of recent relationships and questions about whether respondents have ever had more than one sexual partner at a time would be particularly helpful. It is also worth noting that relatively few sexual behaviour surveys ask questions about the number of current partners, and this information is particularly important in fitting the model we have proposed.
Certain types of sexual intercourse have not been considered in this analysis, as they are not conventionally allowed for in models of HIV transmission in Africa. First, we have not considered the incidence of rape. South Africa has one of the highest rates of reported rape in the world (Kim, Martin, and Denny 2003), and this may be particularly significant in accounting for the high HIV prevalence in girls and young women. Second, the model does not allow for men to have sex with other men. Although sex between men is generally not believed to be common in South Africa, few surveys have examined this, and those that have are likely to be subject to significant underreporting. Perhaps particularly significant are the high levels of sex between men in prisons (Gear 2005). Evidence of sex between men in single-sex mine hostels has also been collected, although Moodie and Ndatshe (1994) argue that this ceased to be common after the 1970s. There is clearly a need for further research into the extent of HIV transmission in this marginalized group.
References
Abdool Karim, Q.A., Abdool Karim, S.S., Soldan, K., and Zondi, M. (1995). Reducing the risk of HIV infection among South African sex workers: socioeconomic and gender barriers. American Journal of Public Health 85(11): 1521-1525.
doi:10.2105/AJPH.85.11.1521.
Allen, C.F., Lees, S.S., Desmond, N.A., Der, G., Chiduo, B., Hambleton, I., Knight, L., Vallely, A., Ross, D.A., and Hayes, R.J. (2007). Validity of coital diaries in a feasibility study for the Microbicides Development Programme trial among women at high risk of HIV/AIDS in Mwanza, Tanzania. Sexually Transmitted Infections 83: 490-497. doi:10.1136/sti.2007.024810.
Allen, S., Tice, J., Van de Perre, P., Serufilira, A., Hudes, E., Nsengumuremyi, F., Bogaerts, J., Lindan, C., and Hulley, S. (1992). Effect of serotesting with counselling on condom use and seroconversion among HIV discordant couples
in Africa. British Medical Journal 304(6842): 1605-1609.
doi:10.1136/bmj.304.6842.1605.
Auvert, B., Ballard, R., Campbell, C., Caraël, M., Carton, M., Fehler, G., Gouws, E., MacPhail, C., Taljaard, D., Van Dam, J., and Williams, B. (2001a). HIV infection in a South African mining town is associated with herpes simplex
virus-2 seropositivity and sexual behaviour. AIDS 15: 885-898.
doi:10.1097/00002030-200105040-00009.
Auvert, B., Buanamico, G., Lagarde, E., and Williams, B. (2000). Sexual behaviour, heterosexual transmission, and the spread of HIV in Sub-Saharan Africa: a
simulation study. Computers and Biomedical Research 33: 84-96.
doi:10.1006/cbmr.1999.1533.
Auvert, B., Buvé, A., Ferry, B., Caraël, M., Morison, L., Lagarde, E., Robinson, N.J., Kahindo, M., Chege, J., Rutenberg, N., Musonda, R., Laourou, M., and Akam, E. (2001b). Ecological and individual level analysis of risk factors for HIV infection in four urban populations in sub-Saharan Africa with different levels of HIV infection. AIDS 15(Supplement 4): 15-30.
doi:10.1097/00002030-200108004-00003.
Bah, S. (1999). The improvement of marriages and divorces statistics in South Africa: Relevance, registration issues and challenges. Discussion Paper 99-2. Population Studies Centre, University of Western Ontario. Available: http://sociology.uwo.ca/popstudies/dp/dp99-2.pdf. Accessed Oct 17, 2006.
Bauch, C. and Rand, D.A. (2000). A moment closure model for sexually transmitted disease transmission through a concurrent partnership network. Proceedings of
the Royal Society of London, Series B. 267(1456): 2019-2027.
doi:10.1098/rspb.2000.1244.
Bertozzi, S.M., Laga, M., Bautista-Arredondo, S., and Coutinho, A. (2008). Making
HIV prevention programmes work. Lancet 372(9641): 831-844.
doi:10.1016/S0140-6736(08)60889-2.
Blair, J.M., Hanson, D.L., Jones, J.L., and Dworkin, M.S. (2004). Trends in pregnancy rates among women with human immunodeficiency virus. Obstetrics and Gynecology 103(4): 663-668.
Blanc, A.K. and Rutenberg, N. (1991). Coitus and contraception: the utility of data on sexual intercourse for family planning programs. Studies in Family Planning 22(3): 162-176. doi:10.2307/1966643.
Bongaarts, J. (1989). A model of the spread of HIV infection and the demographic
impact of AIDS. Statistics in Medicine 8(1): 103-120.
doi:10.1002/sim.4780080111.
Bongaarts, J. (2007). Late marriage and the HIV epidemic in sub-Saharan Africa. Population Studies 61(1): 73-83. doi:10.1080/00324720601048343.
Bracher, M., Santow, G., and Watkins, S.C. (2004). Assessing the potential of condom use to prevent the spread of HIV: A microsimulation study. Studies in Family Planning 35(1): 48-64. doi:10.1111/j.1728-4465.2004.00005.x.
Brewer, D.D., Potterat, J.J., Muth, S.Q., Malone, P.Z., Montoya, P., Green, D.L., Rogers, H.L., and Cox, P.A. (2005). Randomized trial of supplementary interviewing techniques to enhance recall of sexual partners in contact
interviews. Sexually Transmitted Diseases 32(3): 189-193.
doi:10.1097/01.olq.0000154492.98350.90.
Brown, M.S. (2000). Coitus, the proximate determinant of conception: inter-country variance in sub-Saharan Africa. Journal of Biosocial Science 32(2): 145-159.
doi:10.1017/S0021932000001450.
Brown, T. and Peerapatanapokin, W. (2004). The Asian Epidemic Model: A process model for exploring HIV policy and programme alternatives in Asia. Sexually Transmitted Infections 80(Supplement 1): 19-24. doi:10.1136/sti.2004.010165. Brunham, R.C. and Plummer, F.A. (1990). A general model of sexually transmitted
disease epidemiology and its implications for control. Medical Clinics of North America 74(6): 1339-1352.
Budlender, D., Chobokoane, N., and Simelane, S. (2004). Marriage patterns in South Africa: Methodological and substantive issues. Southern African Journal of Demography 9(1): 1-26.
Bunnell, R., Ekwaru, J.P., Solberg, P., Wamai, N., Bikaako-Kajura, W., Were, W., Coutinho, A., Liechty, C., Madraa, E., Rutherford, G., and Mermin, J. (2006). Changes in sexual behavior and risk of HIV transmission after antiretroviral therapy and prevention interventions in rural Uganda. AIDS 20(1): 85-92.
doi:10.1097/01.aids.0000196566.40702.28.
Caraël, M., Slaymaker, E., Lyerla, R., and Sarkar, S. (2006). Clients of sex workers in different regions of the world: hard to count. Sexually Transmitted Infections 82(Supplement 3): 26-33.
Carter, M.W., Kraft, J.M., Koppenhaver, T., Galavotti, C., Roels, T.H., Kilmarx, P.H., and Fidzani, B. (2007). "A bull cannot be contained in a single Kraal": Concurrent sexual partnerships in Botswana. AIDS and Behavior 11(6): 822-830. doi:10.1007/s10461-006-9203-6.
Clark, S. (2004). Early marriage and HIV risks in sub-Saharan Africa. Studies in Family Planning 35(3): 149-60. doi:10.1111/j.1728-4465.2004.00019.x.
Connolly, C., Shisana, O., Colvin, M., and Stoker, D. (2004). Epidemiology of HIV in South Africa - results of a national, community-based survey. South African Medical Journal 94(9): 776-781.
Curtis, S.L. and Sutherland, E.G. (2004). Measuring sexual behaviour in the era of HIV/AIDS: the experience of Demographic and Health Surveys and similar enquiries. Sexually Transmitted Infections 80(Supplement 2): 22-27.