1 1
In-silico assessment of implications of simple sequence repeats signature in 98 genomes of
2
Polyomaviridae 3
4 5
Running Title: Microsatellites in Polyomaviridae genomes 6
7 8
Rezwanuzzaman Laskar1, Md Gulam Jilani1, Safdar Ali1*
9
1Clinical and Applied Genomics (CAG) Laboratory
10
Department of Biological Sciences, Aliah University, Kolkata, India 11
RL: [email protected] 12
MGJ: [email protected] 13
14 15 16 17 18
*Corresponding author:
19
Dr Safdar Ali
20
Assistant Professor, 21
Department of Biological Sciences, 22
Aliah University, IIA/27, Newtown 23
Kolkata 700160, India. 24
E-mail: [email protected]; [email protected] 25
Telephone No: 91-33-23416479 26
Fax: 91-33-29860252 27
28 29
2
Abstract
30
The simple sequence repeats (SSRs) are small 1-6bp tandem repeat elements present across 31
diverse genomes and involved in gene regulation and evolution. Presently we analyzed SSRs in 32
genomes of 98 species of family Polyomaviridae across four genera. The genome size ranged 33
from 3962bp (BM87) to 7369bp (BM85) but maximum genomes were in the range of 5 to 5.5 34
kb. The GC% had an average of 42% and ranged between 34.69 (BM95) to 52.35 (BM81). A 35
total of 3036 SSRs and 223 cSSRs were extracted using IMEx with incident frequency from 18 36
to 56 and 0 to 7 respectively. The most prevalent mono-nucleotide repeat motif was “T” 37
(48.95%) followed by “A” (33.48%). “AT/TA” was the most prevalent dinucleotide motif 38
closely followed by “CT/TC”. The distribution was expectedly more in coding region with 39
77.6% SSRs of which nearly half were in Large T Antigen (LTA) gene. Notably, most viruses 40
with humans, apes and related species as host exhibited exclusivity of mono-nucleotide repeats 41
in AT region, a proposed predictive marker for determination of humans as host in virus in 42
course of its evolution. Each genome has a unique SSR signature which is pivotal for viral 43
evolution particularly in terms of host divergence. 44
45
Keywords: Simple Sequence Repeats; Polyomaviridae; Prevalence, Distribution; Virus Host; 46
Evolution 47
3
1. Introduction
53
Simple sequence repeats (SSRs) are ubiquitously present across the genomes of all organisms, 54
albeit with different incidence, complexity and iterations. Ever since the identification of these 55
repeats in multiple species, across coding and non-coding regions, their functional relevance has 56
been explored at different levels (Chen et al., 2012; Gur-Arie et al., 2000; Kofler et al., 2008). 57
Clinical relevance for humans is manifold. For instance, the expansion of these repeats through 58
copy number alterations has been associated with enhancer amplification near oncogenes in 59
cancer as well as in neuronal degradation in multiple neuropathies (Burguete et al., 2015; Hung 60
et al., 2019). 61
Amongst various organisms, viruses are a unique platform to study SSRs owing to their small 62
but rapidly evolving genomes. Further, the dependence of viruses on host cell for survival makes 63
it an easy aspect to study in terms of genome features and evolution. SSRs have been reported to 64
play a role in genome evolution (Bennetzen, 2000) and host range in viruses (Alam et al., 2019). 65
Based on iterations and intervening sequences, tandemly repeated SSRs may be classified into 66
interrupted, pure, compound, interrupted compound, complex or interrupted complex (Chambers 67
and MacAvoy, 2000). At present, we have used Imperfect Microsatellite Extractor (IMEx) for 68
extracting SSRs, wherein mono- to hexa-nucleotide repeat motifs are uncovered, imperfect 69
microsatellites are allowed and compound microsatellites (cSSR: multiple SSRs separated by a 70
distance of less than equal to dMAX) have a dMAX range of 10-50. So, the results need to be 71
assessed within these parameters. 72
Present study focuses on extraction and analysis of microsatellites from genomes of 98 species of 73
Polyomaviridae, which is a family of small, non-enveloped viruses that derives its name 74
4 mammals, avians and fish as their hosts (Ahsan and Shah, 2006). The circular/linear genome 76
generally encodes for two types of proteins. First, the early regulatory proteins which include 77
large tumour antigen (LTAg), small tumour antigen (STAg), middle tumour antigen (MTAg), 78
alternative tumour antigen (ATAg) and putative alternative large tumour antigen (PALTAg). 79
These are pivotal for replication, transcription and maturation of the virus during infection. 80
Second category of genes include those encoding for late structural proteins, which include the 81
major capsid protein, VP1 and minor capsid proteins, VP2 and VP3. As the name suggests these 82
are important for capsid formation (Meijden et al., 2015; Moens et al., 2011). 83
The extraction of SSRs in genomes of Polyomavirus and studying its incidence, distribution and 84
complexity is an attempt to uncover its unique SSR signature which has the potential to not only 85
predict the way these viruses are evolving but also which genome features and regions will be 86
contributing for it. Understanding the viral genomics holds the key to combat unprecedented 87
epidemiological outbreaks. 88
89
2. Materials and Methods
90
2.1.Genome sequences 91
Whole-genome sequence of 98 species of Alphapolyomavirus of family Polyomaviridae across 4 92
different genera which is listed in ICTV (https://talk.ictvonline.org/ictv-93
reports/ictv_online_report/dsdna-viruses/w/polyomaviridae) was retrieved from NCBI
94
(http://www.ncbi.nlm.nih.gov/). These include Alphapolyomavirus (43 species), 95
Betapolyomavirus (33 species), Gammapolyomavirus (9 species) and Deltapolyomavirus (4 96
species). The study also included 9 species yet to be assigned Genera. The details of all the 97
5 number) have been summarized in Supplementary file 1. All the genomes were double stranded 99
DNA, mostly circular except for 10 linear genomes. The information for all the known hosts for 100
these viruses was assessed from Virus-Host
101
Database(https://www.genome.jp/virushostdb/note.html). 102
103
2.2.Microsatellite extraction 104
Microsatellite extraction was carried out using the ‘Advance- Mode’ of IMEx with the 105
parameters reported for HIV (Chen et al., 2012; Mudunuri and Nagarajaram, 2007) and as used 106
for Mycobacteriophages (Alam et al., 2019). Briefly, the parameters included, Repeat, perfect; 107
Repeat Size, all; Minimum Repeat Number 6 (mono-), 3 (di-), 3 (tri-), 3 (tetra-), 3 (penta-), 3 108
(hexa-); Maximum distance allowed between any two SSRs, dMAX: 10. Two SSRs separated by 109
a distance of less than 10bp were thus treated as a single cSSR. In order to understand the SSR 110
density across genomes, the dMAX was subsequently varied to 20, 30, 40, 50 and subsequent 111
changes in cSSR incidence was recorded. It should be noted here that the maximum permissible 112
dMAX value in IMEx is 50, because beyond that the fate of microsatellites is individualistic and 113
hence clubbing it as cSSR becomes irrelevant. Other parameters were set to the defaults. 114
115
2.3.Statistical analysis 116
All statistical analyses performed on the spreadsheet using data Analysis ToolPak of MS Office 117
Suite v2016. Linear regression was used to reveal the correlation between the relative 118
abundance, relative density of microsatellites with genome size and GC%. 119
120
6 Dot plot analysis of two nucleic acid/protein sequences using Genome Pair Rapid Dotter 122
(GEPARD) highlights the presence of SSRs within the genomes (Alam et al., 2019; Krumsiek et 123
al., 2007) to ascertain their evolutionary relationships in context of repeats, reverse matches, and 124
conserved domains. We used GEPARD v1.40 (Krumsiek et al., 2007) in the present study 125
wherein, the viruses were selected for their host exclusivity and SSR sequence complexity; 126
humans and other species, absolute mono-nucleotide repeat motif contribution by A/T and its 127
reduced representation. 128
129
2.5.Evolutionary relationship 130
Alignment and phylogenetic reconstructions were performed using the function "build" of ETE3 131
v3.1.1 (Huerta-Cepas et al., 2016) as implemented on the GenomeNet 132
(https://www.genome.jp/tools/ete/). The tree was constructed using FastTree v2.1.8 with default 133
parameters (Price et al., 2009). Values at nodes are SH-like local support. The final tree for 134
visualization was constructed utilizing the webtool iTOL (interactive Tree Of Life) (Letunic and 135
Bork, 2019). 136
137
3. Results
138
3.1.Genome features 139
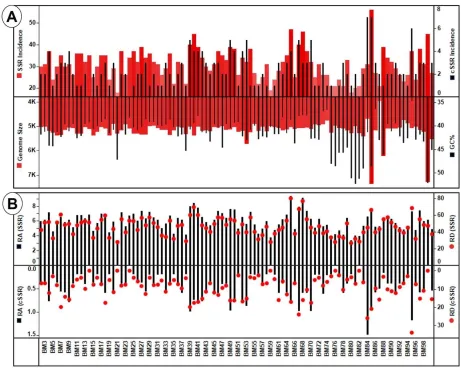
The genome size ranged from 3962bp (BM87) to 7369bp (BM85) but maximum genomes were 140
in the range of 5 to 5.5 kb. However, the GC% with an average of 42% ranged between 34.69 141
(BM95) to 52.35 (BM81) but exhibits much more diversity as compared to genome size (Figure 142
1a, Supplementary file 1). In essence, the Polyomaviridae genomes are mostly of similar sizes, 143
7 incidence has an equal chance across whole genome, irrespective of the composition. then the 145
same should be reflected in the motifs of SSRs present. However, as discussed later, this is not 146
the case. There are several species which have mono-nucleotide motifs exclusively in the AT 147
region. 148
The correlation between genome size and GC content was ascertained with various SSR features. 149
SSR incidence was found to be significantly correlated (R2 = 0.19, P < 0.05) with genome size 150
and GC content (R2 = 0.08, P < 0.05). Though relative density and relative abundance were not 151
significantly correlated with genome size (R2 =0.01, P > 0.05; R2 = 0.005, P > 0.05), significant 152
correlation was observed with GC content (R2 = 0.20, P < 0.05; and R2 = 0.23, P < 0.05) 153
respectively. 154
Further, cSSR incidence is significantly correlated with genome size (R2 =0.06, P < 0.05) but its 155
corresponding relative density (R2 =0.0038, P >0.05) and relative abundance (R2 = 0.004, P 156
>0.05) shows no significant correlation therein. GC content is also significantly correlated for 157
cSSR incidence (R2 = 0.06, P < 0.05), relative density (R2 = 0.11, P < 0.05) and relative 158
abundance (R2 =0.08, P < 0.05). 159
160
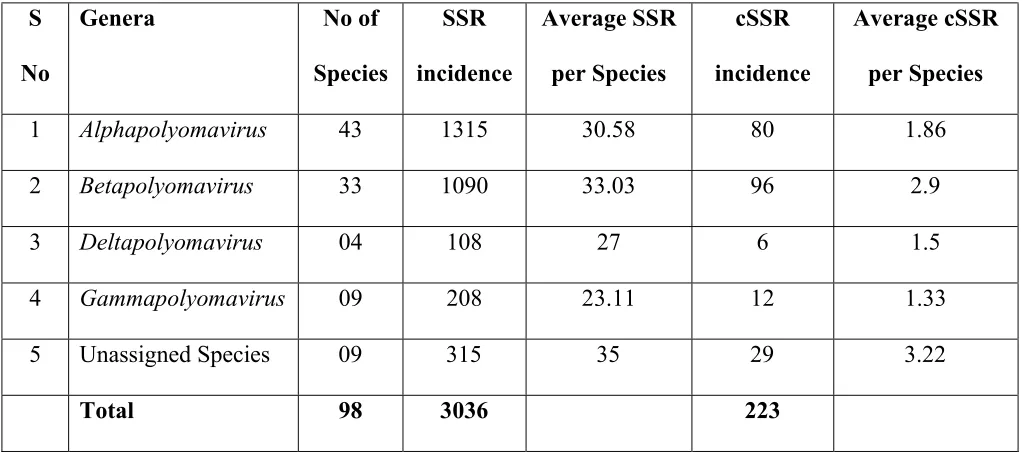
3.2.Incidence of SSRs and cSSRs 161
A total of 3036 SSRs and 223 cSSRs were extracted from the 98 species of Polyomaviridae 162
(Supplementary files 2-4). The average distribution of SSRs and cSSRs per genome varied from 163
23 and 1.3 (Gammapolyomavirus) to 33 and 2.9 (Betapolyomavirus) respectively. Their 164
distribution across genera has been summarized in Table 1. 165
Maximum of 56 SSRs were present in BM85 whereas minimum of 18 was present in BM80 and 166
8 BM21, BM14) to 7 in two species (BM85 and BM84) (Figure 1a). Two interesting but 168
contrasting observations can be made from this data. First, BM85 and BM84 with 7 cSSRs have 169
56 and 31 SSRs in a genome size of 7369 and 4697bp respectively (Supplementary file 2). What 170
it essentially means is that though a longer genome should ideally account for more SSRs but the 171
eventual clustering of SSRs reflected as cSSR incidence remains the same. Thus, the SSR rich 172
regions of genome are independent of genome size. The second aspect is that the above 173
observation is not the norm as is evident from the cSSR range of zero to seven. Multiple 174
genomes of Polyomaviridae with varying number of SSRs have same number of cSSRs. This is 175
highlighted by 29 species having 2 cSSRs (Figure 1a, Supplementary files 2-4) suggesting of a 176
unique genome SSR signature. 177
In order to further highlight the regularity of this anomaly, we looked into cSSR%, which is 178
percentage of SSRs present as cSSRs in a particular genome. Note, the variations in cSSR% are 179
not only across different genera but even within, thereby negating the clustering of SSRs in a 180
genera specific manner (Figure 2a). These are reflective of specific yet variable localizations and 181
clustering of SSRs in a particular genome. 182
183
3.3.Relative abundance (RA) and relative density (RD) of SSRs and cSSRs 184
RA is the number of microsatellites present per kb of the genome whereas RD is the sequence 185
space composed of SSRs of microsatellites per kb of the genome. So, these values are reflective 186
of number of iterations of SSRs present. If the SSRs have a conserved tendency to be iterated, 187
then higher incidence should correspond to elevated RD values. Also, a higher RA value should 188
correspond to high RD value. As observed, BM65 has the highest RA and RD values of 9.32 and 189
9 more genome is comprised of SSRs. The corresponding lowest values for RA and RD was 3.39 191
(BM21) and 26.5 (BM80) respectively (Figure 1b, Supplementary files 2-4). 192
Similarly, the cSSR relative abundance (cRA) and relative density (cRD) was also studied. Since 193
there were 7 species with no cSSR (Figure 1a), hence the minimum cRA and cRD values were 194
zero for these species. The highest values for cRA and cRD were 1.490 (BM84) and 33.93 195
(BM95) respectively (Figure 1b, Supplementary files 2-4). This difference may be due to the 196
differential composition of the cSSRs. 197
198
3.4.dMAX and cSSR 199
cSSR incidence is dependent on the allowed distance (dMAX) between two SSRs for it to be 200
treated as one cSSR. Since cSSR is reflective of clustering of SSRs, and IMEx allows for dMAX 201
values till 50, we analyzed cSSR incidence of Polyomaviridae genomes by varying the dMAX 202
values from initial value of 10 to 20, 30, 40 and 50. Subsequently, % increase was calculated 203
using the given formula. 204
% 𝑖𝑛𝑐𝑟𝑒𝑎𝑠𝑒 = [{𝑐𝑆𝑆𝑅 𝑖𝑛𝑐𝑖𝑑𝑒𝑛𝑐𝑒 𝑎𝑡 𝑑𝑀𝐴𝑋𝑛 − 𝑐𝑆𝑆𝑅 𝑖𝑛𝑐𝑖𝑑𝑒𝑛𝑐𝑒 𝑎𝑡 𝑑𝑀𝐴𝑋 (𝑛 − 10)}
205
÷ 𝑐𝑆𝑆𝑅 𝑖𝑛𝑐𝑖𝑑𝑒𝑛𝑐𝑒 𝑎𝑡 𝑑𝑀𝐴𝑋 (𝑛 − 10)] × 100
206
This % increase was thereon plotted. Though maximum increase is observed for most species 207
when dMAX increased from 10 to 20 as evident from the predominant black bar, it doesn’t 208
conform to a pattern per se (Figure 2b). This means that even in species of the same family, 209
SSRs chart their own path in terms of localizations in each genome. 210
211
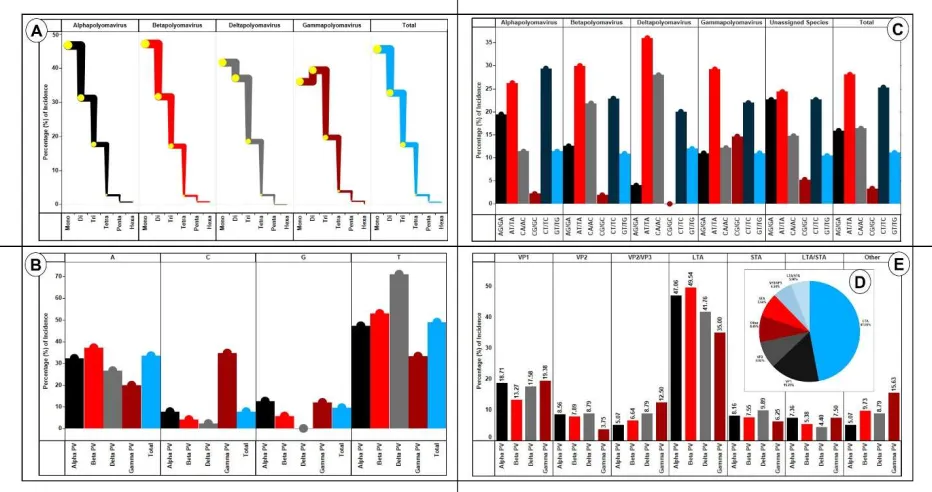
10 First, we wanted to ascertain the contribution of different repeat motif (mono- to hexa) to the 213
overall SSRs incidence. The data was analysed separately for each of the genera. Also, the 214
analysis was done in percentage and not absolute numbers to account for variable number of 215
species across genera. Note that the data from species with unassigned genera wasn’t included 216
herein. The contribution of mononucleotide repeats motifs ranged from 36% 217
(Gammapolyomavirus) to 47% (Betapolyomavirus). Deltapolyomavirus had no incidence of 218
penta- and hexa-nucleotide repeats whereas Gammapolyomavirus lacked hexanucleotide repeats. 219
This can be attributed to fewer species in these genera. Gammapolyomavirus had the highest 220
contribution from di-nucleotide repeats (39.42%) and the only genus to have more di-nucleotide 221
repeats than mono-nucleotide repeats (Figure 3a, Supplementary files 2-3). 222
223
We thereon looked in to the motif composition of mono- and di-nucleotide repeats for their 224
prevalence across the different genera of Polyomaviridae. For the mono-nucleotides, if we look 225
at the overall data, the most prevalent repeat motif is “T” (48.95%) followed by “A” (33.48%). 226
“T” also remains the most prevalent mono-nucleotide motif for Alpha-, Beta- and Delta-227
polyomavirus (47, 52 and 71 percent respectively). However, Gammapolyomavirus has a highest 228
contribution from “C” (34.67%) followed by “T” (33.33%) (Figure 3b, Supplementary files 2-3). 229
Interestingly, the same Gammapolyomavirus has the highest di-nucleotide repeat motif 230
contribution from “AT/TA” (29.27%) motif while Alphapolyomavirus has its largest contribution 231
from “CT/TC” (29.37). Overall, “AT/TA” was the most prevalent dinucleotide repeat motif 232
closely followed by “CT/TC” (Figure 3c). 233
11 3.6.SSRs in coding regions
236
The assessment of SSRs distribution across genome revealed that non-coding region accounted 237
for 679 SSRs (22.4%) whereas coding region comprised of 32 proteins/putative genes/ORFs 238
housed 2357 (77.6%) of SSRs (Supplementary file 2). This aspect of prevalence in coding region 239
conforms to earlier reports about viral SSRs (Alam et al., 2019, 2014). 240
Subsequently, we analyzed the SSR prevalence across different genes of the studied genomes. 241
Six genes accounted for over 92% of SSRs. Overall. the LTag gene alone accounted for over 242
47% of total SSRs with VP1 gene a distant second at around 16% (Figure 3d). Thereafter, we 243
dissected the data across different genera. Interestingly, though LTag gene takes the pole 244
position in housing of SSRs across genera, its contribution varied. In Betapolyomavirus, it was 245
accounting for one in every two SSR (49.54%) while in Gammapolyomavirus, approximately 246
one in every three SSR was housed in LTag gene (35%). This difference permeates to all the 247
genes, albeit to a lesser extent (Figure 3e, Supplementary files 2-3). 248
249
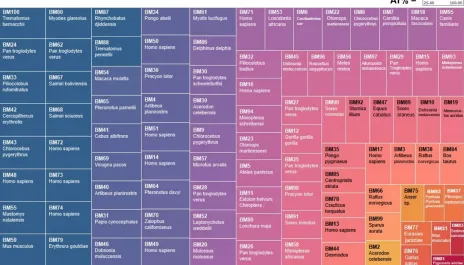
3.7. SSRs (Mono-nucleotide) specificity and host range exclusivity 250
The compilation of different SSRs contribution to overall incidence revealed an interesting 251
observation. Eighteen species had one hundred percent mono-nucleotide SSRs comprising of 252
A/T. Further, majority of these viruses had humans or members of the ape family as their hosts. 253
To elucidate a possible pattern and significance of the same, we arranged all the studied species 254
in decreasing order of their mono-nucleotide SSR contribution by A/T (Figure 4, Supplementary 255
files 1-2). Notably, viruses with humans, apes and related species as hosts have a much higher 256
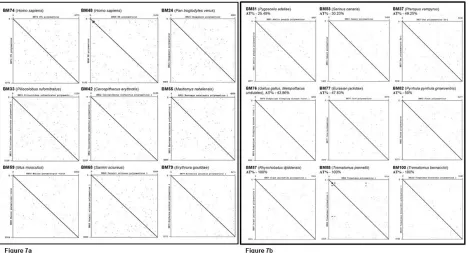
12 Using representative species (9 each) we thereon investigated whether the SSRs composition by 258
A/T and the hosts reflect a pattern. Dotplot analysis was performed for nine species each with 259
humans, apes and related species as hosts (Figure 5a) and nine species with birds, fishes and 260
other species as hosts (Figure 5b). Interestingly, even though three species in figure 4 have 100% 261
mono-nucleotide SSR contribution by A/T (same as Figure 5a), the overall number of dots 262
(reflective of repeat sequences) is higher for all the genomes of figure 5a, representing humans 263
and related species as hosts. 264
265
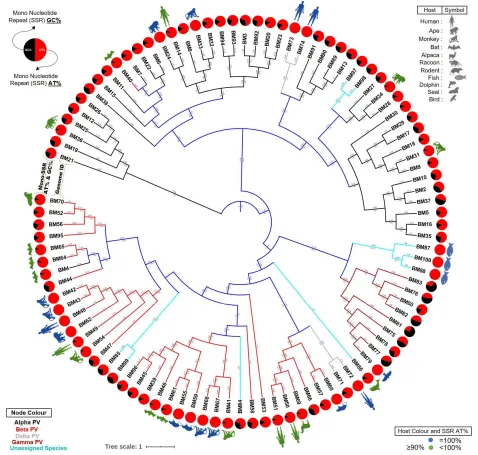
3.8.Phylogenetic tree of Polyomaviridae 266
Subsequently, we constructed the phylogenetic tree of the 98 Polyomaviridae genomes and 267
observed that all the viruses aren’t evolved together as per their hosts. However, hosts do reflect 268
in the tree. Multiple places of clustering of virus with same or related hosts can be observed 269
(Figure 6). The fact that all viruses with human or same hosts don’t follow the pattern is only 270
indicative of other players in genome evolution besides hosts. 271
We thereon superimposed the data for percentage mono-nucleotide SSR contribution by AT 272
region, the phylogenetic analysis and the known hosts. For the sake of clarity, hosts of only those 273
species with >90% mono-nucleotide SSR contribution from AT region are shown as illustrations 274
here, though the complete information is provided in Figure 4. We hypothesize that the presence 275
of mono-repeats in the AT region is somehow providing for viral host flexibility and 276
interchangeability. The same is supported by transmission of HIV which had origins in monkey 277
and Coronavirus which had originally bats as host (19). Both the species are hosts for 278
Polyomavirus genomes having exclusive or near exclusive contribution of mono-SSRs from AT 279
13
4. Discussion
281
Owing to the variable nature of the A/T and G/C regions of the DNA, often these sequences 282
exhibit specific attributes. The significance of AT repeats in strand slippage and copy number 283
polymorphism is well documented (Katti et al., 2001). Though this implies GC content to be an 284
important aspect for SSR studies but it is not necessarily the case primarily because of two 285
reasons. First, because of uneven distribution of SSRs across any genome as observed herein and 286
reported elsewhere as well (Alam et al., 2019, 2013; Chen et al., 2012). This means that certain 287
regions of the genome will have more SSRs than others but this is not driven by GC content. For 288
instance, there are 18 species herein where the complete mono-nucleotide SSRs are localized to 289
the A/T region. The fact that these genomes have maximum GC content of 52%, proves the 290
point. We believe and propose that this unevenness in distribution is not random but with a 291
purpose; most probably host range, as discussed later. Secondly, the prevalence of repeats is 292
dependent on size of repeat motifs, as in what’s applicable to mono-nucleotides, isn’t true for di-293
nucleotides and it also varies from one genus to another. However, two exceptions both in 294
Gammapolyomavirus deserve mention. First, it’s the only genera to have maximum mono-295
nucleotide SSRs as “C”. It’s a deviation from AT region being hub for shorter repeat motifs. 296
Contrastingly, it returns to expected lines with “AT/TA” being the most represented di-297
nucleotide repeat motif. Secondly, we should bear in mind that this genus has lesser number of 298
species (nine) but that may be looked with multiple perspectives. Either we consider the fewer 299
species as the reason for the aberrant observation or we can assume this uniqueness is the reason 300
for fewer species in Gammapolyomavirus. We believe in the latter. 301
14 The study of cSSRs has always been relevant with SSRs owing to their involvement in 303
functional aspects like regulation of gene expression (Chen et al., 2011; Kashi and King, 2006). 304
Essentially, cSSR is a reflection of accumulation of SSRs in the genome. Higher cSSR incidence 305
refers to SSRs present in close proximity to each other and with these being sources of variations 306
and genome evolution (Kim et al., 2008; Madsen et al., 2008), we further looked at cSSRs in 307
terms of cSSR% and by varying dMAX. An increase in cSSR incidence with increasing dMAX 308
is expected and observed as well (Figure 2b). However, the increase not conforming to any 309
pattern as visible by the different lengths of differently coloured lines is indicative of each 310
genomes’ uniqueness. The few instances wherein negative percentage is observed is owing to 311
merging of two independent cSSRs into one with increasing dMAX, thus leading to a decrease in 312
cSSR incidence. Also, the cSSR% varies not only across the genera of Polyomaviridae but also 313
within the species of same genera (Figure 2a). In spite of these variations, of all the reported 314
cSSRs, only 17 are composed of three SSRs and 3 of four SSRs. Rest all are of two SSRs only. 315
There is only one species BM97 which has two cSSRs of more than 3 SSRs each. Other genomes 316
have a single representation only. All the above figures are for dMAX of 10 (Supplementary file 317
4). 318
The distribution of around 78% SSRs across coding regions is in accordance with other viral 319
genomes though the gene specific data (Figure 3d-e) exhibits uniqueness to Polyomaviridae 320
genomes. The overlap of genes is reflected by LTA/STA or VP2/VP3 representation. Presence of 321
SSRs in these overlapping regions can be influential in the scenario that an alteration there would 322
have an impact on two genes simultaneously. The cSSRs constitution ranged from two to four 323
SSRs, albeit with divergent motifs as mentioned above. The distribution of SSRs failed to 324
15 unique but regulated as well. This may be an attempt of the genome to shield itself from changes 326
as clustering of SSRs will lead to developing hotspots for mutations. 327
Though the overall evolution of viruses is guided by multiple factors like host range and genome 328
features, the number and composition of mono-nucleotide SSRs showed a correlation with the 329
hosts and we believe the data has the foundation of predicting the future hosts for any viral 330
species. Our hypothesis stems from the fact that there were eighteen genomes which exhibited 331
mono-nucleotide repeats being exclusively restricted to the AT region. A closer analysis (Figure 332
4) revealed a pattern suggesting humans or related hosts in those genomes. On widening our 333
analysis, we can say with confidence that the contribution of mono-nucleotide SSRs from AT 334
region is pivotal for host range determination. Earlier studies on evolution of Polyomavirus have 335
suggested gene duplications and inversions as sources for variations in genome size and also 336
predicted their prior existence in invertebrate hosts indicating an evolving virus family in terms 337
of host (Buck et al., 2016). This becomes all the more relevant when we look at the suggested 338
organisms on the basis of this study to share a common/interchangeable host range for viruses. 339
This includes monkeys (HIV) and Bats (Coronavirus) (Parrish et al., 2008). We accept that the 340
correlation between mono-repeat from AT region and host is not universal suggesting other 341
influencing factors but it’s presence in species across genera demands further authentication of 342
the idea. 343
The fact that mutational and evolving nature of viral genes are responsible for host susceptibility 344
and genome evolution makes it important and interesting to explore the role of microsatellites 345
present as unique SSR signature in each genome to be able to predict and be prepared for yet to 346
happen evolutionary pathogenesis of viruses. 347
16
Acknowledgements
349
The authors thank Department of Biological Sciences, Aliah University, Kolkata, India for all the 350
financial and infrastructural support provided. 351
Authors Disclosure Statement
352
No competing financial interests exist 353
Authors' contributions
354
RL performed all the analysis of extracted SSRs and prepared all the figures and tables. MGJ 355
carried out the extraction of microsatellites from IMEx. SA supervised the whole study and 356
prepared the manuscript. 357
358
References
359
Ahsan, N., Shah, K.V., 2006. Polyomaviruses and human diseases. Adv. Exp. Med. Biol. 577, 1– 360
18. https://doi.org/10.1007/0-387-32957-9_1 361
Alam, C.M., Iqbal, A., Sharma, A., Schulman, A.H., Ali, S., 2019. Microsatellite Diversity, 362
Complexity, and Host Range of Mycobacteriophage Genomes of the Siphoviridae 363
Family. Frontiers in Genetics 10. https://doi.org/10.3389/fgene.2019.00207 364
Alam, C.M., Singh, A.K., Sharfuddin, C., Ali, S., 2014. Incidence, complexity and diversity of 365
simple sequence repeats across potexvirus genomes. Gene 537, 189–196. 366
https://doi.org/10.1016/j.gene.2014.01.007 367
Alam, C.M., Singh, A.K., Sharfuddin, C., Ali, S., 2013. In-silico analysis of simple and 368
imperfect microsatellites in diverse tobamovirus genomes. Gene 530, 193–200. 369
https://doi.org/10.1016/j.gene.2013.08.046 370
Bennetzen, J.L., 2000. Transposable element contributions to plant gene and genome evolution. 371
Plant Mol. Biol. 42, 251–269. 372
Buck, C.B., Doorslaer, K.V., Peretti, A., Geoghegan, E.M., Tisza, M.J., An, P., Katz, J.P., Pipas, 373
J.M., McBride, A.A., Camus, A.C., McDermott, A.J., Dill, J.A., Delwart, E., Ng, T.F.F., 374
17 The Ancient Evolutionary History of Polyomaviruses. PLOS Pathogens 12, e1005574. 376
https://doi.org/10.1371/journal.ppat.1005574 377
Burguete, A.S., Almeida, S., Gao, F.-B., Kalb, R., Akins, M.R., Bonini, N.M., 2015. GGGGCC 378
microsatellite RNA is neuritically localized, induces branching defects, and perturbs 379
transport granule function. eLife 4, e08881. https://doi.org/10.7554/eLife.08881 380
Chambers, G.K., MacAvoy, E.S., 2000. Microsatellites: consensus and controversy. Comp. 381
Biochem. Physiol. B, Biochem. Mol. Biol. 126, 455–476. 382
Chen, M., Tan, Z., Zeng, G., Zeng, Z., 2012. Differential distribution of compound 383
microsatellites in various Human Immunodeficiency Virus Type 1 complete genomes. 384
Infect. Genet. Evol. 12, 1452–1457. https://doi.org/10.1016/j.meegid.2012.05.006 385
Chen, M., Zeng, G., Tan, Z., Jiang, M., Zhang, J., Zhang, C., Lu, L., Lin, Y., Peng, J., 2011. 386
Compound microsatellites in complete Escherichia coli genomes. FEBS Lett. 585, 1072– 387
1076. https://doi.org/10.1016/j.febslet.2011.03.005 388
Gur-Arie, R., Cohen, C.J., Eitan, Y., Shelef, L., Hallerman, E.M., Kashi, Y., 2000. Simple 389
sequence repeats in Escherichia coli: abundance, distribution, composition, and 390
polymorphism. Genome Res. 10, 62–71. 391
Huerta-Cepas, J., Serra, F., Bork, P., 2016. ETE 3: Reconstruction, Analysis, and Visualization 392
of Phylogenomic Data. Mol Biol Evol 33, 1635–1638. 393
https://doi.org/10.1093/molbev/msw046 394
Hung, S., Saiakhova, A., Faber, Z.J., Bartels, C.F., Neu, D., Bayles, I., Ojo, E., Hong, E.S., 395
Pontius, W.D., Morton, A.R., Liu, R., Kalady, M.F., Wald, D.N., Markowitz, S., 396
Scacheri, P.C., 2019. Mismatch repair-signature mutations activate gene enhancers across 397
human colorectal cancer epigenomes. eLife 8, e40760. 398
https://doi.org/10.7554/eLife.40760 399
Kashi, Y., King, D.G., 2006. Simple sequence repeats as advantageous mutators in evolution. 400
Trends Genet. 22, 253–259. https://doi.org/10.1016/j.tig.2006.03.005 401
Katti, M.V., Ranjekar, P.K., Gupta, V.S., 2001. Differential distribution of simple sequence 402
repeats in eukaryotic genome sequences. Mol. Biol. Evol. 18, 1161–1167. 403
18 Kim, T.-S., Booth, J.G., Gauch, H.G., Sun, Q., Park, J., Lee, Y.-H., Lee, K., 2008. Simple 405
sequence repeats in Neurospora crassa: distribution, polymorphism and evolutionary 406
inference. BMC Genomics 9, 31. https://doi.org/10.1186/1471-2164-9-31 407
Kofler, R., Schlötterer, C., Luschützky, E., Lelley, T., 2008. Survey of microsatellite clustering 408
in eight fully sequenced species sheds light on the origin of compound microsatellites. 409
BMC Genomics 9, 612. https://doi.org/10.1186/1471-2164-9-612 410
Krumsiek, J., Arnold, R., Rattei, T., 2007. Gepard: a rapid and sensitive tool for creating dotplots 411
on genome scale. Bioinformatics 23, 1026–1028.
412
https://doi.org/10.1093/bioinformatics/btm039 413
Letunic, I., Bork, P., 2019. Interactive Tree Of Life (iTOL) v4: recent updates and new 414
developments. Nucleic Acids Research 47, W256–W259. 415
https://doi.org/10.1093/nar/gkz239 416
Madsen, B.E., Villesen, P., Wiuf, C., 2008. Short tandem repeats in human exons: a target for 417
disease mutations. BMC Genomics 9, 410. https://doi.org/10.1186/1471-2164-9-410 418
Meijden, E. van der, Kazem, S., Dargel, C.A., Vuren, N. van, Hensbergen, P.J., Feltkamp, 419
M.C.W., 2015. Characterization of T Antigens, Including Middle T and Alternative T, 420
Expressed by the Human Polyomavirus Associated with Trichodysplasia Spinulosa. 421
Journal of Virology 89, 9427–9439. https://doi.org/10.1128/JVI.00911-15 422
Moens, U., Ludvigsen, M., Van Ghelue, M., 2011. Human Polyomaviruses in Skin Diseases 423
[WWW Document]. Pathology Research International. 424
https://doi.org/10.4061/2011/123491 425
Mudunuri, S.B., Nagarajaram, H.A., 2007. IMEx: Imperfect Microsatellite Extractor. 426
Bioinformatics 23, 1181–1187. https://doi.org/10.1093/bioinformatics/btm097 427
Parrish, C.R., Holmes, E.C., Morens, D.M., Park, E.-C., Burke, D.S., Calisher, C.H., Laughlin, 428
C.A., Saif, L.J., Daszak, P., 2008. Cross-Species Virus Transmission and the Emergence 429
of New Epidemic Diseases. Microbiol. Mol. Biol. Rev. 72, 457–470. 430
https://doi.org/10.1128/MMBR.00004-08 431
Price, M.N., Dehal, P.S., Arkin, A.P., 2009. FastTree: Computing Large Minimum Evolution 432
Trees with Profiles instead of a Distance Matrix. Molecular Biology and Evolution 26, 433
1641–1650. https://doi.org/10.1093/molbev/msp077 434
19 436
437
Figure 1: A) Genome features and SSR/cSSR incidence of Polyomaviridae genomes. Though 438
genome size is predominantly around 5-5.5kb as evident by fairly constant level of red bars 439
whereas the corresponding GC variations (superimposed black bars) have a much broader range. 440
Also, note the diversity in SSRs incidence in genomes of similar length. Furthermore, higher 441
SSR incidence doesn’t necessarily translate to more cSSRs. B)Relative abundance (RA) and
442
relative density (RD) of SSRs and cSSRs. RA is the number of microsatellites present per kb of 443
the genome whereas RD is the sequence space composed of SSRs of microsatellites per kb of the 444
20 446
Figure 2: A) cSSR% in the studied Polyomaviridae genomes. Percentage of individual SSRs 447
as part of cSSRs is cSSR%. The data for all the genera are differentially coloured. Not only there 448
is diversity across the genera but also within the genomes of the same genera as well. 449
Interestingly, BM84 which has the highest cSSR% is yet to be classified into any genera. B)
450
Percentage increase in cSSR incidence with increasing dMAX (10 to 50). Note the non-451
linearity in increase. Negative bars represent decrease in cSSR incidence when two cSSRs merge 452
into one with increasing dMAX. 453
21 455
Figure 3: A) SSR incidence and motif length. An increase in repeat motif resulted in lesser 456
incidence, inverse proportionality, which is expected. However, two observations should be 457
noted. Firstly, Gammapolyomavirus is the only genera where the highest incidence is of di-458
nucleotide repeat motifs. All others have mono-nucleotide motif as most represented along 459
expected lines. Second, the fall in incidence from mono- to di-nucleotide motif SSRs is the least 460
in Deltapolyomavirus. B) Mono-nucleotide motif composition. In spite of varying GC 461
percentage (Figure 1), the mono-nucleotide motif composition is very much biased towards A/T 462
across all genera. Total represents overall data. C) Di-nucleotide motif composition. Though 463
AT/TA is the most represented di-nucleotide repeat motif overall, it doesn’t enjoy the same 464
status across all genera, with Alphapolyomavirus being the exception. Here, CT/TC has the 465
highest incidence closely followed by AT/TA. D) Distribution of SSRs (%) across different
466
proteins. Overall, LTA accounted for over 47% of all SSRs in the coding region with VP1 467
coming a distant second at around 16%. Only the 6 proteins which accounted for highest SSRs 468
were included, the rest have been collectively taken as “Others”. E) SSRs contribution (%) by
469
proteins across different genera. Herein, subtle variations are visible. Though LTA gene 470
accounts for maximum SSRs in the coding genome across all the genera but the contributing 471
percentage varies from 35% in Gammapolyomavirus to almost 50% in Betapolyomavirus. 472
22 477
Figure 4: Genomes with decreasing % of A/T mono-nucleotides repeat motif. Though, not 478
perfect, the similar values for humans and related species suggests host range dependency on 479
SSR distribution across AT genome regions. Higher the contribution of mono-nucleotide repeat 480
motifs from AT region, greater are the chances that it will have humans or related species as its 481
host. 482
23 486
Figure 5: Dotplot analysis of Polyomaviridae genomes with A) Human, apes or related species 487
as hosts with mono-nucleotide repeat motif contribution of 100% from the AT region and B)
488
Divergent hosts with varying mono-nucleotide repeats in the AT region. 489
24 492
Figure 6: Phylogenetic and Host range Analysis. The phylogenetic tree is based on whole 493
genome sequence alignment with few important observations. First, the unassigned species are 494
sharing nodes with different genera and hence their cumulative data need to be assessed with 495
care. Secondly, the circles representing mono-nucleotide SSR contribution indicate that those 496
genomes with exclusive mono-nucleotide SSR in the AT region are distributed across all genera, 497
albeit with varying frequency. Thirdly, the selective representation of host for genomes has been 498
done in two categories, those with exclusive mono-SSRs in AT region (100% indicated by 499
complete orange circle) and those with (90≤ mono-SSRs in AT region <100). It suggests their 500
host range potential which is supported by recent Coronavirus transmission from bats. 501
25 504
Table 1: SSR and cSSR incidence across the different genera of Polyomaviridae 505
S
No
Genera No of
Species
SSR
incidence
Average SSR
per Species
cSSR
incidence
Average cSSR
per Species
1 Alphapolyomavirus 43 1315 30.58 80 1.86
2 Betapolyomavirus 33 1090 33.03 96 2.9
3 Deltapolyomavirus 04 108 27 6 1.5
4 Gammapolyomavirus 09 208 23.11 12 1.33
5 Unassigned Species 09 315 35 29 3.22
Total 98 3036 223
26
Supporting information
519
Supplementary file S1: Details of Polyomaviridae genomes used in the study. Genome features 520
(NCBI Accession number, size, shape and GC%); virus details (Classification, name, 521
abbreviation) and Host details are summarized. 522
523
Supplementary file S2: SSRs and cSSRs extracted form studied Polyomaviridae genomes. RA 524
is the number of microsatellites present per kb of the genome whereas RD is the sequence space 525
composed of SSRs of microsatellites per kb of the genome. The corresponding value for cSSR 526
has been represented by cRA and cRD. Overall SSR incidence, tract size as well as for individual 527
repeat motifs along with their localization and other features are mentioned. 528
529
Supplementary file S3: Raw data for distribution of SSRs found in the Polyomaviridae 530
genomes. This includes consensus sequence, number of iterations, tract size, their start and end 531
positions along with localization (Coding/Non coding). 532
533
Supplementary file S4: Raw data for distribution of cSSRs found in the Polyomaviridae 534
genomes. This includes composition of the cSSRs, their iterations and their positioning on the 535
genome (start/end). 536