Analysis of the Generation and Segregation of Propagons: Entities That
Propagate the [PSI
ⴙ] Prion in Yeast
Brian Cox, Frederique Ness and Mick Tuite
1Research School of Biosciences, University of Kent, Canterbury, Kent CT2 7NJ, United Kingdom Manuscript received February 26, 2003
Accepted for publication April 2, 2003
ABSTRACT
The propagation of the prion form of the yeast Sup35p protein, the so-called [PSI⫹] determinant, involves the generation and partition of a small number of particulate determinants that we propose calling “propagons.” The numbers of propagons in [PSI⫹] cells can be inferred from the kinetics of elimination of [PSI⫹] during growth in the presence of a low concentration of guanidine hydrochloride (GdnHCl). Using this and an alternative method of counting the numbers of propagons, we demonstrate considerable clonal variation in the apparent numbers of propagons between different [PSI⫹] yeast strains, between different cultures of the same [PSI⫹] yeast strain, and between different cells of the same [PSI⫹] culture. We provide further evidence that propagon generation is blocked by growth in GdnHCl and that it is largely confined to the S phase of the cell cycle. In addition, we show that at low propagon number there is a bias toward retention of propagons in mother cells and that production of new propagons is very rapid when cells with depleted numbers of propagons are rescued into normal growth medium. The implications of our findings with respect to yeast prion propagation mechanisms are discussed.
T
HE [PSI⫹] factor ofSaccharomyces cerevisiaeis inher- denses into sedimentable high molecular weight aggre-ited in an extrachromosomal fashion and is propa- gates or forms amyloid fibrils. The sequestration of gated by a prion-like mechanism similar to that pro- Sup35p in aggregates in its -form and concomitant posed for the infectious properties of mammalian depletion of the functional␣form are held to be respon-transmissible spongiform encephalopathies (TSEs;Wick- sible for the [PSI⫹] phenotype, namely enhanced sup-ner1994). There is now considerable genetic and bio- pression of nonsense mutations (reviewed inSerioand chemical evidence to support the prion theory for Lindquist1999). However, it remains to be established [PSI⫹] (seeWicknerand Chernoff 1999;Serioand whether any of this is true in living cells. For instance, Lindquist1999, 2000 for recent reviews). The prion it is not known what—if any—process is involved in protein involved, Sup35p (also called eRF3), is essential converting␣ to or whether special processes are in-for the propagation of the [PSI⫹] phenotype; for exam- volved in formation of aggregate/amyloid fibers from ple, variousSUP35gene mutations in the region encod- -form Sup35p, whether amyloid itself is sufficient to ing the N terminus of Sup35p affect the transmission promote␣toconversion, or whether some intermedi-of the [PSI⫹] phenotype (Ter-Avanesyan et al. 1993; ate stage or complex is involved. In particular, it is not Doelet al.1994;De Paceet al.1998;LiuandLindquist known how the ability to maintain [PSI⫹] is passed from 1999;Parhamet al.2001). Furthermore, Sup35p forms mother to daughter cells to promote stable inheritance. amyloid-like fibrilsin vitro, especially if seeded with ma- It may depend on a random diffusion of prions between terial from a [PSI⫹] strain (Paushkin et al. 1997; De mother and daughter cells at cell division; a propagating Paceet al.1998;Serioet al.2000), whilein vivo, much module may be replicated in synchrony with cell divi-of the Sup35p in [PSI⫹] cells sediments in the S100- sion, or there may be a cycle of accretion to, and degra-pelletable fraction of cell-free lysates (Patinoet al.1996;dation of, Sup35p-containing aggregates. Paushkinet al. 1996). Yet little is known about the mode
There are several lines of evidence that [PSI⫹] inheri-of propagation inheri-of the [PSI⫹] prion.
tance is particulate. For example, when newly formed By analogy with PrP of mammals (Prusineret al.1998),
zygotes between [PSI⫹] and [psi⫺] cells are sporulated, Sup35p must exist in two forms, let us say␣(normal) and
the spores that are formed either give rise to clonally (prion), and the presence of the-form is sufficient
pure [PSI⫹] and prion-free [psi⫺] colonies or give rise to convert molecules in the ␣-form to , which
con-to seccon-tored colonies, without intermediate phenotypes (YoungandCox1971). However, the clearest evidence that the inheritance of [PSI⫹] is particulate has come 1Corresponding author:Research School of Biosciences, University of
from studies on the kinetics of [PSI⫹] elimination when
Kent, Canterbury, Kent CT2 7NJ, United Kingdom.
E-mail: [email protected] propagation of the [PSI⫹] determinant is blocked using
low concentrations (1–3 mm) of guanidine hydrochlo- mation about the structure of these materials in vivo
nor about whether they are the entities that propagate ride (GdnHCl;Tuiteet al.1981;Eaglestoneet al.2000;
Ferreiraet al.2001;JungandMasison2001). the [PSI⫹] phenotype. To maintain a distinction be-tween aggregates or fibers and entities that propagate These studies led to four main conclusions: (a) the
cells behaved as if they normally contained a certain the [PSI⫹] phenotype, we propose that the latter be referred to as “propagons.”
number of [PSI⫹] “seeds”, (b) these numbers ceased to increase while the cells were growing in GdnHCl, so that the average number per cell was halved at each
MATERIALS AND METHODS
generation regardless of the rate of growth, (c)
segrega-tion of the remaining seeds was completely random at Yeast strains:The following strains ofS. cerevisiaewere used in this study:
each cell division, and (d) propagation of [PSI⫹] was
restored in any cell containing one or more seeds imme- BSC783/4a, MAT␣, ade2-1UAA, his3-11, -15, leu2-3, -119,
ura3-diately on return to medium lacking GdnHCl. Further- 1, SUQ5,[PSI⫹];
BSC783/4c,MATa, ade2-1UAA, his3-11, -15, leu2-3, -119, ura3-1,
more, the numbers of cells having the ability to grow
SUQ5,[PSI⫹];
into [PSI⫹] cultures reaches a constant level during
BSC772/18c, MATa, ade2-1UAA, his4-712, leu2-3, -119, ura3-1,
continued growth in the presence of GdnHCl (Cox
SUQ5,[PSI⫹];
1993). If a culture goes into stationary phase before 74-D694,MATa, ade1UGA, his3-11, -15, leu2-3, -119, ura3, trp1,
curing of [PSI⫹] is complete, the numbers of [PSI⫹] [PSI⫹] (strong) or (weak);
BSC783/4a⫻BSC772/18c [PSI⫹], diploid strain;
cells remain constant, suggesting that GdnHCl does not
BSC783/4a⫻BSC783/4c [PSI⫹], diploid strain.
destroy [PSI⫹] seeds, but merely prevents their
replica-tion. If this model is correct, one can predict N0, the Growth media:General growth medium was YPD: 1% pep-tone, 1% yeast extract, 2% dextrose. For distinguishing [PSI⫹]
initial number of [PSI⫹] particles per cell, from the
from [psi⫺] colonies growing on solid medium,1⁄4YE medium
number of generations it takes to “cure” the culture.
(0.25% yeast extract, 1% peptone, 4% dextrose) was used.
Eaglestone et al. (2000) presented a mathematical
On 1⁄4YE medium, ade1 or ade2 adenine-requiring colonies
model based on a random binomial distribution of parti- are deep red while adenine-independent colonies are white. cles at cell division, which arrived at a number forN0 Synthetic medium for selection of prototrophs was based on 0.67% yeast nitrogen base (YNB) without amino acids (Difco,
of 62.
Detroit), 2% in dextrose with appropriate supplements (
Kai-Here we address four questions arising from the
stud-seret al.1994).
ies ofEaglestoneet al.(2000):
Cell plating and counting:The methods used were those essentially described byEaglestoneet al.(2000), except that
1. Is the valueN0⫽62 constant or peculiar to the strain
the constant small numbers of colonies sectored red ([psi⫺])
of yeast and/or the culture conditions used?
and white ([PSI⫹]) were not counted as coming from two
2. Eaglestoneet al.(2000) showed that on transfer of cells but as derived from one [PSI⫹] cell. This is because, for a partially “cured” culture, from GdnHCl to ordinary the purposes of calculation, the relevant numbers are those
of cells plated of thep0class,i.e., having no [PSI⫹] propagons.
growth medium, no further segregation of [psi⫺]
We make the assumption that sectored colonies can arise only
cells was observed, although with only a few particles
from cells that contained at least one propagon at the time
remaining per cell, random segregation should have
of plating onto the agar.
caused further segregation. We have considered two Calculating N0, the number of propagons per cell: The ways of accounting for this: (a) the recovery of a model for [PSI⫹] segregation presented byEaglestoneet al.
(2000) is based on an iteration of a binomial distribution of
sufficiently high number of seeds occurs very rapidly
random numbers of propagons at each generation and
re-on return to normal growth medium, taking less than
quires a unique computer program. The same predictions
one generation, or (b) individual seeds are
segre-can be obtained by using the Poisson formula for random
gated by an independent physical structure so that distribution of small numbers of objects or events in defined they enjoy a nonrandom segregation, but the num- blocks of space or time (Figure 1). In our experimental system,
the blocks of space are yeast cells and the “objects” are the
ber of the segregating structures carrying [PSI⫹]
par-propagons. This formula gives the result that when a random
ticles is reduced by the lack of [PSI⫹] generation
distribution is such that there is, on average, one propagon
in the presence of GdnHCl. This would give the
per cell (for example) there will be 36.8% of the cells in
appearance of random segregation during growth in the p0, i.e., [psi⫺] class. Thus, if the data are plotted as the GdnHCl medium, until cells were returned to nor- percentage of [PSI⫹] cells as a function of generations of
growth in GdnHCl medium, when 63.2% is reached,N0can
mal medium when their replication and directed
be found from the value of 2g, where g is the number of
segregation would stop further loss of seeds.
generations elapsed at that moment, assuming that the
propa-3. Do [PSI⫹] seeds and the cells that contain them
gon number halves at each generation. Indeed, N0can be
survive GdnHCl treatment indefinitely? found from any value ofp
0(the fraction of [psi⫺] colonies),
4. Do [PSI⫹] seeds segregate at random? usingp0⫽e⫺mto findm, the mean number of entities per cell at that time, and multiplying by 2g.
Normally, prion “aggregates” or “fibers” are assayed Sampling whole colonies:Cells for phenotypic analysis were by methods that measure amounts of material, but not plated at a density ofⵑ100 per agar plate and, after 48–72
hr incubation, individual colonies were cut from the plate
infor-TABLE 1
The average number of propagons estimated from the kinetics of GdnHCl-mediated curing curves (see Figure 1) in
various [PSIⴙ] cultures of yeast
Estimated [PSI⫹] strain/isolate propagon no.
Haploids
BSC783/4a, 0a 32
BSC783/4a, 3 128
BSC783/4a, 4 128
BSC783/4a, G0a,b 215
BSC783/4a, 0, 2a 891
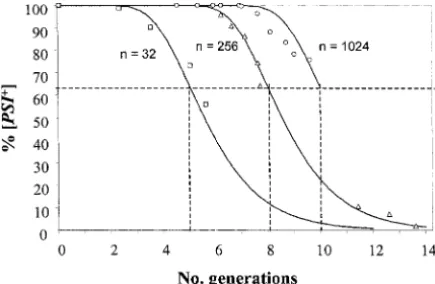
Figure1.—The percentages of [PSI⫹] colonies recovered BSC783/4c 388 by plating cells from independent BSC783/4a cultures grow- 74-D694 (strong) 128 ing logarithmically in YPD⫹ 3 mmGdnHCl, as a function
Diploids of generations of growth. Generations were calculated from
BSC783/4a⫻BSC783/4c, 2n-1 128 hemocytometer counts and from the total numbers of colonies
BSC783/4a⫻BSC783/4c, 2n-2 588 growing on the plates. The cultures were of BSC783/4a [PSI⫹]
previously grown into log phase in liquid YPD and are
exam-The number of propagons was calculated as described by ples taken from several independent experiments (see also
Eaglestoneet al.(2000). Table 1). Theoretical curves are plotted using the expression a
Shown in Figure 1. p0⫽e⫺m, derived from the Poisson expression bShown in Figure 2.
pn⫽
mn·e⫺m
n! , whenn⫽0.
with clonally pure cultures of the BSC783/4a [PSI⫹]
nis the number of propagons in any given cell, p0 is the strain maintained in logarithmic growth in YPD ⫹ 3 fraction of cells giving rise to [psi⫺] colonies (whenn⫽0 in
mmGdnHCl, as a function of numbers of generations.
those cells), andmis the average number of [PSI⫹] propagons
Theoretical curves are plotted using the Poisson
distri-per cell at any given time. Each curve starts at a different
bution for estimating the percentages of [PSI⫹] cells
average number of propagons (N0⫽m) and assumes a halving
of this number at each generation. Perpendiculars have been (seematerials and methods) on the assumption that
drawn from the 63.2% point on each curve. This is the point no generation or destruction of [PSI⫹] propagons takes
at which there is, on average, one propagon per cell, which
place in these conditions and that the average number
allows calculation ofN0, the initial value ofm, from the number
of propagons per cell therefore halves at each
genera-of generations elapsed.
tion. The curves shown were plotted assuming initial average numbers (N0) of propagons of 32, 256, or 1024 with their agar plugs, using a truncated plastic pipette tip. for the different cultures. There is therefore significant
The plug and colony were resuspended in a small volume of clonal variation in the number of [PSI⫹] propagons for
water, vortexed to wash the cells from the plug, and the entire a given [PSI⫹] yeast strain.
suspension was plated on a single plate of YNB medium
lack-To determine whether or not such clonal variation
ing adenine to select for [PSI⫹] Ade⫹cells. In some
experi-was strain specific, we extended this analysis to other
ments, the plugs were suspended in YPD and incubated for
90 min to allow time for an increase in propagons without isolates of BSC783/4a [PSI⫹] and various other haploid
cell division (seeresults) before the cells were challenged and diploid [PSI⫹] strains (Table 1). Most
GdnHCl-on selectiGdnHCl-on medium. Hemocytometer counts showed that treated cultures gave a profile of [psi⫺] segregation that
such colonies contained on average 4–6⫻106cells. The YNB
fell closely along theoretical curves. The data in Table
plates were incubated at 30⬚for 10–14 days and [PSI⫹] colonies
1 further illustrate a lack of consistency of estimated
were distinguished from Ade⫹revertants of nuclear origin by
replica plating the selection plates to1⁄4YE with or without 3 numbers of propagons, even among different cultures mmGdnHCl and incubating for 3 days at 30⬚. Nuclear Ade⫹ of the same strain.
revertants remain white whereas [PSI⫹] colonies turn red on Generation of propagons after release from a guani-the GdnHCl medium (Tuiteet al.1981).
dine hydrochloride block: To determine how quickly
Micromanipulation:Use was made of a Singer MSM System
propagons are multiplied when cells are returned to
from Singer Instruments (Watchet, United Kingdom), to
transfer individual cells and to separate mother and daughter normal YPD medium from YPD⫹GdnHCl medium, a
cells. culture of BSC783/4c [PSI⫹] was transferred during log phase into YPD⫹3 mmGdnHCl medium and samples were taken at various intervals. After seven generations
RESULTS
of growth, part of the culture was transferred to fresh YEPD without GdnHCl and samples were taken from Clonal variation in the numbers of [PSIⴙ] propagons:
Figure 1 shows the decrease in percentage of [PSI⫹] both the culture still in YPD⫹ GdnHCl (G0) and the
Figure3.—The generation of new propagons after removal of guanidine hydrochloride from the culture. The number of propagons was estimated from the curing curves shown in Figure 2B, in BSC783/4a cultures returned to 3 mmGdnHCl medium at intervals after “rescue” to YPD. Estimation was by taking the average of two points on the curing curves to determinem, the mean number of entities per cell at those points and from thatN0, the average number of propagons per cell, at the time of return to GdnHCl medium (see materi-als and methodsand the Figure 1 legend for further details).
age of [PSI⫹] in each culture to estimatem, the mean number of propagons per cell at those points, N0 was Figure2.—(A) The percentages of [PSI⫹] colonies recov- calculated for each culture and, from them, the curve
ered following plating on1⁄4YE from a culture of BSC783/4a
shown in Figure 3 was plotted. The kinetics of the
in-[PSI⫹] growing logarithmically in YPD⫹3 mmGdnHCl. G0 crease in
N0with time was exponential for the first 2 hr is the original culture, R is a portion of the culture “rescued”
with a doubling time ofⵑ20 min, as we have previously
by transfer to YPD without GdnHCl, and G1–G4samples were
reported (Ness et al.2002). TheN0for G0, the parent returned from this culture at various times to YPD⫹3 mm
GdnHCl medium. The times of return of each subculture to culture, and for G4, which spent the longest time in 3 mm GdnHCl from the start of the experiment and the YPD before return to GdnHCl medium, was 215 (7.75 times elapsed between rescue into YPD and return to GdnHCl generations to 63% [PSI⫹]).
medium (hours in parentheses) were: G0, 0 hr,⫻; R, 12.5 hr
An alternative method for estimating the number of
(0), 䊏; G1, 13.25 hr (0.75),䊐; G2, 14 hr (1.5),⌬; G3, 14.75
[PSIⴙ] propagons in a strain:If a cell starts in GdnHCl
hr (2.25),䊊; G4, 15.75 hr (3.25),䉫. (B) Data of A replotted
to normalize all cultures to the time at which they were put medium with n propagons, then after several
genera-into or returned to GdnHCl medium and to 100% [PSI⫹] tions of growth, thenpropagons will be segregated into cells at this time;i.e., the 0% of [psi⫺] colonies in the culture ncells of the population, with the rest having none and at the time of transfer to GdnHCl has been subtracted from
being [psi⫺] (Eaglestoneet al.2000). Thus, if [PSI⫹]
the percentage of [psi⫺] colonies at each time point.
Percent-cells are plated on a GdnHCl-containing medium and
ages have been plotted as a function of generations, which
have been calculated from hemocytometer and colony counts allowed to grow into colonies, every colony should
con-at each sample time. Symbols are the same as those in A. tainncells with a propagon each. Conversely, the [psi⫺] colonies that grow on YPD from single [psi⫺] cells should have no cells containing propagons apart from of R were returned to GdnHCl medium, designated those that may be generated by a spontaneousde novo
G1–G4, and samples were taken for plating as with the conversion event. To test this hypothesis we sampled
other cultures (Figure 2A). The curing curves for all whole colonies taken from YPD⫹GdnHCl plates that five cultures growing in GdnHCl medium were plotted had grown from [PSI⫹] cells and whole colonies grown together with a Poisson curve (Figure 2B), but normal- on YPD from [psi⫺] cells. The results from two otherwise ized to the time at which they were put into or returned isogenic [PSI⫹]/[psi⫺] pairs are presented in Figure 4. to the YPD ⫹ GdnHCl medium and to 100% [PSI⫹] Every colony sampled from the1⁄
4YE⫹GdnHCl plates,
percent-Figure4.—The numbers of [PSI⫹] (solid bars) and nuclear Ade⫹(open bars) revertants recovered from two different [PSI⫹] strains growing in the presence of 3 mmGdnHCl. The nuclear mutation rate was calculated from thep0value. (A) BSC783/4a [PSI⫹] growing on YPD⫹3 mmGdnHCl plates. In the original culture giving rise to these colonies, 9.3% of cells had no bud, 68.3% had one bud, 19.7% had two buds, and 2.7% had three or more buds. [PSI⫹]/colony is an average and the nuclear mutation rate was calculated from thep0value (LeaandCoulson1949). (B) BSC783/4a [psi⫺] colonies taken from YPD plates. The data are pooled from two experiments and both the [psi⫺] and nuclear mutation rates are calculated from thep0values. (C) 74-D694 [PSI⫹] growing on YPD⫹3 mmGdnHCl plates. The nuclear mutation rate was estimated from the median value of numbers recovered from the set of colonies sampled, since there was nop0class. [PSI⫹]/colony is an average. In the culture giving rise to these colonies, 3.1% of cells had no bud, 71.8% had one bud, 0% had two buds, and 25% had three or more buds. There were several large “clumps” of cells characteristic of this strain when grown in liquid YEPD medium. (D) 74-D694 [psi⫺] growing on YEPD. The [PSI⫹] mutation rate was estimated from thep0value and the nuclear mutation rate from the median value of numbers found in the sampled colonies.
colony taken for plating; in fact, in each experiment ation pattern, which is typical of random spontaneous mutation, in both sets of colonies: those from [PSI⫹] there is a small number of “jackpots.” The most
impor-tant observation is that, as predicted, there were no cells plated on1⁄
4YE⫹GdnHCl medium and those from
[psi⫺] cells growing on YPD medium. Approximate mu-colonies from which no [PSI⫹] revertants could be
re-covered. tation rates could be calculated from these fluctuation tests from thep0values or median values. The number
In the colonies started from [psi⫺] cells the numbers
of [PSI⫹] revertants showed the fluctuation typical of of novel mutations recovered from a colony is very sensi-tive to the total number of cells in the colony since most random reversions occurring in growing cultures (Luria
and Delbruck 1943; Lea and Coulson 1949), with mutations occur in the last one or two cell divisions before sampling and colony size could be controlled about one-third of the colonies yielding no [PSI⫹]
fluctu-colonies growing on GdnHCl medium: their numbers represent the numbers of [PSI⫹] propagons in the origi-nal cell or cells from which the colony grew and are independent of colony size (vide infra).
The experiment was repeated using “strong” and “weak” [PSI⫹] variants of the strain 74-D694, which dif-fer in both the extent of the [PSI⫹] nonsense suppres-sion phenotype (Derkatch et al.1997) and the level of soluble Sup35p (Uptain et al. 2001). The results were essentially similar to those obtained with the strain BSC783/4a [PSI⫹] (Figure 4, A and B) and hence the results were pooled (Figure 4, C and D). We also re-peated the control experiment using colonies grown from [psi⫺] cells plated on YPD ⫹ 3 mm GdnHCl. Results were similar, with [PSI⫹] revertants appearing at a rate estimated from thep0value of 5⫻10⫺7. There
were 3 colonies with zero [PSI⫹], 29 with numbers be-tween 1 and 10, 11 bebe-tween 11 and 20, and 2 with jackpots of⬎50.
To confirm that the number of [PSI⫹] colonies was independent of colony size we sampled one set of colo-nies that grew when they had reached a size ofⵑ1000 cells per colony (after 24 hr and 10 generations) and a second set after 72 hr when there were 1–2⫻108cells
per colony (ⵑ26 generations of growth). The first set yielded 141 [PSI⫹] colonies per colony sampled and the second 145 [PSI⫹] per colony sampled.
Our data are consistent with the prediction that [PSI⫹] propagons exist as physical entities that, when their generation is blocked, segregate eventually into a few cells in the culture (Eaglestone et al. 2000). Furthermore, the conversion of the [PSI⫹] cells into
Figure5.—The timing of generation of new propagons.
[psi⫺] during growth in GdnHCl is not due to the de- The numbers of [PSI⫹] cells found in colonies grown from struction of propagons. In both strains examined here, cells at various stages of the cell cycle isolated by micromanipu-no or very few [PSI⫹] cells were recovered from [psi⫺] lator from a 74-D694 [PSI⫹] (strong) culture and placed on 1⁄4YE ⫹3 mmGdnHCl medium are shown. Unbudded cells
colonies growing on YPD, and in both strains generally
are designated G1, small-budded cells S, and large-budded
between 20 and 100 [PSI⫹] cells were recovered from
cells G2. Three-cell clusters have a very small bud on one of
colonies grown from [PSI⫹] cells plated onto 3 mm the large cells of a “dumbbell.” GdnHCl-containing medium; among these, no colonies
were found without any [PSI⫹] cells.
The average number of [PSI⫹] propagons found by
our alternative method is less than that normally esti- an inoculum containing some multiple of the average number of propagons per cell, and this would be the mated by the kinetics of the “curing” experiment. This
discrepancy is probably due to a ⬍100% recovery of number of [PSI⫹] colonies recovered from it at the end of the period of growth.
every potential Ade⫹[PSI⫹] cell from each colony. With
only one propagon in the cell, the diagnostic suppressor The timing of generation of [PSIⴙ] propagons: In-stead of sampling random colonies, colonies were grown phenotype of the [PSI⫹] cell may appear only after
considerable delay. In subsequent experiments, de- from individual cells isolated using a micromanipulator. From a log-phase culture of 74-D694-[PSI⫹] (strong) scribed below, a preincubation was carried out.
The non-Gaussian distributions with a very high vari- growing in YPD at a titer of 5 ⫻ 106/ml, cells were
chosen that were: (1) unbudded,i.e., G1phase; (2) with
ance observed in numbers of [PSI⫹] cells recovered
from different colonies may be due to the considerable a very small bud,i.e., S phase; (3) with a large bud,i.e., G2phase; or (4) three-cell clusters with the mother cell
degree of variation in the size of colony-forming units,
particularly in the 74-D694 strains (Figure 4). This carrying a very small bud and the daughter cell as yet unbudded,i.e., S⫹G1phases. Approximately 40 of each
would have the effect that different colonies would arise
from different numbers of cells: one, two, three, or type of cell were taken from a log-phase culture freshly placed on1⁄
4YE medium containing 3 mmGdnHCl. Each
TABLE 2
The average numbers of [PSIⴙ] colonies recovered from single unbudded cells sampled at intervals from a log-phase culture
of 74-D694 [PSIⴙ] after the addition of 3 mmGdnHCl
Hours after Range of nos. addition No. of cells of [PSI⫹] cells
of GdnHCl sampled in each colony Average
0 18 30–228 114.3
2 20 31–184 62.7
4 7 8–93 35.6
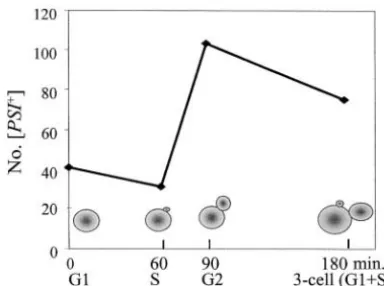
The single-cell isolates were sampled by micromanipulation from the surface of YPD⫹3 mmGdnHCl plates and grown Figure6.—The generation of new propagons occurs mainly
into colonies as described in the text. in S phase of the cell cycle. The average numbers of [PSI⫹]
cells found in colonies derived from various cell types isolated by micromanipulation from [PSI⫹] cultures and placed on 1⁄4YE ⫹ 3 mm GdnHCl medium are shown. These data are
in YPD⫹3 mmGdnHCl medium, choosing samples of
taken from the experiment shown in Figure 5. The averages unbudded cells from the culture at the time of addition are plotted against an idealized cell cycle arbitrarily assigning
of GdnHCl and intervals of approximately one
genera-a cycle time of 2 hr (PringleandHartwell1981).
tion thereafter. The cells were picked onto fresh1⁄ 4YE⫹
3 mmGdnHCl. Throughout the experiment cell num-ber was determined using a hemocytometer and the effectiveness of the medium in curing [PSI⫹] was con-set of 40 cells could be picked within 20 min: no
signifi-firmed by plating out cells from the culture onto1⁄ 4YE
cant changes in cell morphology took place during this
after 10 generations of growth. If the “inhibition of time.
generation” hypothesis is correct, at each generation The numbers of [PSI⫹] cells recovered from the
colo-the average number of propagons per cell would be nies grown from G1- or S-phase cells form a distribution
halved. The results (Table 2) showed an exponential about means of 40.8 and 31.3, respectively (Figure 5).
decline in numbers of [PSI⫹] cells found in successive The G2 cells and three-cell clusters gave colonies with
samples of the culture, which extrapolates back to the mean numbers of [PSI⫹] cells of 103.2 and 75.0,
respec-origin. The halving time for the decline wasⵑ2.5 hr, tively. However, clearly a great deal of variation in
num-slightly slower than the rate at which the cell numbers bers was found in these colonies, with a few yielding
doubled in the culture that was measured at 2.2 hr. high numbers: for example, one yielded 880 [PSI⫹]
The randomness of propagon segregation between colonies and three yielded⬎200. In calculating these
mother and daughter: Eaglestone et al. (2000) pro-means the colonies yielding such clear “jackpot” events
posed that propagons distribute randomly between were disregarded. The three-cell clusters used were
con-mother and daughter cell during cytokinesis. We set sidered to be pairs of G1- and S-phase cells and the sum
out to validate this experimentally in two ways. First, of the means of the latter distributions,i.e., 72.1 (40.8⫹
in the course of the experiment described above, in 31.3), is similar to the mean of the former,i.e., 75.0.
addition to sampling unbudded cells, three-cell clusters We take this as a validation of this method of estimating
were taken and the mother (small-budded) and daugh-propagon numbers, with the reservation that some
ex-ter (unbudded) separated on 1⁄
4YE ⫹ 3 mm GdnHCl
planation must be found for the jackpots.
medium. If GdnHCl does inhibit propagon generation, The increase in propagon numbers (and possibly in
then any differences between mothers and daughters variance) was confined to the stage between small-bud
should reflect a segregation bias. Cells were taken from formation (initiation) and growth into a large bud. This
cultures after 4 and 6 hr in GdnHCl and the resulting coincides with the S phase of the cell cycle with this
colonies were assayed for the presence of [PSI⫹] cells phase lasting forⵑ25% of the cell cycle (Pringleand
(Figure 7A). The data are consistent with there being Hartwell 1981). No further apparent increase
oc-a bioc-as towoc-ard propoc-agons remoc-aining in the mother cell, curred after this while M and G2 (also ⵑ25% of the
with a daughter:mother ratio of 1:2 being observed after cycle) were taking place or during G1since the numbers
both 4- and 6-hr incubation in GdnHCl. of propagons recovered from large-bud cells and
three-Biased propagon segregation was also found in a cell clusters were about the same (Figure 6).
[PSI⫹] culture growing in YPD (Figure 7B) as defined Inhibition of [PSIⴙ] propagon generation by
guani-using the same experimental strategy described above. dine hydrochloride: The inhibition of generation of
Not all mother-daughter pairs showed the bias (and in propagons is an inference drawn from the kinetics of
one case it was reversed) although the bias could be curing during growth in GdnHCl. We tested this by
ters, and some propagon generation might indeed oc-cur after the cells are exposed to GdnHCl.
In a second approach cells were taken from [PSI⫹] cultures growing in YPD⫹GdnHCl medium at a stage when, after several generations there should be, on aver-age, only one or two propagons per cell. The overall fraction of [psi⫺] cells in the cultures was determined and at the same time, suspensions of these cultures were transferred to fresh1⁄
4YE medium and cells
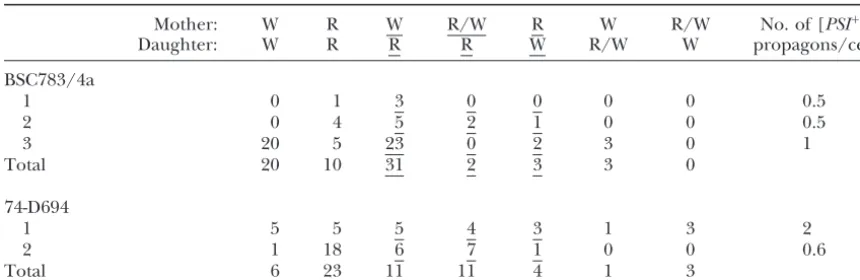
micromani-pulated to marked positions on the agar surface. In the first experiment (BSC783/4a; nos. 1 and 2 in Table 3) large-budded cells were separated with the larger of each pair being identified as the mother. In subsequent experiments, three-cell clusters were taken to separate, identifying the budded member of each pair as the mother since mother cells reach the size required for bud initiation before their daughters (Pringle and Hartwell1981). When [PSI⫹] cells have been growing in GdnHCl for 14–18 hr and have undergone several generations of division, there is a strong bias in propa-gon segregation with the propapropa-gons remaining with the mother cell inⵑ90% of the cases (Table 3).
DISCUSSION
Counting yeast propagons: Current data are consis-tent with the propagation of the [PSI⫹] prion determi-nant in yeast involving a number of replicating “seeds” that are transmitted through the cytoplasm to daughter cells at cytokinesis. We have termed these seeding ele-ments propagons and they are most likely composed of aggregates of nonnative conformers of the Sup35p
Figure7.—Evidence for a mother bias in transmission of protein.Eaglestoneet al. (2000) estimated the number [PSI⫹] propagons in GdnHCl-grown cells. (A) A scatter plot
of propagons to beⵑ60 per cell, a figure derived from
of the numbers of [PSI⫹] cells found in colonies growing
a simple mathematical model based on the ability of
on 1⁄4YE ⫹ 3 mm GdnHCl. The colonies were grown from
GdnHCl to block propagon generationin vivo. Here we
micromanipulated individual three-cell clusters taken from a
logarithmic culture of 74-D694 [PSI⫹] (strong) growing in show that the numbers of [PSI⫹] propagons per cell
YPD⫹3 mmGdnHCl liquid medium. The clusters were sepa- for a given yeast strain can apparently vary from one rated into “mother” (budded) and “daughter” (unbudded)
culture to another with values, calculated by our
segrega-cells. Clusters were sampled at 4 (䉬) or 6 (䊊) hr after addition
tion model, of between 30 and 1000. Both haploid and
of GdnHCl to the growing culture. The number of [PSI⫹]
diploid strains fall into this range.
cells in each mother colony is plotted against the number in
the corresponding daughter colony. (B) As in A except the Inhibition of propagon replication by guanidine
hy-three-cell clusters were taken from a culture of 74-D694 [PSI⫹] drochloride:The numbers of propagons in cells grow-(strong) grown in YPD. Note that on both plots, a line with ing in 3 mmGdnHCl halved every 2.5 hr from the time a slope of 1 has been drawn,i.e., 50:50 mother:daughter
distri-of addition distri-of the GdnHCl. This was slightly slower than
bution.
the doubling time of the culture (ⵑ2.2 hr) and raises the possibility that generation of propagons is not com-pletely inhibited by growth in GdnHCl. This would af-fect our method of estimating propagon numbers, since place in the mother cell, but not in the daughter. In
the strain 74-D694, cytokinesis is delayed until a bud is it would prolong the apparent “lag” observed before [psi⫺] cells segregate. However, once [psi⫺] cells start well established on the mother cell (data not shown),
meaning that mothers and daughters cannot be physi- segregating,i.e., when the numbers of propagons in cells are very low, the numbers do halve at each generation, cally separated at an early stage of cell division. The
artifact would be exacerbated if GdnHCl did not have because their appearance follows the appropriate halv-ing kinetic. GdnHCl must therefore take its effect imme-an immediate inhibitory effect on propagon generation.
daugh-TABLE 3
The phenotypes of colonies derived from mother and daughter cells growing on1⁄
4YE after several
generations of growth in YPD⫹3 mmGdnHCl medium
Mother: W R W R/W R W R/W No. of [PSI⫹]
Daughter: W R R R W R/W W propagons/cell
BSC783/4a
1 0 1 3 0 0 0 0 0.5
2 0 4 5 2 1 0 0 0.5
3 20 5 23 0 2 3 0 1
Total 20 10 31 2 3 3 0
74-D694
1 5 5 5 4 3 1 3 2
2 1 18 6 7 1 0 0 0.6
Total 6 23 11 11 4 1 3
W, [PSI⫹]; R, [psi⫺]. Columns showing mother:daughter pairs where segregation of [PSI⫹] and [psi⫺] occurred are underlined. Columns 5 and 6 are where [PSI⫹] propagons have remained in the mother, and column 7 is where they have segregated to the daughter. The final column shows the number of propagons per cell estimated from the frequency of [psi⫺] colonies found in each sample.
Nonrandom segregation of propagons:Our data are gate into n cells during growth in the presence of GdnHCl is supported by the recovery of the expected mostly consistent with the random segregation model
ofEaglestoneet al.(2000). However, direct assays of numbers of [PSI⫹] cells from colonies after sufficient growth. These data are also consistent with our previous the segregation of propagons into mother and daughter
cells showed a consistent bias toward retention of propa- assertion that propagons are not destroyed to any sig-nificant extent in the presence of 3 mmGdnHCl (Ness gons in the mother cell both when there were large
numbers of propagons in the cells, i.e., in the early et al.2002). The ranges of numbers of propagons found in populations of cells, by estimations from the kinetics stages of curing, and when there were only one or two
propagons per cell and [psi⫺] cells were segregating at of GdnHCl-induced curing, are matched by the ranges of numbers found in individual cells and colony-forming high frequency. This has important implications for
both the kinetics of curing and our understanding of units (CFUs).
Propagon number and stable prion propagation:Our the propagation of the [PSI⫹] prion determinant (Cole
2003). findings have important implications for understanding
the nature of the prion phenomenon in yeast. Our data The bias toward retention of propagons in the mother
cell was particularly strong when the numbers of propa- suggest that the numbers of [PSI⫹] propagons, defined as those versions of the prion protein—be they mono-gons in the cells were predicted to be low (Table 3).
Although GdnHCl inhibits propagon generation, it meric or multimeric—which replicate or increase in number as opposed to size—are very low. The number does not inhibit the accretion of newly synthesized
Sup35p to aggregates with the rate of accretion being of Sup35p molecules in a cell is of the order of 104,
based on the number of Sup35p molecules relative to proportional to the numbers of propagons (Nesset al.
2002). Therefore, in the presence of GdnHCl, the Sup35p the more abundant ribosomal proteins (1:10; Didi-chenkoet al. 1991). If prion formation were merely an aggregates might become very large and would be
diffi-cult to transmit to a daughter cell. Indeed, using a autocatalyzed cycle of template aggregation and dissoci-ation, this would rapidly and (exponentially) generate Sup35pNM-GFP fusion,Wegrzynet al.(2001) observed
an apparent increase in the size of prion aggregates in comparable numbers of propagons, which would be too high a number to be consistent with our observations. the presence of GdnHCl. If such aggregates are formed
on (or by) propagons and physically include them, then One possible scenario is that a propagon is an aggre-gate of prions. In one model, there are two processes: an increasing bias in segregation might develop as
growth in GdnHCl continued. This would have an effect generation and accretion. The latter would perhaps re-quire the ends of amyloid fibers formed by aggregation on the estimates of propagon numbers we make by
either method of analysis, leading to an earlier appear- and the former would consist of splitting the aggregates to form more ends and would be the process inhibited ance of [psi⫺] cells in the culture and also preventing
complete segregation of all propagons initially present by GdnHCl (Wegrzynet al.2001;Nesset al.2002). This would be an exponential process and ultimately predicts in a cell into separate cells by the end of colony growth.
it is exactly balanced by the exponential increase in cell were not so consistently observed when the experiments numbers during log phase. were done with the strain BSC783/4a (B. S. Coxand
The key to the mitotic (and possibly meiotic) stability F.Ness, unpublished data).
of the [PSI⫹] determinant must lie in how the genera- The occasional occurrence of cultures with very high tion of propagons and of cells is coordinated. We pro- numbers of propagons (500–3000 per cell) remains un-vide eun-vidence here that one component of such an explained and our studies do not provide a rational integrated system might be the restriction of prion gen- explanation to account for them. The observation may eration to S phase in growing cells. Another comes from have a genetic basis, but sometimes the exceptional the observation that, apparently, the doubling time of numbers occur in strains isogenic with cultures that propagon generation is ⵑ20 min (Nesset al.2002), a seem to be in the 50–100 range for propagon numbers. time that allows for a threefold increase during S phase. There may be preculture conditions, such as long stor-In fact, the observed S-phase increase in a normal cell age in stationary phase, that affect the average number culture was a doubling, together with an increase in of propagons in a culture, but this is a question that variance:i.e., a number of G2cells apparently had very remains to be addressed.
high numbers of propagons. It could be that the rate This work was supported by project grants to M.F.T. from The of generation is negatively correlated with the numbers Wellcome Trust and the Biotechnology and Biological Science Re-of propagons present in S-phase cells. search Council. The Wellcome Trust is further acknowledged for providing funding to allow B.S.C. to return to the bench after his
The third important observation is the bias toward
official retirement.
propagons remaining in mother cells. If this affected all cell divisions, then a population would rapidly accu-mulate a number of cells with such low numbers of
propagons that they would frequently segregate [psi⫺] LITERATURE CITED cells. The bias may reflect the difference in size between
Cole, D., 2003 Stochastic branching processes in biology. Ph.D.
the mother and daughter cells at the point of cell separa- Thesis, University of Kent, Canterbury, UK.
Cox, B. S., 1993 Psi phenomena in yeast, pp. 219–232 inThe Early
tion. The volume ratio of mother to daughter cells at
Years of Yeast Genetics, edited by M. N.Halland P.Linder. Cold
the time of cytokinesis is generallyⵑ3:1, but can vary
Spring Harbor Laboratory Press, Cold Spring Harbor, NY.
between 1:1 and 4:1; usually it is greater than the propa- De Pace, A. H., A. Santoso, P. HillnerandJ. S. Weissman, 1998 gon number ratio of 2:1. It is clearly difficult to say A critical role for amino-terminal glutamine/asparagine repeats in the formation and propagation of yeast prion. Cell93:1241–
whether partition is a passive process, but the great
1252.
stability of [PSI⫹] suggests an active partition or replica- Derkatch, I. L., M. Bradley, P. Zhou, Y. O. ChernoffandS. W. tion mechanism that prevents the numbers from falling Liebman, 1997 Genetic and environmental factors affecting the
de novoappearance of the [PSI⫹] prion inSaccharomyces cerevisiae.
too low.
Genetics147:507–519.
Strain-independent variation in propagon numbers: Didichenko, S. A., M. D. Ter-AvanesyanandV. N. Smirnov, 1991 Our prediction about the distribution of [PSI⫹] propa- Ribosome-bound EF-1 alpha-like protein of yeastSaccharomyces
cerevisiae.Eur. J. Biochem.15:705–711.
gons in a growing culture may account for many of our
Doel, S. M., S. J. McCready, C. R. NierrasandB. S. Cox, 1994
observations. For example, the uniformity of distribu- The dominant PNM2 mutation which eliminates thefactor of tion of numbers of propagons in G1- and S-phase cells, Saccharomyces cerevisiaeis the result of a missense mutation in the
SUP35gene. Genetics137:659–670.
compared with the high variance found in G2and
three-Eaglestone, S., L. W.Ruddock, B. S.Coxand M. F.Tuite, 2000
cell clusters, may reflect the fact that all single cells Guanidine hydrochloride blocks a critical step in the propagation or small-budded cells picked from cultures are most of the prion-like determinant [PSI⫹] ofSaccharomyces cerevisiae.
Proc. Natl. Acad. Sci. USA97:240–244.
probably daughters whereas large-budded cells and
Ferreira, P. C., F. Ness, S. R. Edwards, B. S. CoxandM. F. Tuite,
three-cell clusters may be found with cells of any age. 2001 The elimination of the [
PSI⫹] prion by guanidine
hydro-In any sample of the latter types, one or two old mothers chloride is the result of Hsp104 inactivation. Mol. Microbiol.40:
1357–1369.
are likely to have accumulated large numbers of
propa-Jung, G., andD. C. Masison, 2001 Guanidine hydrochloride inhibits
gons. Old mothers may therefore be the source of the
Hsp104 activity in vivo: a possible explanation for its effect in
propagon jackpots we have observed. curing yeast prions. Curr. Microbiol.43:7–10.
The source of the variation in propagon numbers Kaiser, C., S. MichaelisandA. Mitchell, 1994 Methods in Yeast Genetics. Cold Spring Harbor Laboratory Press, Cold Spring
Har-between cultures is intriguing. The kinetics of curing
bor, NY.
observed during growth in GdnHCl is determined by Lea, D. E., andC. A. Coulson, 1949 The distribution of the numbers the average number of propagons in CFUs. This is likely of mutants in bacterial populations. J. Genet.49:264–285.
Liu, J.-J., andS. Lindquist, 1999 Oligopeptide repeat expansions
to be the numbers in daughter cells and young mothers
modulate ‘protein-only’ inheritance in yeast. Nature400:573–
that together comprise up to 80% of growing popula- 576.
tions. We have suggested that this number is likely to Luria, S. E., andM. Delbruck, 1943 Mutations of bacteria from virus sensitivity to virus resistance. Genetics28:491–511.
beⵑ60 and, allowing for an average CFU of 2.5 cells,
Ness, F., P. Ferreira, B. S. CoxandM. F. Tuite, 2002 Guanidine
this should consistently give numbers of ⵑ120–150.
hydrochloride inhibits the generation of prion seeds but not
These are the numbers we have observed in the strain prion protein aggregation in yeast. Mol. Cell. Biol.22:5593–5605.
Parham, S. N., C. G. ResendeandM. F. Tuite, 2001 Oligopeptide
repeats in the yeast protein Sup35p stabilize intermolecular prion tion of conformational information by a prion determinant. Sci-ence289:1317–1321.
interactions. EMBO J.20:2111–2119.
Ter-Avanesyan, M. D., V. V. Kushnirov, A. R. Dagkesamanskaya, Patino, M. M., J.-J. Liu, J. R. GloverandS. Lindquist, 1996
Sup-S. A. Didichenko, Y. O. Chernoffet al., 1993 Deletion analysis port for the prion hypothesis for the inheritance of a phenotypic
of theSUP35gene of the yeastSaccharomyces cerevisiaereveals two trait in yeast. Science273:622–626.
non-overlapping functional regions in the encoded protein. Mol. Paushkin, S. V., V. V. Kushnirov, V. N. SmirnovandM. D. Ter
-Microbiol.7:683–692. Avanesyan, 1996 Propagation of the yeast prion-like [psi⫹]
Tuite, M. F., C. R. MundyandB. S. Cox, 1981 Agents that cause determinant is mediated by oligomerization of the
SUP35-a high frequency of genetic chSUP35-ange from [psi⫹] to [psi⫺] in encoded polypeptide chain release factor. EMBO J.15:3127–
Saccharomyces cerevisiae.Genetics98:691–711. 3134.
Uptain, S. M., G. J.Sawicki, B.Caugheyand S.Lindquist,2001 Paushkin, S. V., V. V. Kushnirov, V. N. SmirnovandM. D. Ter
-Strains of [PSI⫹] are distinguished by their efficiencies of prion-Avenasyan, 1997 In vitro propagation of the prion-like state
mediated conformational conversion. EMBO J.20:6236–6245. of yeast Sup35 protein. Science277:381–383.
Wegrzyn, R. D., K. Bapat, G. P. Newnam, A. D. ZinkandY. O. Pringle, J. R., andL. Hartwell, 1981 TheSaccharomyces cerevisiae
Chernoff, 2001 Mechanism of prion loss after Hsp104 inactiv-cell cycle, pp. 97–139 inThe Molecular Biology of the Yeast
Saccharo-tion in yeast. Mol. Cell. Biol.21:4656–4699.
myces, edited by J. N.Strathern, E. W.Jonesand J. M.Broach.
Wickner, R. B., 1994 [URE3] as an altered Ure2 protein: evidence Cold Spring Harbor Laboratory Press, Cold Spring Harbor, NY.
for a prion analog inSaccharomyces cerevisiae.Science264:566–569. Prusiner, S. B., M. R. Scott, S. J. ArmandandF. E. Cohen, 1998
Wickner, R. B., andY. O. Chernoff, 1999 Prions of fungi: [URE3], Prion protein biology. Cell93:337–348. [PSI ] and [Het-s] discovered as heritable traits, pp. 229–272 in Serio, T. R., andS. L. Lindquist, 1999 [PSI⫹]: an epigenetic modu- Prion Biology and Diseases, edited by S. B.Prusiner. Cold Spring
lator of translation termination efficiency. Annu. Rev. Cell Dev. Harbor Laboratory Press, Cold Spring Harbor, NY.
Biol.15:661–703. Young, C. S. H., and B. S.Cox, 1971 Extrachromosomal elements Serio, T. R., andS. L. Lindquist, 2000 Protein-only inheritance in in a super-suppression system of yeast. I. A nuclear gene control-yeast: something to get [PSI⫹]-ched about. Trends Cell Biol.10: ling the inheritance of the extrachromosomal elements. Heredity
98–105. 26:413–422.
Serio, T. R., A. G. Cashikar, A. S. Kowal, G. J. Sawicki, J. J. Mosleshi