ISSN(Online) : 2319-8753 ISSN (Print) : 2347-6710
I
nternational
J
ournal of
I
nnovative
R
esearch in
S
cience,
E
ngineering and
T
echnology
(An ISO 3297: 2007 Certified Organization)
Website: www.ijirset.com
Vol. 6, Issue 4, April 2017
Classification of Brain MR Images using
Texture Feature Extraction
Amulya E R1, Soumya Varma2, Dr Vince Paul 3
M. Tech. Student, Department of Computer Science & Engineering, Sahrdaya College of Engineering , Kerala, India1
Assistant Professor, Department of Computer Science & Engineering, Sahrdaya College of Engineering , Kerala, India2
Associate Professor, Department of Computer Science & Engineering, Sahrdaya College of Engineering, Kerala, India3
ABSTRACT: Alzheimer’s disease (AD), is a degenerative disease which leads to memory loss and problems with thinking and behaviour.AD is a type of dementia which accounts for an estimated 60% to 80% of cases. Accurate diagnosis depends on the identification of discriminative features of AD. Recently, different feature extraction methods are used for the classification of AD. In this paper, we proposed a classification framework to select features, which are extracted using Gray-Level Co-occurrence Matrix (GLCM) method to distinguish between the AD and the Normal Control (NC). In order to evaluate the proposed method, we have performed evaluations on the MRI acquiring from the OASIS database. The proposed method yields an average testing accuracy of 75.71% which indicates that the proposed method can differentiate AD and NC satisfactorily.
KEYWORDS: Alzheimer’s Disease classification, featureextraction, GLCM
I. INTRODUCTION
Alzheimer’s disease (AD) progresses to deteriorate the capability to think and memorize events, names etc. There are different category of dementia. AD is one of such categories [1]. The initial indications of AD are forgetting the names, events, communications etc. Later it progresses to perplexity, poor perception and lack of reasoning. The early clinical symptoms for AD are difficulty in remembering recent conversations, events and names. AD was identified more than 100 years ago. But the research on treatment, symptoms and risk factors have gained momentum by last 30 years. The precise biologic changes that cause AD, its progression among different age groups and prevention are yet to be discovered. Diagnosis of AD includes evaluation of mental status, physical exam and neurological exam. Study of brain imaging is a form of neurological exams. Magnetic Resonance Imaging (MRI), Positron Emission Tomography (PET), Single-Photon Emission Computed Tomography (SPECT), Computed Tomography (CT) are some of the brain imaging methods. AD affects the cerebral cortex region and sub-cortical region. The deprivation of neurons and synapse in these areas is the main characteristic of AD. So there will be considerable atrophy of affected regions which includes the degeneration of temporal lobe and parietal lobe. The degree of atrophy in posterior part of cerebral cortex is visualized using different imaging techniques and it is used to differentiate between Normal Control (NC) and AD. MRI is one of the important neuroimaging techniques as it is used to analyze the changes in volume and structure of brain.
Fig.1 General Framework for the classification of AD/NC
The proposed algorithm is that the MR image is preprocessed using Contrast Limited Adaptive Histogram Equalization (CLAHE).Then texture features are extracted using Gray-Level Co-occurrence Matrix (GLCM) method and classification is done using Support Vector Machine (SVM). The block diagram of proposed work is as shown in Fig 2.
Fig.2 Proposed Workflow for the classification
ISSN(Online) : 2319-8753 ISSN (Print) : 2347-6710
I
nternational
J
ournal of
I
nnovative
R
esearch in
S
cience,
E
ngineering and
T
echnology
(An ISO 3297: 2007 Certified Organization)
Website: www.ijirset.com
Vol. 6, Issue 4, April 2017
II. RELATEDWORK
There are several methods adopted for preprocessing of MR Images. The main aim of this is to get error removed and get a clear MR Image. Histogram equalization (HE) is one of the method for contrast enhancement. HE changes the distribution of gray scale values in an image and makes it uniform [2], [3]. In Contrast Limited Adaptive histogram equalization (CLAHE) contrast limiting is done to prevent over amplification of noise [4]. There are several texture feature extraction methods are used for the classification of MR Images. Grey-Level Co-occurrence Matrix (GLCM) is one of such methods. It is a statistical texture extraction method and uses the spatial relationship of pixels [5]. Support Vector Machines (SVM) is a well-known classification method which is originally formulated for binary classification and later it is used for multi-classification by combining different binary classifiers. The main advantages of SVM are it works optimally and less sensitive to dimensionality of the problem in computational cost [6].
III.PROPOSEDMETHODOLOGY
The proposed work has the following steps:
1) A training set of Alzheimer’s Disease (AD) Brain MR Images and Normal Control (NC) brain MR Images are selected and preprocessed with contrast limited adaptive histogram equalization (CLAHE) method
2) Texture features are extracted using Gray Level Co- Occurrence Matrix (GLCM) for those set of images are given as input.
3) These features along with labels (AD or NC) are used to build the model.
4) A set of Test images are given as input for classification. These images are preprocessed using CLAHE and texture features are extracted using GLCM.
5) These images are classified to AD or NC according to the model that is built by the training set.
A. Preprocessing
Preprocessing is the process of MR image enhancement. The main aim of preprocessing is to get error removed and enhancing brain MR image. In the proposed algorithm, contrast limited adaptive histogram equalization (CLAHE) method has used. Contrast enhancement methods are not used to increase structural information of an image. But rather to boost image contrast therefore improve particular characteristics. CLAHE is an adaptive contrast enhancement method. This method is based on adaptive histogram equalization (AHE) where the histogram is determined for the contextual region of a pixel. Then the intensity value of pixel is converted to a value within the display range which is proportional to the pixel intensity rank in the local intensity histogram [7].
B. Feature Extraction
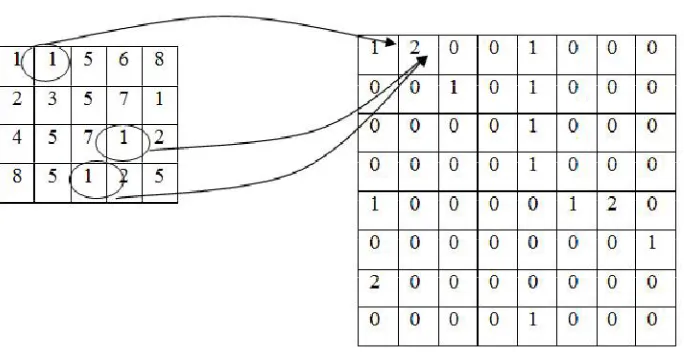
Fig. 3. Calculating Gray level matrix from an image
Contrast
It gives the value of the intensity contrast between a pixel and its neighbour over the image. For a constant image contrast is 0.
Formula:
Correlation
It gives the measure of how a pixel is correlated to its neighbour over the image .the range of correlation is [-1,1]. Correlation is 1 or -1 for a perfectly positively or negatively correlated image.
Formula:
Energy
It returns the sum of squared elements in the GLCM. The range of energy is [0,1].For constant image energy is 1. Formula
Homogeneity
It returns the value of closeness of the distribution of elements in the GLCM to the GLCM diagonal. Formula
ISSN(Online) : 2319-8753 ISSN (Print) : 2347-6710
I
nternational
J
ournal of
I
nnovative
R
esearch in
S
cience,
E
ngineering and
T
echnology
(An ISO 3297: 2007 Certified Organization)
Website: www.ijirset.com
Vol. 6, Issue 4, April 2017
methods to detect AD, using data obtained from Magnetic Resonance Imaging (MRI). A Support Vector Machine (SVM) classifier was used for AD classification by [12], [13].
IV.EXPERIMENTAL RESULTS
A. Datasets
The dataset used in this work is Open Access Series of Imaging Studies (OASIS) [14].In this study, we have used brain MR images of 135 normal persons and 100 AD patients. Whole brain T1-weighted 3D MPRAGE (Magnetization-prepared Rapid acquisition Gradient Echo) data set were acquired using Siemens 1.5-T Vision scanner in a single imaging session. We have used three views (axial, sagittal and coronal) for testing the proposed method.
B. Performance Metrics
Leave-one-out strategy is used for classification of dataset. This strategy is to leave aside one set of subjects to train the classification model with the remaining ones and finally to use the one set aside to test the trained model. After testing the images, the number of true positives ((TP, AD patients correctly classified), True Negative (TN, NC correctly classified), False Positive (FP, NC misclassified), and False Negative (FN, AD patients misclassified) were calculated. The performance of classification is validated using the following metrics:
Accuracy: (TP + TN)/(TP + TN + FP + FN) Precision: TP/(TP + FP)
Sensitivity: TP/(TP + FN) Specificity: TN/(FP + TN)
Balanced Accuracy (BAC): (Sensitivity + Specificity)/2 F-measure (F1): (2*TP)/(2*TP + FP + FN)
C. Experimental Setup
The complete proposed workflow has been implemented using the Scientific Python Development EnviRonment called SPYDER.It is a powerful interactive development environment for python language with advanced editing, interactive testing, debugging and introspection features. The implementation is done using OpenCV-Python which is the python API for OpenCV. OpenCV-Python is a library of Python bindings designed to solve computer vision problems.
D. Results
The complete OASIS data set consists of 235 samples (NC=135, AD=100). For training 70% from samples are chosen and for testing 30% samples are chosen (Training Set: AD=70, NC=95, Test Set: AD=30, NC=40).
Fig.4. Performance Analysis
V. CONCLUSION
In this paper, a classification plan for classifying individuals with Alzheimer’s Disease (AD) and Normal Control (NC) by GLCM method is presented. Evaluation of proposed method has been done on OASIS dataset and it demonstrates the effectiveness of the proposed work in improving classification results. As future enhancements, more datasets needs to be collected and tested. There are other methods for texture feature extraction like Gabor filters, Local Binary Patterns etc. which can be used for future analysis for AD/NC classification.
REFERENCES
[1] Alzheimer’s association, “Basics of Alzheimer’s Disease”, [Online]. Available:
www.alz.org/national/documents/brochure_basicsofalz_low.pdf. [Accessed: Nov. 15, 2016], Oct 2016.
[2] Kim, T. and J. Paik, “Adaptive Contrast Enhancement Using Gain-Controllable Clipped Histogram Equalization”, IEEE Trans. Consumer
Electr., DOI: 10.1109/ TCE.2008.4711238, pp: 1803-1810, 2008.
[3] Sengee, N. and H. Choi, “Brightness Preserving Weight Clustering Histogram Equalization”, IEEE Trans. Consumer Electr., DOI: 10.1109/
TCE.2008.4637624, pp: 1329-1337 , 2008 .
[4] Pizer, S.M., Amburn, E.P., Austin, J.D., Cromartie, R., Geselowitz, A., Greer, T., terHaarRomeny, B., Zimmerman, J.B. and Zuiderveld, K.,
“Adaptive histogram equalization and its variations”. Computer vision, graphics, and image processing, 39(3), pp.355-36, Sep. 1987.
[5] D A. Clausi, “An analysis of co-occurrence texture statistics as a function of grey level Quantization”, Can. J. Remote Sensing, Vol. 28, No. 1,
pp 45-62. 2002.
[6] S.S. Keerthi, C.J. Lin, “Asymptotic behaviour of Support Vector Machines with Gaussian Kernel”, Neural Computation 15(7), 1667-1689,
2003.
[7] E. D. Pisano, S. Zong, B. M. Hemminger, M. DeLuca, R.E. Johnston, K. Muller, M. P. Braeuning and S. M. Pizer, “Contrast Limited
Adaptive Histogram Equalization Image Processing to Improve the Detection of Simulated Spiculations in Dense Mammograms,” Journal of Digit Imaging , Vol. 11, No. 4, pp. 193-200,1998.
[8] R.M. Haralick, K. Shanmugam, I. Dinstein, “Textural Features for Image Classification”,IEEE Transactions on Systems, Man, and
Cybernetics, Vol. 3, No. 6, pp 610–621,1973.
[9] Bino Sebastian V, A. Unnikrishnan and Kannan Balakrishnan, “Grey Level Co-occurrence Matrices: Generalization and Some New Features”,
Accuracy Precision Sensitivity Specificity Balanced
Accuracy F1
Coronal 74.28 62.5 100 55 77.5 76.9
Sagittal 75.71 63.82 100 57.5 78.75 77.92
Axial 77.14 65.21 100 60 80 78.94
77.14 65.21 100 60 80 78.94
75.71 63.82 100 57.5 78.75 77.92 74.28 62.5 100 55 77.5 76.9 0 50 100 150 200 250 300 350
CLASSIFICATION PERFORMANCE
ISSN(Online) : 2319-8753 ISSN (Print) : 2347-6710
I
nternational
J
ournal of
I
nnovative
R
esearch in
S
cience,
E
ngineering and
T
echnology
(An ISO 3297: 2007 Certified Organization)
Website: www.ijirset.com
Vol. 6, Issue 4, April 2017
[11] F. I. Alam, R. U. Faruqui,“Optimized Calculations of Haralick Texture Features”, European Journal of Scientific Research, Vol. 50 No. 4, pp
543-553, 2011.
[12] C. Davatzikos, Y. Fan, X. Wu, D. Shen, and S. M. Resnick, “Detection of prodromal Alzheimer’s disease via pattern classification of MRI,”
Neurobiology of Aging, vol. 29, pp. 514–523, 2008.
[13] J. Zhang, B. Yan, X. Huang, P. Yang, and C. Huang, “The diagnosis of Alzheimer’s disease based on voxel-based morphometry and support
vector machine” ,Proceedings of Fourth International Conference on Natural Computation (ICNC2008), vol. 2, Jinan, Shandong province, China, pp. 197–201, 2008.
[14] D. S. Marcus, T. H. Wang, J. Parker, J. G. Csernansky, J. C. Morris, and R. L. Buckner, “Open access series of imaging studies (OASIS):