DOI: 10.1534/genetics.104.040162
Functional Mapping of Quantitative Trait Loci That Interact With the
hg
Mutation to Regulate Growth Trajectories in Mice
Rongling Wu,*
,1Chang-Xing Ma,* Wei Hou,* Pablo Corva
†and Juan F. Medrano
†*Department of Statistics, University of Florida, Gainesville, Florida 326111 and†Department of Animal Science, University of California, Davis, California 95616
Manuscript received December 20, 2004 Accepted for publication May 18, 2005
ABSTRACT
The high growth (hg) mutation increases body size in mice by 30–50%. Given the complexity of the genetic regulation of animal growth, it is likely that the effect of this major locus is mediated by other quantitative trait loci (QTL) with smaller effects within a web of gene interactions. In this article, we extend our functional mapping model to characterize modifier QTL that interact with the hg locus during ontogenetic growth. Our model is derived within the maximum-likelihood context, incorporated by mathematical aspects of growth laws and implemented with the EM algorithm. In an F2population founded
by a congenic high growth (HG) line and non-HG line, a highly additive effect due to thehggene was detected on growth trajectories. Three QTL located on chromosomes 2 and X were identified to trigger significant additive and/or dominant effects on the process of growth. The most significant finding made from our model is that these QTL interact with thehglocus to affect the shapes of the growth process. Our model provides a powerful means for understanding the genetic architecture and regulation of growth rate and body size in mammals.
T
HE high growth (hg) gene is a spontaneous muta-tion that results in a 30–50% increase in postnatal body growth in mice (Bradford and Famula 1984).Earlier physiological studies suggest that the increase of growth efficiency by thehglocus stems from increased energy metabolism without altering overall body com-position (Calvertet al.1985, 1986). Using an
interval-mapping approach (Lander and Botstein 1989),
Horvat and Medrano (1995) have localized the hg
locus near Dl0Mit41 on the distal half of mouse chromo-some 10 in both female and male F2populations. These authors further found that the hg phenotype is the result of a 500-kb deletion in chromosome 10 that includes three genes, suppressor of cytokine signaling-2 (Socs2), CASP2 and RIPH1 domain containing adaptor with death domain (Raidd/cradd), and viral encoded semaphorin receptor (Vespr orPlexin C1) (Wonget al.
2002). The HG phenotype results from the lack of ex-pression ofSocs2 (Horvatand Medrano2001), which
regulates growth hormone signal transduction.
Given the genetic complexity of growth, it is unlikely that the hg gene triggers a marked effect on growth rate and body size with no mediation by environment and other loci. As observed by Corva and Medrano
(2000), for example, the nutritional environment con-founds the expression of the hg effect on the high growth phenotype in mice. To identify modifiers of
the hg locus, Corva et al. (2001) developed an F2
population segregating forhg to examine interactions between hg and other growth genes. They identified a significant quantitative trait locus (QTL), Q2Ucd2, located on chromosome 2, affecting weight gain from 2–9 weeks. This QTL accounts for 10.4% of the phe-notypic variance in the homozygoushg/hgmice and also exerts effects on carcass ash and protein and femur length.
Comparing two F2subpopulations, one homozygous for the mutant allele (hg/hg) and the other homozygous for the wild-type allele (1/1), Corvaet al.(2001)
de-tected a growth QTL that was expressed differently be-tween the two subpopulations and, therefore, thought to interact with the hglocus. Such an hg background-dependent QTL identified from single-trait mapping makes it worthwhile to perform more thorough QTL analyses for ontogenetic growth using functional map-ping (Ma et al. 2002; Wu et al. 2004a,b,c; Zhao et al.
2004). Functional mapping that integrates mathemati-cal aspects of growth laws into a mapping framework can localize dynamic QTL responsible for the biological process of a trait measured at a finite number of time points and provide biologically meaningful results about QTL detection. By estimating the parameters that determine shape and function of a particular biological process, rather than directly estimating gene effects at all possible points during the entire time course, func-tional mapping strikingly reduces the number of param-eters to be estimated and, hence, displays increased 1Corresponding author:Department of Statistics, 533 McCarty Hall C,
University of Florida, Gainesville, FL 32611. E-mail: [email protected]
statistical power to detect hidden QTL for growth processes.
The motivation of this article is to develop a statistical model for detecting QTL that interact with thehglocus to influence the growth process within the context of functional mapping. Unlike single time point analyses by Corvaet al.(2001), this model provides a
quantita-tive and testable framework for studying the interplay between epistasis and growth pattern. Also, unlike our earlier interaction model for a pair of unknown QTL (Wuet al.2004a), this model attempts to detect epistasis
between modifier QTL and a known gene on the ge-nome, which is supposed to provide better estimates of the QTL locations. Although motivated to solve a prac-tical problem in mouse QTL mapping (Corva et al.
2001), we have developed a general epistasis-detecting model that can be used to unveil the genetic secrets of growth trajectories for other species.
MODEL
Background and problem:Thehgmutation has been
introgressed into the C57BL/6J (C57) background through nine backcrosses to create congenic line C57BL/6J-hg/hg
(HG). A mapping population was founded by mating smaller CAST/EiJ (CAST) males to HG females, which produced a total of 75 F1and 1132 F2mice (Corvaet al.
2001). To test the segregation of hg in the mapping population, these F2 mice were genotyped by using D10Mit41 on chromosome 10, detected to be linked withhg and D10Mit69, a marker that maps within the
hgdeletion (Horvatand Medrano1995). Mice
homo-zygous for HG alleles at D10Mit41 and without a PCR amplification product for D10Mit69 (indicating homozygosity for thehg deletion) were thought to be homozygous for the mutant allele (expressed ashg/hg). On the other hand, mice homozygous for CAST alleles at D10Mit41 and amplifying for D10Mit69 were re-garded as being homozygous for the wide-type allele (expressed as1/1). It was found that there were 2741/1mice, 5961/hgmice, and 262hg/hgmice in the F2cross, which conforms to Mendelian segregation ratios.
Our hypothesis is that there exist particular QTL for body growth that are expressed differently among the threehg-typical genotypes. Such QTL are thought to be modifiers that epistatically modulate the effects ofhg. Below, we modify our functional mapping model (Ma et al.2002; Wuet al.2004a,c) to detect QTL modifiers
that display epistatic effects with thehglocus on growth trajectories.
The likelihood function: Suppose there aren mice
for the F2, which is composed of three subpopulations for thehggene with sizenj(j¼2 for genotypehg/hg,
1 for genotypehg/1, and 0 for genotype1/1). Assume that a QTL for growth curves or trajectories is
segregat-ing to form three genotypes, expressed byk(k¼2 for
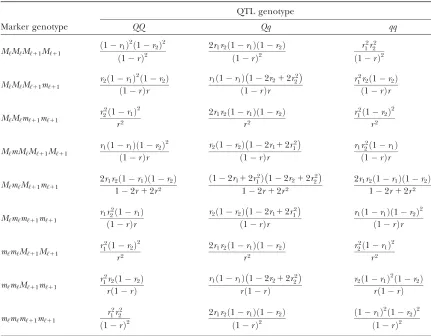
QQ, 1 forQq, and 0 forqq), with allelesQfrom the HG parent andqfrom the CAST parent. Consider a genetic linkage map constructed for the F2 using molecular markers. The foundation of interval QTL mapping is laid on the mixture model in which each F2individual is assumed to arise from one and only one of the pos-sible QTL genotypes within known genotypes of two markers that bracket the QTL (Landerand Botstein
1989). The frequencies of each QTL genotype within marker interval genotypes, i.e., the conditional QTL genotype probabilities given markers (see Table 1), are embedded within the mixture model to reflect the genomic position of the QTL within the marker interval.
Let-k(j)jibe the conditional probability of a jointhg
-QTL genotype for individualigiven a marker genotype. The likelihood function of growth data,y, measured at
Tdifferent time points for thehggene and putative QTL is written as
Lð-;u;SjyÞ ¼Y n
i¼1 X2
j¼0 X2 k¼0
-kðjÞjifðyi;ukðjÞ;SkðjÞÞ
" #
ð1Þ
¼Y 2 k¼0
Ynj
i¼1 X2
j¼0
-kjifðyiðjÞ;ukðjÞ;SjÞ
" #
; ð2Þ
where -is the parameter for QTL position contained in the matrix of the QTL conditional probability, u
contains the genotypic mean vector for different hg -QTL genotypes, andSis the residual covariance matrix withinhg-QTL genotypes. Equation 1 can be converted to Equation 2 because for each individual the hg
genotype is known and, thus, the product of the likeli-hood over different individuals is made among three differenthggenotypes. In Equation 2, nine jointhg-QTL genotypes in the mixture model for a given individuali
can be simply expressed by three QTL genotypes separately for threehggenotypes. For this reason,-k(j)ji
can be expressed by -kji. We assume that the residual
covariance matrix is different among thehggenotypes but the same within different QTL genotypes (see Equation 2).
The conditional probability -kji can be differently
calculated when the QTL andhgare located at different marker intervals and when they are located next to each other. In the former case,-kji’s have the same form for
each of the three hg genotypes (see Table 1). In the latter case, -kji’s have different forms for different hg
genotypes, but they still can be obtained from Table 1 by treating thehggene as a marker. The choice of one of the two flanking markersM‘andM‘11in Table 1 as the
hggene depends on the left or right side of thehggene at which the QTL is located.
traits measured for individualiin each subpopulationk
is expressed as
fðyiðjÞ;ukðjÞ;SjÞ ¼
1 ð2pÞT=2jS
jj1=2
exp1
2ðyiðjÞukðjÞÞSj1ðyiðjÞukðjÞÞT
h i
;
where yi(j) ¼ [yi(j)(1),. . .,yi(j)(T)] is a vector of
subpopulation-specific observation measured atTtime points, anduk(j)¼[uk(j)(1),. . .,uk(j)(T)] is a vector of
expected values for genotypejkat different points. At a particular timet, the relationship between the observa-tion and expected genotypic value can be described by a linear regression model,
yiðjÞðtÞ ¼X 2 j¼0
xikukðjÞðtÞ1eiðjÞðtÞ;
wherexijis the indicator variable denoted as 1 if a QTL
genotypekis considered for subjectiand 0 otherwise;
andei(j)(t) is the residual error that is i.i.d. normal with
the mean of zero and the variance ofs2
jðtÞ. The errors at
two different time points,t1andt2, are correlated with the covariance of covj(t1,t2). These (co)variances
com-pose a (TT) matrixSj.
Modeling the mean vector and (co)variance matrix:
The estimation of the mean vectoruk(j)and the (co)var-iance matrixSjis statistically difficult because they involve
too many unknown parameters given a possible sample size. Also, such direct estimation does not take into account the biological principles of growth and de-velopment. We incorporate the universal growth law, as described by a logistic equation, into the estimation pro-cess of the likelihood function (Equation 2). Thus, the mean value ofhg-QTL genotypejkat timetis expressed by
ukðjÞ¼
akðjÞ 11bkðjÞeckðjÞt
; ð3Þ
where the growth parameter setGkðjÞ¼ ðakðjÞ;bkðjÞ;ckðjÞÞ
describes the asymptotic growth, initial growth, and TABLE 1
Conditional probabilities (-kji) of QTL genotypes given marker genotypes for M‘and M‘+1in the F2population
QTL genotype
Marker genotype QQ Qq qq
M‘M‘M‘11M‘11
ð1r1Þ 2ð
1r2Þ 2
ð1rÞ2
2r1r2ð1r1Þð1r2Þ
ð1rÞ2
r2 1r
2 2
ð1rÞ2
M‘M‘M‘11m‘11
r2ð1r1Þ 2ð
1r2Þ
ð1rÞr
r1ð1r1Þ 12r212r22
ð1rÞr
r2
1r2ð1r2Þ
ð1rÞr
M‘M‘m‘11m‘11
r2 2ð1r1Þ2
r2
2r1r2ð1r1Þð1r2Þ
r2
r2 1ð1r2Þ
2
r2
M‘mM‘M‘11M‘11
r1ð1r1Þð1r2Þ 2
ð1rÞr
r2ð1r2Þ 12r112r12
ð1rÞr
r1r22ð1r1Þ
ð1rÞr
M‘m‘M‘11m‘11
2r1r2ð1r1Þð1r2Þ
12r12r2
ð12r112r12Þ 12r212r22
12r12r2
2r1r2ð1r1Þð1r2Þ
12r12r2
M‘m‘m‘11m‘11
r1r22ð1r1Þ
ð1rÞr
r2ð1r2Þ 12r112r12
ð1rÞr
r1ð1r1Þð1r2Þ 2
ð1rÞr
m‘m‘M‘11M‘11
r2 1ð1r2Þ
2
r2
2r1r2ð1r1Þð1r2Þ
r2
r2 2ð1r1Þ
2
r2
m‘m‘M‘11m‘11
r2
1r2ð1r2Þ
rð1rÞ
r1ð1r1Þ 12r212r22
rð1rÞ
r2ð1r1Þ2ð1r2Þ
rð1rÞ
m‘m‘m‘11m‘11
r2 1r
2 2
ð1rÞ2
2r1r2ð1r1Þð1r2Þ
ð1rÞ2
ð1r1Þ2ð1r2Þ2
ð1rÞ2 r1,r2, andrare the recombination fractions between markerM‘and the QTL, between the QTL and marker M‘11, and between the two flanking markers. Marker allelesM‘andM‘11are assumed to be from the HG parent
relative growth rate, respectively. With this growth equation, we need only estimate the growth parameters, rather than estimate genotypic values at every point, to detect genotypic differences in growth. This can signif-icantly reduce the number of unknown parameters to be estimated, especially when the number of time points is large. Moreover, the statistical significance of a QTL and its interaction with the hggene can be tested by comparing these growth parameters among the three different QTL genotypes across different subpopulations.
Similarly, the covariance matrix can be structured with an appropriate model. Statistical analysis of longi-tudinal data has established a number of structural models that capture most of the information contained in the matrix (Diggleet al.2002). Here, we use a
first-order autoregressive [AR(1)] model to model the struc-ture of the matrix, which is based on two assumptions, first, the variances2is constant over time, and, second,
the correlation decays in a proportion of r purely with time interval. With the AR(1) model, we need only estimateQj¼(rj,s2jÞinstead of all elements in the
matrix. The advantage of such a matrix-structuring model is to reduce the number of unknown parameters, without losing the information of the matrix. Many other structural models may be more advantageous over the stationary AR(1) model, but the choice of an optimal model in a particular situation should be based on statistical tests, as described in Kirkpatrick
and Heckman (1989), Pletcher and Geyer (1999),
Zimmermanand Nunez-Anton(2001), and Pletcher
and Jaffrezic(2002).
Computational algorithms: As classified above, the
unknown parameters that build up the likelihood function (Equation 2) include the curve parameters, matrix-structuring parameters, and the QTL genotype frequencies specified by QTL position measured in terms of the recombination fractions (r1orr2) between the QTL and its flanking markers (see Table 1). Arrayed by V¼ fVjg
2
j¼0 ¼ fGkðjÞ;Qj;r1g
2
j¼0, these unknowns can be estimated through differentiating the log-likelihood function of Equation 2 with respect to each unknown, setting the derivative equal to zero, and solving the log-likelihood equations. This estimation process can be implemented with the expectation-maximization (EM) algorithm (Dempster et al. 1977)
as described below.
The log-likelihood function of growth and marker data (Mj) for subpopulationkbased on Equation 1 is
given by
logLjðVjjyjÞ ¼ Xnj
i¼1
log X 2 k¼0
-kjifðyiðjÞ;GkðjÞ;QjÞ
" #
;
with the derivative with respect to any elementVl
o
oVllogLjðVjjyjÞ ¼ Xnj
i¼1 X2 k¼0
-kjiðo=oVlÞfðyiðjÞ;GkðjÞ;QjÞ P2
k9¼0½-k9jifðyk9ðjÞ;Gk9ðjÞ;QjÞ
¼X nj
i¼1 X2 k¼0
-kjifðyiðjÞ;GkðjÞ;QjÞ P2
k9¼0½-k9jifðyk9ðjÞ;Gk9ðjÞ;QjÞ
o oVl
logfðyiðjÞ;GkðjÞ;QjÞ
¼X nj i¼1 X2 k¼0 Pkji o
oVllogfðyiðjÞ;GkðjÞ;QjÞ;
where we define
Pkji¼P2-kjifðyiðjÞ;GkðjÞ;QjÞ j¼0-kjifðyiðjÞ;GkðjÞ;QjÞ
; ð4Þ
which could be thought of as a posterior probability that progeny i with a particular marker genotype has QTL genotypej. We then implement the EM algorithm with the expanded parameter setfV,Pg, whereP¼ fPkjig.
Conditional onP(the E step; Equation 4), we solve for o
oVllogLjð-j;VjjyjÞ ¼0 ð5Þ to get the estimates ofV(the M step; Equation 5). The estimates are then used to updateP, and the process is repeated between Equations 4 and 5 until convergence. The values at convergence are the maximum-likelihood estimates (MLEs) of V. The iterative expressions of estimatingVfrom the previous step were given in Ma et al. (2002) and Wuet al. (2002, 2004b). In Wu et al.
(2002), approximate estimates of the samplings errors from Fisher’s information matrices were given.
As usual, the QTL position parameter can be viewed as a known parameter because a putative QTL can be searched at every 1 or 2 cM on a map interval bracketed by two markers throughout the entire linkage map. The amount of support for a QTL at a particular map position is often displayed graphically through the use of likelihood maps or profiles, which plot the likelihood-ratio test statistic as a function of map position of the putative QTL.
Hypothesis tests:Different from traditional mapping
approaches, our functional mapping for longitudinal traits allows for the tests of a number of biologically meaningful hypotheses (Wu et al. 2004a). These
hy-pothesis tests can be a global test for the existence of significant QTL, a local test for the genetic effect on growth at a particular time point, aregionaltest for the overall effect of QTL on a particular period of growth process, or an interaction test for the change of QTL expression across times. These tests at different levels can be formulated to test the effects of QTLhg inter-action on the shape of growth.
the genetic architecture of growth and development. The genetic control over entire growth processes can be tested by formulating the following hypotheses:
H0: GkðjÞ[Gj;j;k¼0;1;2
H1: Not all the equalities in H0hold: ð6Þ
The H0 states that there are no QTL affecting growth trajectories and the three genotypic curves in each subpopulation overlap (the reduced model), whereas the H1 proposes that such QTL do exist (the full model). The test statistic for testing the hypotheses in Equation 6 is calculated as the log-likelihood ratio of the reduced to the full model,
LR¼ 2½logLðV˜ jyÞ logLðVˆ jy; ð7Þ where V˜ and Vˆ denote the MLEs of the unknown parameters under H0 and H1, respectively. The LR is asymptoticallyx2-distributed with 18 d.f. An empirical
approach for determining the critical threshold is based on permutation tests, as advocated by Churchilland
Doerge (1994). By repeatedly shuffling the
relation-ships between marker genotypes and phenotypes, a series of the maximum log-likelihood ratios are calcu-lated, from the distribution of which the critical threshold is determined.
After a significant QTL is detected, the next test is about the interaction effect between this QTL andhgon growth. We use the area under curve (Ak(j)) as a criterion
for this QTLhginteraction test, expressed as
AkðjÞ¼ ðT
0
akðjÞ 11bkðjÞeckðjÞt
dt
¼akðjÞ
ckðjÞ
lnðbkðjÞ1eckðjÞTlnðbkðjÞ11Þ
:
In this case, the null hypothesis for testing QTLhg
interaction can be formulated as
A2ðjÞA1ðjÞ[A2A1 and A1ðjÞA0ðjÞ[A1A0;
j¼2;1;0;
i.e.,the difference between the areas under curves of different QTL genotypes is set equal for the threehg
genotypes.
In addition to testing overall genetic effects on growth trajectories, our model allows for the tests of the additive and dominant effects as well as the in-teraction effects between the QTL andhglocus. Leta1 anda2be the additive effects of thehgand QTL;d1and
d2be the dominant effect of thehgand QTL; andI,J,K, andLbe the additiveadditive, additivedominant, dominant additive, and dominant dominant epi-static effects between the loci (Lynchand Walsh1998).
We tabulateAk(j)in terms of their genetic compositions as
whereA is the overall mean. Hypothesis tests for these genetic effects are formulated with constraints
A2ð2Þ1A0ð2Þ¼A2ð0Þ1A0ð0Þ;
A2ð2Þ1A2ð0Þ¼A0ð2Þ1A0ð0Þ;
for the additive genetic effects of the hg and QTL, respectively,
2ðA2ð1Þ1A0ð1ÞÞ ¼A2ð2Þ1A2ð0Þ1A0ð2Þ1A0ð0Þ; 2ðA1ð2Þ1A1ð0ÞÞ ¼A2ð2Þ1A2ð0Þ1A0ð2Þ1A0ð0Þ; for the dominant genetic effects of the hg and QTL, respectively, and
A2ð2Þ1A0ð0Þ¼A0ð2Þ1A2ð0Þ;
2ðA1ð2ÞA1ð0ÞÞ ¼A2ð2Þ1A0ð2ÞA2ð0ÞA0ð0Þ;
2ðA2ð1ÞA0ð1ÞÞ ¼A2ð2Þ1A2ð0ÞA0ð2ÞA0ð0Þ;
2ðA2ð1Þ1A0ð1Þ1A1ð2Þ1A1ð0Þ¼A2ð2Þ1A2ð0Þ1A0ð2Þ1A0ð0Þ14A1ð1Þ;
for the additiveadditive, additivedominant, domi-nant additive, and dominant dominant genetic effect interactions between thehgand QTL, respectively.
RESULTS
To detect QTL modifiers, we need to genotype and phenotype F2mice from each of the threehggenotypes
hg/hg,hg/1, and 1/1. However, the animal material available to our QTL analysis contains only two sub-populationshg/hgand1/1developed by Corvaet al.
(2001) with a two-step approach as follows: In the first step, a linkage map covering the 19 autosomes and one sex chromosome (X) was constructed with 83 molecular markers for 262hg/hgmice from the F2cross. A simple analysis of variance approach was used to detect sig-nificant markers associated with growth rate and body weight. In the second step, the most significant markers genotyped in thehg/hgsubpopulation were also typed for the 274 1/1 mice from the same F2population. These genotyped markers were found to be located at chromosomes 1, 2, 4, 9, and X (Corvaet al.2001), with
which a common linkage map that integrates the two subpopulations was constructed.
QQ Qq
hg=hg
hg=1 1=1
A2ð2Þ¼A1a11a21I A1ð2Þ¼A1a11d21J
A2ð1Þ¼A1d11a21K A1ð1Þ¼A1d11d21L
A2ð0Þ¼Aa11a2I A1ð0Þ¼Aa11d2J 0
B @
A0ð2Þ¼A1a1a2I
A0ð1Þ¼A1d1a2K
A0ð0Þ¼Aa1a21I 1 C
Both the hg/hg and 1/1 subpopulations were phenotyped for body weight on a weekly basis from 2 to 9 weeks of age. However, about one-third of the mice from each subpopulation were measured only at weeks 3, 6, and 9. Although our original model was designed for the same measurement schedule for all subjects (Ma et al.2002), a recent model has been derived to handle subject-dependent measurement schedules with a rea-sonable convergence rate (Hou et al.2005). Data for
body weights at different ages were corrected for the effects of dam, litter, sex, and parity.
The logistic curve described by Equation 3 was used to fit the growth trajectory for each mouse, using non-linear least-squares approaches. Statistical tests indicate a good fitness at the significance levelP,0.001. There is a substantial difference in growth pattern between the two F2subpopulations,hg/hgand1/1(Figure 1). On average, these two subpopulations are similar from birth to age 3 weeks, but after 3 weeks thehg/hgmice display much greater growth (Figure 1B) than do the 1/1
mice (Figure 1A). Substantial variation in growth curve among different animals in each subpopulation sug-gests that specific QTL may be involved in shaping developmental trajectories.
Our mapping model is employed to search for growth QTL through a genome-wide scanning approach. Figure 2 illustrates the profile of the log-likelihood ratio (LR) test statistics throughout the common linkage map for the two subpopulations. The ‘‘genome-wide’’ critical threshold value throughout the common linkage map at thea¼0.01 significance level was estimated as 155.2 on the basis of 1000 permutation tests. According to this criterion, two separate QTL each corresponding to a peak of the LR profile were detected on chromosome X. We also computed the chromosome-wide critical thresh-olds with the LR peaks of individual chromosomes. A few distinct peaks on chromosome 2 may carry multiple QTL according to this criterion. On the basis of earlier studies with the same mapping material, the locations of these suggestive QTL (Figure 2) contain important QTL for many growth-related traits (Corva et al.
2001). For this reason, we perform an in-depth
hypoth-esis test for the QTL located at the highest peak (Figure 2), as for the two QTL on chromosome X.
The three growth curves each determined by a genotype at each of these significant QTL are drawn separately for thehg/hgand1/1mice (Figure 3), using the MLEs of curve parameters (G^kðjÞ; Table 2) from our
model. As expected, the hg locus displays a striking (additive) effect on growth trajectories (Table 3). The growth trajectories of the same QTL genotype are different between the two subpopulations, suggesting that the genetic expression of QTL is affected by genetic background. In general, the three detected QTL start to exert their effects on growth in both subpopulations when the mice are 3 weeks of age (Figure 4). After this age, the QTL effects tend to increase with age.
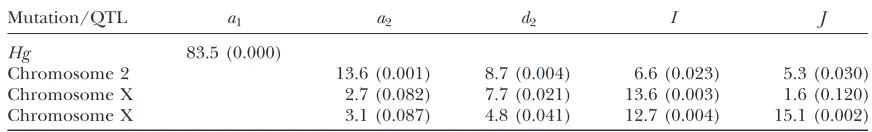
We further tested the QTL effects and how they interact with the hglocus to affect growth trajectories. On the basis of the hypothesis test given in Equation 7 and others, we calculated the LR values for the additive and dominant effects of the QTL and its interaction effects with hgfor all three QTL (Table 3). The QTL detected on chromosome 2 has highly significant additive and dominant effects on growth trajectories, operating in a dominant gene action manner as shown by small differences between genotypes Qq and QQ
in both subpopulations (see Figure 3). This QTL also displays significant additive additive and additive dominant epistatic effects with thehglocus.
Located on the same chromosome, the two QTL detected on chromosome X exhibit different modes of gene action for growth. The first QTL at 3 cM from the first marker has a nonsignificant additive effect but highly significant dominant effect (Table 3; Figure 3B). When interacting with the hg gene, however, this dominant QTL displays an inverse pattern, i.e., with a significant additiveadditive but nonsignificant addi-tivedominant epistatic effects (Table 3). The second QTL at 37 cM from the first marker seems to act in a partial dominant manner (Figure 3C), with both types of epistatic effects being significant (Table 3). Except for the first QTL on chromosome X with a nonsignif-icant additive effect, the favorable allele at the other Figure1.—Plots of body massvs. ages for (A) 2xx1/1mice and (B) 2xx hg/hg mice in an F2 progeny
derived from HG and CAST lines (Corvaet al.2001).
QTL that contribute to greater growth originates from the HG parent.
Because only two hg genotypes are included, we cannot estimate all the QTL-hg epistatic effects. The dynamic changes of different types of genetic effects for thehgand QTL across ages that can be estimated are
a1ðtÞ ¼12½u2ð2ÞðtÞ1u0ð2ÞðtÞ u2ð0ÞðtÞ u0ð0ÞðtÞ for the additive genetic effect of thehglocus,
a2ðtÞ ¼1
2½u2ð2ÞðtÞ1u2ð0ÞðtÞ u0ð2ÞðtÞ u0ð0ÞðtÞ for the additive genetic effect of the QTL,
d2ðtÞ ¼14½2u1ð2ÞðtÞ1u1ð0ÞðtÞ u2ð2ÞðtÞ u2ð0ÞðtÞ u0ð2ÞðtÞ u0ð0ÞðtÞ
for the dominant genetic effect of the QTL,
IðtÞ ¼1
2½u2ð2ÞðtÞ1u0ð0ÞðtÞ u0ð2ÞðtÞ u2ð0ÞðtÞ for the additiveadditive genetic effect, and
JðtÞ ¼1
4½2u1ð2ÞðtÞ 2u1ð0ÞðtÞ u2ð2ÞðtÞ u0ð2ÞðtÞ
1u2ð0ÞðtÞ1u0ð0ÞðtÞ
for the additivedominant genetic effect betweenhg
and QTL. All these age-dependent changes of genetic effects are illustrated in Figure 4. The additive effect (a1) of thehglocus increases rapidly with age, and so do the additive (a2) and/or dominant effects (d2) of the QTL, but with a lesser extent. The interaction effects (IandJ) between the QTL andhgare quite stable over age, contributing to a significant part of the genetic variation throughout growth ontogeny.
DISCUSSION
Traditional quantitative genetic theory proposes that genetic variation in a quantitative trait is due to polygenes each with a small effect on the phenotype and being sensitive to the environment (Lynch and
Walsh 1998). Although this theory has led to
sub-stantial successes in the explanation of quantitative variation, it has been challenged by recent discoveries
of QTL based on polymorphic markers. According to these QTL mapping results, a quantitative trait may be governed by unequally sized loci with a few having larger effects than many others (Mackay 2001). A 30–50%
increase of body size in mice caused by thehgmutation
(Bradford and Famula 1984) provides excellent
evidence for the inclusion of a major gene in the genetic control of a quantitative trait.
As part of the complex network of genetic control, the expression of thehglocus should not be independent of the genetic background (Corvaet al.2001). It thus is of
great interest to identify individual QTL that interact with the hg locus using mapping approaches. The identification of such QTL can improve our under-standing of the interactions between pathways of sig-nal transduction involved in the regulation of growth. This information can then be transferred to the development of techniques targeted to manipulate these growth-regulating pathways in mammals.
In this article, we have presented a statistical model for detecting interacting QTL involved in the regulation of growth through the hg locus. This model is the extension of our functional mapping approach (Ma et al.2002; Wuet al.2004a; Zhaoet al.2004) proposed to
shed light on the genetic architecture of growth by incorporating its underlying developmental principles (vonBertalanffy1957; Rice1997; Westet al.2001)
and the statistical methods for growth analysis (Diggle et al.2002). A QTL is thought to be epistatic with thehg
gene if its expression depends on the genetic back-ground containing segregatinghg. The extended model has power to estimate the differences in the gene action of a QTL expressed in different hg genotypes. Corva et al. (2001) constructed a segregating F2 population using a congenic hg/hg line and a wild-type inbred line. Molecular markers at genomic regions that may contain QTL for growth rate and body size were ge-notyped to construct a common linkage map for two F2 subpopulations, hg/hg and1/1. Thus, by estimat-ing and testestimat-ing the genetic effects of a QTL in these two different subpopulations, we can determine how the QTL, as a modifier, influences the expression of the
hg/hggene.
Our model has successfully detected three QTL that interact with thehggene to govern the shape of growth trajectories. These detected QTL on chromosomes 2 and X affect growth curves with different modes of gene action. The estimation for the location of the QTL on chromosome 2 is broadly in agreement with that by previous QTL mapping based on a single-trait analysis
(Corva et al. 2001), although our analysis is more
informative in terms of age-dependent changes of QTL effects and the detection of epistasis in the genetic control of growth traits. The epistasis between the detected QTL and thehglocus is relatively small, relative to their main effects, but is thought to play a significant role in shaping growth processes. As illustrated by Figure 4, there are different patterns for the change of different genetic effects across ages. The additive effect of the
hg locus increases rapidly with age, and so do the ad-ditive and/or dominant effects of the QTL, but to a lesser extent. The interaction effects between the QTL andhgare quite stable over age, contributing a signifi-cant part of the genetic variation throughout growth ontogeny.
Figure3.—Three growth curves, each presenting a group of genotype QQ(solid curves),Qq (dashed curves), and qq (dotted curves), in thehg/hg(red) and 1/1 (blue) mice at the QTL, detected by our joint model, on chromosomes 2 (A) and X (B and C).
The genetic control of body size across age has been observed in mice by both quantitative genetic
(Cheverud 1984; Atchleyand Zhu 1997) and QTL
mapping approaches (Cheverudet al. 1996; Vaughn et al.1999). It is suggested that the formation of such age-specific patterns is regulated by different genetic mechanisms. Falconer et al. (1978) speculated two
general physiological mechanisms that determine the increase in body size in mice, but these mechanisms appear to act at different life stages (Atchleyand Zhu
1997). This has been confirmed by QTL mapping of mouse growth traits in that early and late growth in mice were affected by distinct QTL, mapping to separate chromosome locations (Cheverudet al.1996; Vaughn et al. 1999). In other animals, Carlborget al. (2003)
found that epistasis is important for early growth when the foundation for rapid growth is set by the develop-ment of internal organs, but less important for later growth involving the main deposition of body tissues. Our model has the capacity to quantify the patterns of the age-dependent change of genetic effects and, thus, to gain more insights into the interplay between gene action and development in developmental biological research.
In this study, we have reported only on the additive effect of the hg gene as well as its additive-related epistatic effects with other QTL detected by molecular markers. An F2 subpopulation heterozygous for the mutant and wild-type alleles that would allow estimation of effects due to dominance was not available. Using the available material, we have found three QTL on chromosomes 2 and X that interact with the hglocus to affect the shapes of the growth process. These genetic interactions are thought to play an important role in mediating the expression of thehggene. Our model is fit by one modifier QTL, but it can be readily extended to include more modifiers that interact with each other and with the hggene. The involvement of more QTL in the model can better reflect a practical situation in which there is a web of interacting genes in trait con-trol (Segreet al.2005). Although the available genetic
data from Corva et al. (2001) were not subject to a
multi-QTL analysis because of their low coverage of the mouse genome (including only chromosomes 1, 2, 4, 9, and X), our model derived in this article provides a powerful tool to shed light on the genetic architec-ture and regulation of growth rate and body size in mammals.
TABLE 2
The MLEs of the QTL position, QTL effects described by growth parametersGk(j)= (ak(j),bk(j),ck(j)), residual variance (sj), and correlation (rj) in two different subpopulations of the F2mouse population
QQ Qq qq Residual
Subpopulation Position (cM) a2(k) b2(k) c2(k) a1(k) b1(k) c1(k) a0(k) b0(k) c0(k) rj s2j Chromosome 2
1/1 37 22.88 2.77 0.58 22.15 2.68 0.60 19.86 2.41 0.63 0.88 6.75
hg/hg 28.40 4.36 0.60 27.73 4.06 0.60 24.16 3.35 0.57 0.87 12.05
Chromosome X
1/1 3 21.16 2.58 0.59 22.25 2.61 0.60 21.65 2.68 0.63 0.89 7.06
hg/hg 26.47 3.96 0.61 27.72 4.12 0.59 25.74 3.41 0.55 0.87 13.08
Chromosome X
1/1 29 22.38 2.66 0.58 21.95 2.64 0.60 21.08 2.61 0.63 0.90 7.34
hg/hg 28.43 4.15 0.59 27.36 4.00 0.59 25.21 3.59 0.57 0.87 12.77
Position indicates the map distance in centimorgans from the first marker on a chromosome. UppercaseQ and lowercaseqstand for the alleles from the HG and CAST parents, respectively.
TABLE 3
The LR values and the correspondingP-values (in parentheses, estimated from simulation studies) for testing the additive effect of thehglocus (a1), the additive (a2) and dominant (d2) effects of QTL, and the additive· additive (I) and additive·dominant (J) epistatic effects betweenhgand QTL on overall growth curves
Mutation/QTL a1 a2 d2 I J
Hg 83.5 (0.000)
Chromosome 2 13.6 (0.001) 8.7 (0.004) 6.6 (0.023) 5.3 (0.030)
Chromosome X 2.7 (0.082) 7.7 (0.021) 13.6 (0.003) 1.6 (0.120)
We thank the two anonymous referees for their constructive com-ments on the article. This work is partially supported by National Institutes of Health grant DK52514 to J.M.C. and by an Outstanding Young Investigators award (no. 30128017) of the National Natural Science Foundation of China and the University of Florida Research Opportunity Fund (no. 02050259) to R.W. The publication of this article is approved as journal series R-09205 by the Florida Agricultural Experiment Station.
LITERATURE CITED
Atchley, W. R., and J. Zhu, 1997 Developmental quantitative
genetics, conditional epigenetic variability and growth in mice. Genetics147:765–776.
Bradford, G. E., and T. R. Famula, 1984 Evidence for a major gene
for rapid postweaning growth in mice. Genet. Res.44:293–308. Calvert, C. C., T. R. Famula, J. F. Bernier and G. E. Bradford,
1985 Serial composition during growth in mice with a major gene for rapid postweaning growth. Growth49:246–257. Calvert, C. C., T. R. Famula, J. F. Bernier, N. Khaimand G. E.
Bradford, 1986 Efficiency of growth in mice with a major gene
for rapid postweaning gain. J. Anim. Sci.62:77–85.
Carlborg, O., S. Kerje, K. Schutz, L. Jacobsson, P. Jensenet al.,
2003 A global search reveals epistatic interaction between QTL for early growth in the chicken. Genome Res.13:413–421. Cheverud, J. M., 1984 Quantitative genetics and developmental
constraints on evolution by selection. J. Theor. Biol. 110:
155–171.
Cheverud, J. M., E. J. Routman, F. A. M. Duarte, B.vanSwinderen,
K. Cothran et al., 1996 Quantitative trait loci for murine
growth. Genetics142:1305–1319.
Churchill, G. A., and R. W. Doerge, 1994 Empirical threshold
values for quantitative trait mapping. Genetics138:963–971. Corva, P. M., and J. F. Medrano, 2000 Diet effects on weight gain
and body composition in high growth (hg/hg) mice. Physiol. Genomics3:17–23.
Corva, P. M., S. Horvatand J. F. Medrano, 2001 Quantitative trait
loci affecting growth inhighgrowth(hg) mice. Mamm. Genome
12:284–290.
Dempster, A. P., N. M. Lairdand D. B. Rubin, 1977 Maximum
like-lihood from incomplete data via EM algorithm. J. R. Stat. Soc. Ser. B39:1–38.
Diggle, P. J., P. Heagerty, K. Y. Liang and S. L. Zeger,
2002 Analysis of Longitudinal Data. Oxford University Press, Oxford.
Falconer, D. S., I. Gauldand R. Roberts, 1978 Cell numbers and
cell sizes in organs of mice selected for large and small body size. Genet. Res.31:387–401.
Horvat, S., and J. F. Medrano, 1995 Interval mapping ofhighgrowth
(hg), a major locus that increases weight gain in mice. Genetics
139:1737–1748.
Horvat, S., and J. F. Medrano, 2001 Lack ofSocs2 expression
causes the high-growth phenotype in mice. Genomics 72:
209–212.
Hou, W., C. W. Garvan, W. Zhao, M. Behnke, F. D. Eyleret al.,
2005 A generalized model for detecting genetic determinants underlying longitudinal traits with unequally spaced measure-ments and time-dependent correlated errors. Biostatistics 6:
420–433.
Kirkpatrick, M., and N. Heckman, 1989 A quantitative genetic
model for growth, shape, reaction norms, and other infinite-dimensional characters. J. Math. Biol.27:429–450.
Lander, E. S., and D. Botstein, 1989 Mapping Mendelian factors
underlying quantitative traits using RFLP linkage maps. Genetics
121:185–199.
Lynch, M., and B. Walsh, 1998 Genetics and Analysis of Quantitative
Traits.Sinauer, Sunderland, MA.
Ma, C.-X., G. Casellaand R. L. Wu, 2002 Functional mapping of
quantitative trait loci underlying the character process: a theoret-ical framework. Genetics161:1751–1762.
Mackay, T. F. C., 2001 Quantitative trait loci inDrosophila.Nat. Rev.
Genet.2:11–20.
Pletcher, S. D., and C. J. Geyer, 1999 The genetic analysis of
age-dependent traits: modeling the character process. Genetics153:
825–835.
Pletcher, S. D., and F. Jaffrezic, 2002 Generalized character
process models: estimating the genetic basis of traits that cannot be observed and that change with age or environmental condi-tions. Biometrics58:157–162.
Rice, S. H., 1997 The analysis of ontogenetic trajectories: when a
change in size or shape is not heterochrony. Proc. Natl. Acad. Sci. USA94:907–912.
Segre, D., A. Deluna, G. M. Churchand R. Kishony, 2005 Modular
epistasis in yeast metabolism. Nat. Genet.37:77–83.
Vaughn, T. T., L. S. Pletscher, A. Peripato, K. King-Ellison, E. Adams
et al., 1999 Mapping quantitative trait loci for murine growth: a closer look at genetic architecture. Genet. Res.74:313–322.
von Bertalanffy, L., 1957 Quantitative laws in metabolism and
growth. Q. Rev. Biol.32:217–231.
Figure4.—Dynamic changes of the genetic effects of the hggene (a1) and QTL (a2andd2) as well as their epistatic
in-teractions (IandJ) for the QTL, detected by our joint model, on chromosomes 2 (A) and X (B and C).
West, G. B., J. H. Brownand B. J. Enquist, 2001 A general model
for ontogenetic growth. Nature413:628–631.
Wong, M. L., A. Islas-Trejoand J. F. Medrano, 2002 Structural
char-acterization of the mouse high growth deletion and discovery of a novel fusion transcript between suppressor of cytokine signaling-2 (Socs-2) and viral encoded semaphorin receptor (Plexin C1). Gene
299:153–163.
Wu, R. L., C.-X. Ma, M. Chang, R. C. Littell, S. S. Wuet al., 2002 A
logistic mixture model for characterizing genetic determinants causing differentiation in growth trajectories. Genet. Res. 19:
235–245.
Wu, R. L., C.-X. Ma, M. Linand G. Casella, 2004a A general
frame-work for analyzing the genetic architecture of developmental characteristics. Genetics166:1541–1551.
Wu, R. L., C. X. Ma, M. Lin, Z. H. Wang and G. Casella,
2004b Functional mapping of quantitative trait loci underlying growth trajectories using a transform-both-sides logistic model. Biometrics60:729–738.
Wu, R. L., Z. H. Wang, W. Zhaoand J. M. Cheverud, 2004c A
mech-anistic model for genetic machinery of ontogenetic growth. Genetics168:2383–2394.
Zhao, W., C.-X. Ma, J. M. Cheverudand R. L. Wu, 2004 A unifying
statistical model for QTL mapping of genotype-sex interac-tion for developmental trajectories. Physiol. Genomics 19:
218–227.
Zimmerman, D. L., and V. Nunez-Anton, 2001 Parametric modeling