Review
1
Overview of genomic tools for circular visualization
2
in next-generation genomic sequencing era
3
Alisha Parveen
1, Sukant Khurana
2, & Abhishek Kumar
3, *4
5
1Medical Research Center, Medical Faculty of Mannheim, University of Heidelberg, Mannheim, Germany;
6
7
2Pharmacology Department, Central Drug Research Institute - Lucknow, Uttar Pradesh, India;
8
9
3Department of Genetics & Molecular Biology in Botany, Institute of Botany, Christian-Albrechts-University at
10
Kiel, Germany; [email protected]
11
* Correspondence: [email protected]; Tel.: +49-17647164094
12
13
Abstract:
After human genome sequencing and rapid changes in genome sequencing methods, we14
have entered in the era of rapidly accumulating genome-sequencing data. This has poses
15
development of several types of methods for representing results of genome sequencing data.
16
Circular genome visualizations tools are also critical in this area as they provide rapid interpretation
17
and simple visualization of overall data. In the last 15 years, we have seen rapid changes in circular
18
visualization tools after the development of the circos tool with 1-2 tools published per year. Herein
19
we have summarized and revisited all these tools until the third quarter of 2018.
20
Keywords: circular visualization; circos; genomics; next-generation sequencing
21
22
1. Introduction
23
Genomic data visualization is the hallmark of genetics and genomic studies. With the rapid
24
amplification of genomic data after the year 1995, both prokaryotic and eukaryotic genomic
25
visualization has become the center stage of genome researcher. This has rapidly faced challenges
26
with the great leap in the next-generation DNA sequencing technologies [1]. Optimization of whole
27
genome sequencing technology in the parameter of time consumption, data quality have been
28
transformed the field of comparative genomics analysis from the dimensions of comparison of
29
reference sequences assemblies to the individual genome [2]. Excessively, increasing in sequence
30
information and their annotations help in the development of advanced computational algorithms to
31
store, process, analyze and visualize genomic data [1]. Visualization approach in comparative
32
genomics is an advanced method in data modeling, analysis and presenting correlation between
33
them. It plays a crucial role in the statistical analysis of multi-dimensional genomic data that describes
34
their relationships [3]. However, still, there is a lack of rearrangement of visualization of genome
35
annotation in sequencing. To challenge this problem, genomic circular visualization is a virtual
36
paradigm for comparative genomics dataset in order to view the correlations between the amount of
37
sequencing data and its annotations from high-throughput sequencing technology [3]. It displays a
38
map that shows relations between genomic intervals. In the last 2 decades or so, there have been
39
rapid improvements in circular data visualization methods (Figure 1) and tools. Herein, this study
40
reviews the circular visualization of genomic tools in multidimensional genomic big data.
41
42
2. Materials and Methods
43
We have reviewed existing tools for circular visualization of genomic data.
44
3. Results
45
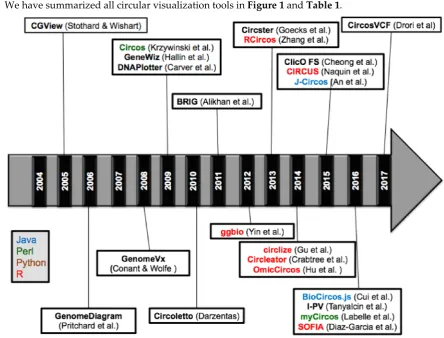
We have summarized all circular visualization tools in Figure 1 and Table 1.
46
47
Figure 1. Timeline of genome visualization tools using circular methods or circos-based methods.
48
3.1 Circoletto
49
Circoletto is a flexible, compatible suite in rearrangement of genomic sequence for
50
visualization in comparative analysis written in perl. It works in close combination with BLAST
51
output and circos. Circoletto acquire either BLAST alignment output or query sequence and database
52
sequence to predict e-value for best local alignment. For more information of the sequence relations
53
and annotations, load custom annotation file, which can contain information to colour the entries
54
(e.g. into functional groups), and mark coordinate-based domains on the ideograms. A ribbon-like
55
structure is generated that represents sequence alignment calculated by BLAST. Width of the ribbon
56
represents alignment length and bit score is generated in four quartiles is represented in a
57
different color pattern of ribbon such as blue represents the worst with below 25% bitscore, green is
58
lower medium bandwith after 25% bitscore, orange stands for the third position, and finally red
59
represents the best bandwith between 75%-100% bitscore followed by the black band which placed
on the top that represents the best alignment between query sequence and their corresponding
61
database sequence [4].
62
3.2 Circos
63
Circos is a command line software written on perl programming language for visualization
64
of genomic sequence and features [5] and this tool is now available in various formats and it is most
65
used tool for genomic visualization (http://circos.ca/).
66
This tool helps in constructing the circular plots of establishing genomic relationship of
67
various kinds and one of such relationship is shown in Figure 2. Circos have an effective feature that
68
displays genomic variations, sequence alignment, a genomic assembly that focuses on the difference
69
and similarities between genomes [5].
70
71
Figure 2. Visualization of whole genome by using Circos [5]. Data taken from the ICGC, specifically
72
pancreatic adenocarcinoma tumor samples from various donors. It shows a number of layers, starting
73
from the outer layer representing color and size distinguished chromosomes, moving clockwise from
74
chromosome 1 to 22, then X and Y. Inside the chromosomes ring, you can see a line representation of
75
copy number mutations. When expanded (by clicking a chromosome), more details on the precise
76
copy number at specific locations are revealed. Hover the bars for further details.
77
78
3.3 J-Circos
79
J-Circos is a javascript-based genomic visualization and is robust in nature that increases the
80
sensitivity of packages in an operating system [6]. Each circle indicates gene expression, gene fusions,
and change in chromosomal rearrangement [6]. The observation of arranged in a) color, which is
82
selected by three integer number and are separated by commas, b) chromosomes concatenated one
83
by one according to their size file, c) Beginning of nucleotide position, and d) length that represents
84
UCSC-bigWig/bedgraph/Circos-wiggle/Circos-bridge lines to construct complex interactions [6]. For
85
Translocation and fusion, J-circos generate circos bridge for visualization. In the final output, the
86
outer ring represents the chromosomes, which are bind one to one according to the size of the
87
chromosome [6].
88
3.4 Interactive Protein Sequence Visualization (i-PV)
89
Interactive Protein Sequence Visualization (i-PV) is an interactive application to visualize for
90
circular visualization of genomes in high throughput sequencing [7]. Automation in checking errors
91
and duplicates and matched against input file is implemented in J-circos [6]. i-PV provides
92
information about sequence conservation, amino acid properties and mutational profiles [7]. i-PV
93
assists users interactively in feature extraction with tracking and extraction functions and final output
94
is available as an interactive output HTML window open automatically [7].
95
3.5 CircosVCF
96
CircosVCF has an interactive GUI that provides variation information of the genomic using
97
genetic variant data generated from variant call format (vcf) as depicted in Figure 3 [8].
98
99
Figure 3. Genetic variant visualization on circus plot using circosVCF [8]. All genetic variants of
100
human chromosome 21 were visualized based on the familial whole genome data from Corpas et
101
al.[9], Which included data from a couple and their two children. The region between 14 Mb to 25
102
Mb of the chromosome was zoomed.
103
104
105
It identifies the SNPs regions as well as calculates the SNPs density in genomic location. In
106
identified SNPs CircosVCF display circular map where the first line represents location of variations
(CNVs, SNPs/Indel) and represented by coloured band based on the homozygosity of the reference
108
genotype while the later calculates the amount of variation present within a defined length of
109
genomic sequence. The darker color on the circos plot represents denser regions based on its
110
genotype where yellow represents the homozygosity to the parent genome, red stands for the
111
homozygosity to the alternative genome, and blue represents heterozygosity [8].
112
3.6 Circular Interactive Layout Converter Free Services (clicO FS)
113
ClicO FS is implemented in Ruby program is a user-friendly web-based service, that allows
114
users to generate a circular ring of genomic data easily [10]. Unlike circos, clicO FS required two input
115
files, namely karyotype file that defines the axes of chromosomes, and data file. There are benefits for
116
the registered users as they can work and store multiple projects in ClicO FS [10]. Currently,
117
Improvised version of ClicO FS supports plugin-based some specific feature such as applying BLAST
118
to comparative genomics data, genetic linkage map data and transcriptome analysis data and
119
generation of circus-like images [10].
120
3.7 BioCircos.js
121
BioCircos.js is a flexible and powerful web-based application for the circular visualization. It
122
is implemented on JavaScript is running at the backend of the application. Biocircos.js generates high
123
graphics quality based on D3 (Data-Driven-Documents). This tool provides output of several types
124
like covering mutational hotspots (CNVs, Indel and SNPs), outputs in several formats like heatmap,
125
scatter, and histogram) and depicting several patterns like expression and interactions [11].
126
3.8 Circular Genome Viewer (CGView)
127
Circular Genome Viewer (CGView) is a comparative genomics server for circular visualization
128
[12]. It is based on the perl program and heavily added by BLAST-based homology searches. The
129
input genomic sequence file, its BLAST results and GFF files are processed by another perl program
130
using user-defined criteria. It generates an XML file for the CGView map-drawing program and
131
genetic features are mapped into different colors [12]. The maps generated by the CGView Server
132
consist of concentric feature rings as shown in Figure 4. These rings are used to display gene
133
information read from the primary sequence file, features or analysis results from the GFF files, base
134
composition plots, ORFs, start and stop codons, and BLAST results. CGView colors features
135
according to genetic information types, and in some cases the height of the feature is adjusted to
136
reflect their properties [12].
139
Figure 4. GCview generates images showing the genomic regions that contain the genes of interest.
140
A)The same map rendered at an expanded size and centered on a region of interest, B) A CGView
141
map of the Escherichia coli genome, with genes marked as arrows along with GC content.
3.9 GenomeDiagram
145
GenomeDiagram is a python-based application for the visualization and comparative
146
analysis of large-scale genomic sequence [13]. This application creates a series of concentric rings of
147
genomic information and these rings possesses genomic features or graphs about the genomic
148
fragments/locations from the reference genome. This application provides different genomic features
149
in different colors to visualization and it uses scalable vector for creating graphs of different types
150
[13]. From this SVG file, the GenomeDiagram can convert images to either a static or stream image
151
[13].
152
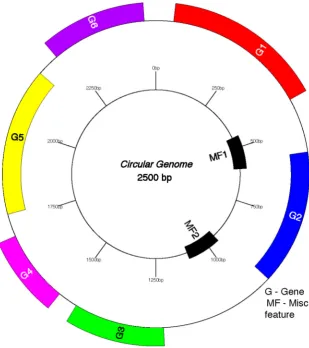
3.10 GenomeVx
153
GenomeVx, a web-based tool implemented in C++ program and the user can itself make
154
changes in circular maps, high-quality graphics for publication, mapping of mitochondrial and
155
chloroplast genomes and of large plasmids as given in Figure 5.
156
157
Figure 5. Visualization of different genes by GenomeVX. Genes are colored in groups based on the
158
first two letters of the gene name. A user specified number of evenly spaced scale indices is produced
159
after rounding the genome size to the nearest two digits (thus, the distance between the last label and
160
0 kb may be greater than between the other markers). GenomeVx can orient the map either
161
anticlockwise from 3 O’clock (the convention for chloroplast genomes) or clockwise from 12 O’clock
162
(the convention for mitochondrial genomes).
The user can import flat file of GeneBank and generate output in PDF format. After
165
uploading input file, it generates the list of editable functions, so that users can use the options for
166
editing/changes according to their need. GenomeVx is the simplest tool for the generation genomic
167
visualization without resorting to ad-hoc solutions. It can easily access without the installation of
168
location software [14].
169
3.11 DNAPlotter
170
DNAPlotter is a Java based standalone application, with an interactive interface with
171
customized features and module, changes can occur immediately to the circular visualized figure
172
[15]. Several types of data formats can be read by the DNAPlotter aided by the Artemis library [15].
173
It shows GC contents in the input file by counting the number of GC content and calculates GC screw
174
[(G − C)/(G + C)] value in the form of linear graphs. Genomic sequence use as an input to DNAPlotter
175
and in resultant it shows comparative analysis [15].
176
3.12 RCircos
177
RCircos is a flexible Circos-based R-library [16], which generates circular genomic structures
178
with providing several information such as such as chromosomal name and genomic locations [16].
179
Graphical implementation of RCircos is based on tracking 2D-plot using standard R-plot
180
functionality [16].
181
3.13 Circlize
182
Circlize is R-based implementation for generating simplified circular map of genomic data.
183
This is enhanced version of circos visualization use basic graphics of constructing circular map like
184
lines, points. This tool can be easily customized to new types of graphics. Apart from that, data
185
construction or visualization has coherent correlation [17].
186
3.14 Circleator
187
Circleator visualization tool implemented in standalone Perl application and produce
188
different figure format for publication and ready circular figures of genomics data. Circleator is
189
highly configured and incorporated into CloVR. It includes predefined composition files and an
190
implementation of the library for well-defined circular visualization that allows creating complex
191
figures without any expertise in programming. Bioperl supported file format that includes GenBank
192
sequence alignment/map and BGZF-compressed (SAM/BAM) alignment files. The generated output
193
consists of genomic variations, gene expression in tab-delimited data and is scored on the basis of
e-194
value [18].
195
3.15 OmicCircos
196
OmicCircos is a comprehensive and highly useful bioconductor package for circular genomic
197
data visualization and it produces output of high-quality figures and statistical overviews from wide
198
arrays of data types [19]. OmicCircos generates output of several genomic features, which include
199
point and copy number mutations, expression data, and DNA-methylation patterns [19]. OmicCircos
200
has three main functions as segAnglePo, circos and simcircos, for generation of genomic segmental
201
information, circular graphics and simulation data, respectively [19]. OmicCircos is a user-friendly
202
package with options for track drawing and zooming in and out [19].
3.16 CIRCUS
204
CIRCUS is a biocondutor package, which is used to analyze genomic sequence for structural
205
variations in high throughput sequencing [20]. The CIRCUS output contains several types of rings
206
for dedicated for chromosomal numbers, genomic fragment information, genomic annotations, read
207
coverage and mutational profiles [20].
208
3.17 SOFIA
209
Recently developed tool called SOFIA is a highly flexible in analysis and representations of
210
data generated in different types of studies like linkage mapping, quantitative trait loci (QTL)
211
mapping, association studies, and comparative genomics. This tool can generate different types
high-212
resolution plots [21], which are suitable for publication. This tool runs on Perl native-circos in the R
213
environment. Additionally SOFIA is user-friendly and it only needs basic understanding of
214
programming [21].
215
3.18 BLAST Ring Image Generator (BRIG)
216
BLAST-Ring Image Generator (BRIG) is a creates circular data using the BLAST-based
217
alignment process [22]. BRIG computes output using BLAST-based homology detection of the
218
genome of prokaryotes with other published genomes and the simulated draft genomes [22]. The
219
BLAST score matches coloured concentric rings by indicating a defined percentage identity in
220
sequence comparison. BRIG also generates genome assembly information such as read coverage,
221
assembly breakpoints and collapsed repeats In mapping process of sequencing technique,
222
unassembled sequencing reads against more than one parent reference genome which increases ist
223
versatility. BRIG is useful tool, which is easy to learn and use [22].
224
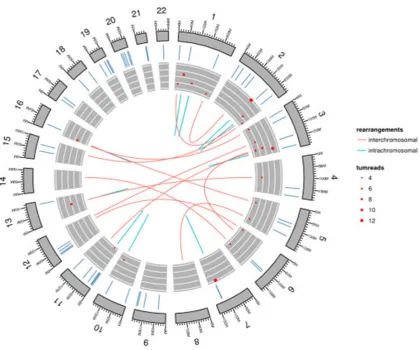
3.19 ggbio
225
ggbio is extension of the grammar of graphics approach used by ggplot2
226
(https://ggplot2.tidyverse.org). It is based on bioconductor library for genomic plots of high
227
throughput sequencing data as given in Figure 6. It can generate genomic maps in various formats
228
including circular version. In output, it generates detailed description of genomic location
229
information followed by genomic variations [23].
232
Figure 6. Chromosomal visualization by ggbio. This circular map shows chromosomal segments,
233
which indicates somatic mutations. It also visualizes intermolecular and intramolecular interactions
234
rearrangements.
235
236
3.20 Circos for Genomics and Transcriptomics Data Visualization (CGDV)
237
Circos-based CGDV is a webtool, which is capable of automatic and seamless circular
238
visualization of various large sequencing data including genomics and transcriptomics [24]. CGDV
239
takes inputs as several types of genomic data formats and plots circular results [24]. All intermediate
240
files for generating circos are handled by CGDV in automatically.
241
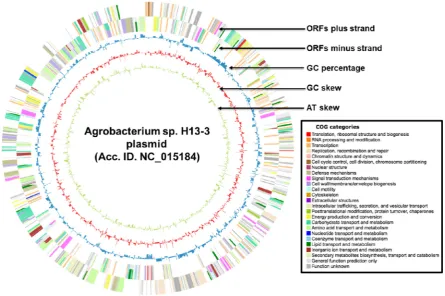
3.21 CiVi
242
CiVi is a simple to use web service tool for generation of circular graph to analyze microbial
243
genomes and annotations of sequence [25]. The generated output comprises of several observational
244
features such as gene name, COG class, PFAM domain, GC content, and subcellular localization can
245
be comprehensively viewed [25]. CiVi depicts several genomic results focusing on three major types
246
as (i) genome-wide distribution (ii) provided experimental data, and (iii) the local orientation and
247
location with respect to neighboring genes as given in Figure 7. CiVi is a highly useful tool for
248
publication-ready images with minimal training for beginners [25].
251
Figure 7. CiVi based circular map of Agrobacterium sp. H13-3 plasmid. There are five rings in
252
generated, which indicates ORFs plus strand (outermost ring), ORFs minus strand, GC content,
253
GC skew, AT skew (innermost ring).
254
3.22 GeneWiz
255
GeneWiz is an interactive web-based genomic application for circular depiction of genomic
256
data using genomic alignments of homologous segments [26]. Furthermore, it can easily calculate
257
phenotypic features of DNA such as curvature or stacking energy along the chromosome. GeneWiz
258
is user-friendly application with providing users to select various genomic data, ranges and features
259
and also options to change color and zooming settings [26].
260
3.23 Circster
261
Circster is a web-based interactive Circos-style genome visualizer [27]. It is user-friendly,
262
GUI based and requires no programming language skills[27]. It is developed by Galaxy-team and it
263
implemented into Galaxy genomics workbench (http://galaxyproject.org). Hence, it is able to use
264
Galaxy framework and its features in visualization process.
265
3.24 myCircos.js
266
myCircos is a web-based application written in perl for visualization or generation of circos
267
plots and only formatted data files are required as an input. Mycircos have many features of database,
268
which is repository of previously generated plots and generates into interactive SVG format.
4. Discussion
271
All in all, we have described here genomic visualization tools for both prokaryotic genomes as well
272
as eukaryotic genomes. In the last 15 years, we have seen revolutionary changes in genomic
273
generation with advancement in genomic technologies- This has led into rapid development of
274
circular visualizations tools with average 1-2 new tools per year developed for this purpose. This
275
review provided a comprehensive summary of these tools and it will be useful for others to choose
276
circular visualization tools for their purposes. These genomic visualization tools a biologist with
277
various genomic information, necessary for inferring conclusions related with genetics, molecular
278
biology and biotechnology.
279
280
Author Contributions: conceptualization, A.K.; writing—original draft preparation, A.P., A.K. and S.K.;
281
writing—review and editing, A.P., A.K. and S.K; visualization, A.P., A.K.; supervision, A.K. and S.K.
282
Funding: This research received no external funding.
283
Acknowledgments: In this section you can acknowledge any support given which is not covered by the author
284
contribution or funding sections. This may include administrative and technical support, or donations in kind
285
(e.g., materials used for experiments).
286
Conflicts of Interest: The authors declare no conflict of interest.
287
References
288
1. Koboldt, D.C.; Steinberg, K.M.; Larson, D.E.; Wilson, R.K.; Mardis, E.R. The next-generation sequencing
289
revolution and its impact on genomics. Cell 2013, 155, 27-38, doi:10.1016/j.cell.2013.09.006.
290
2. Dark, M.J. Whole-genome sequencing in bacteriology: state of the art. Infect Drug Resist 2013, 6, 115-123,
291
doi:10.2147/IDR.S35710.
292
3. Stothard, P.; Grant, J.R.; Van Domselaar, G. Visualizing and comparing circular genomes using the CGView
293
family of tools. Brief Bioinform 2017, 10.1093/bib/bbx081, doi:10.1093/bib/bbx081.
294
4. Darzentas, N. Circoletto: visualizing sequence similarity with Circos. Bioinformatics 2010, 26, 2620-2621,
295
doi:10.1093/bioinformatics/btq484.
296
5. Krzywinski, M.; Schein, J.; Birol, I.; Connors, J.; Gascoyne, R.; Horsman, D.; Jones, S.J.; Marra, M.A. Circos:
297
an information aesthetic for comparative genomics. Genome Res 2009, 19, 1639-1645, doi:10.1101/gr.092759.109.
298
6. An, J.; Lai, J.; Sajjanhar, A.; Batra, J.; Wang, C.; Nelson, C.C. J-Circos: an interactive Circos plotter.
299
Bioinformatics 2015, 31, 1463-1465, doi:10.1093/bioinformatics/btu842.
300
7. Tanyalcin, I.; Al Assaf, C.; Gheldof, A.; Stouffs, K.; Lissens, W.; Jansen, A.C. I-PV: a CIRCOS module for
301
interactive protein sequence visualization. Bioinformatics 2016, 32, 447-449, doi:10.1093/bioinformatics/btv579.
302
8. Drori, E.; Levy, D.; Smirin-Yosef, P.; Rahimi, O.; Salmon-Divon, M. CircosVCF: circos visualization of
303
whole-genome sequence variations stored in VCF files. Bioinformatics 2017, 33, 1392-1393,
304
doi:10.1093/bioinformatics/btw834.
305
9. Corpas, M.; Valdivia-Granda, W.; Torres, N.; Greshake, B.; Coletta, A.; Knaus, A.; Harrison, A.P.; Cariaso,
306
M.; Moran, F.; Nielsen, F., et al. Crowdsourced direct-to-consumer genomic analysis of a family quartet. BMC
307
Genomics 2015, 16, 910, doi:10.1186/s12864-015-1973-7.
308
10. Cheong, W.H.; Tan, Y.C.; Yap, S.J.; Ng, K.P. ClicO FS: an interactive web-based service of Circos.
309
Bioinformatics 2015, 31, 3685-3687, doi:10.1093/bioinformatics/btv433.
310
11. Cui, Y.; Chen, X.; Luo, H.; Fan, Z.; Luo, J.; He, S.; Yue, H.; Zhang, P.; Chen, R. BioCircos.js: an interactive
311
Circos JavaScript library for biological data visualization on web applications. Bioinformatics 2016, 32, 1740-1742,
312
12. Grin, I.; Linke, D. GCView: the genomic context viewer for protein homology searches. Nucleic Acids Res
314
2011, 39, W353-356, doi:10.1093/nar/gkr364.
315
13. Pritchard, L.; White, J.A.; Birch, P.R.; Toth, I.K. GenomeDiagram: a python package for the visualization of
316
large-scale genomic data. Bioinformatics 2006, 22, 616-617, doi:10.1093/bioinformatics/btk021.
317
14. Conant, G.C.; Wolfe, K.H. GenomeVx: simple web-based creation of editable circular chromosome maps.
318
Bioinformatics 2008, 24, 861-862, doi:10.1093/bioinformatics/btm598.
319
15. Carver, T.; Thomson, N.; Bleasby, A.; Berriman, M.; Parkhill, J. DNAPlotter: circular and linear interactive
320
genome visualization. Bioinformatics 2009, 25, 119-120, doi:10.1093/bioinformatics/btn578.
321
16. Zhang, H.; Meltzer, P.; Davis, S. RCircos: an R package for Circos 2D track plots. BMC Bioinformatics 2013,
322
14, 244, doi:10.1186/1471-2105-14-244.
323
17. Gu, Z.; Gu, L.; Eils, R.; Schlesner, M.; Brors, B. circlize Implements and enhances circular visualization in
324
R. Bioinformatics 2014, 30, 2811-2812, doi:10.1093/bioinformatics/btu393.
325
18. Crabtree, J.; Agrawal, S.; Mahurkar, A.; Myers, G.S.; Rasko, D.A.; White, O. Circleator: flexible circular
326
visualization of genome-associated data with BioPerl and SVG. Bioinformatics 2014, 30, 3125-3127,
327
doi:10.1093/bioinformatics/btu505.
328
19. Hu, Y.; Yan, C.; Hsu, C.H.; Chen, Q.R.; Niu, K.; Komatsoulis, G.A.; Meerzaman, D. OmicCircos: A
Simple-329
to-Use R Package for the Circular Visualization of Multidimensional Omics Data. Cancer Inform 2014, 13, 13-20,
330
doi:10.4137/CIN.S13495.
331
20. Naquin, D.; d'Aubenton-Carafa, Y.; Thermes, C.; Silvain, M. CIRCUS: a package for Circos display of
332
structural genome variations from paired-end and mate-pair sequencing data. BMC Bioinformatics 2014, 15, 198,
333
doi:10.1186/1471-2105-15-198.
334
21. Diaz-Garcia, L.; Covarrubias-Pazaran, G.; Schlautman, B.; Zalapa, J. SOFIA: An R Package for Enhancing
335
Genetic Visualization With Circos. Journal of Heredity 2017, 108, 443-448.
336
22. Alikhan, N.F.; Petty, N.K.; Ben Zakour, N.L.; Beatson, S.A. BLAST Ring Image Generator (BRIG): simple
337
prokaryote genome comparisons. BMC Genomics 2011, 12, 402, doi:10.1186/1471-2164-12-402.
338
23. Yin, T.; Cook, D.; Lawrence, M. ggbio: an R package for extending the grammar of graphics for genomic
339
data. Genome Biol 2012, 13, R77, doi:10.1186/gb-2012-13-8-r77.
340
24. Jha, V.; Singh, G.; Kumar, S.; Sonawane, A.; Jere, A.; Anamika, K. CGDV: a webtool for circular visualization
341
of genomics and transcriptomics data. BMC Genomics 2017, 18, 823, doi:10.1186/s12864-017-4169-5.
342
25. Overmars, L.; van Hijum, S.A.; Siezen, R.J.; Francke, C. CiVi: circular genome visualization with unique
343
features to analyze sequence elements. Bioinformatics 2015, 31, 2867-2869, doi:10.1093/bioinformatics/btv249.
344
26. Hallin, P.F.; Staerfeldt, H.H.; Rotenberg, E.; Binnewies, T.T.; Benham, C.J.; Ussery, D.W. GeneWiz browser:
345
An Interactive Tool for Visualizing Sequenced Chromosomes. Stand Genomic Sci 2009, 1, 204-215,
346
doi:10.4056/sigs.28177.
347
27. Goecks, J.; Eberhard, C.; Too, T.; Galaxy, T.; Nekrutenko, A.; Taylor, J. Web-based visual analysis for
high-348
throughput genomics. BMC Genomics 2013, 14, 397, doi:10.1186/1471-2164-14-397.
349
28. Grant, J.R.; Stothard, P. The CGView Server: a comparative genomics tool for circular genomes. Nucleic
350
Acids Res 2008, 36, W181-184, doi:10.1093/nar/gkn179.
351
29. Petkau, A.; Stuart-Edwards, M.; Stothard, P.; Van Domselaar, G. Interactive microbial genome visualization
352
with GView. Bioinformatics 2010, 26, 3125-3126, doi:10.1093/bioinformatics/btq588.
353
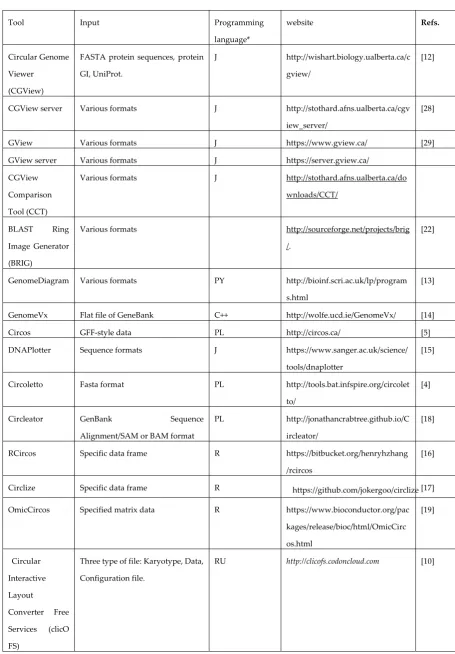
Table 1. Summary of bioinformatics tools for circular visualization of genomic
356
data.
357
Tool Input Programming
language*
website Refs.
Circular Genome Viewer
(CGView)
FASTA protein sequences, protein GI, UniProt.
J http://wishart.biology.ualberta.ca/c gview/
[12]
CGView server Various formats J http://stothard.afns.ualberta.ca/cgv iew_server/
[28]
GView Various formats J https://www.gview.ca/ [29]
GView server Various formats J https://server.gview.ca/ CGView
Comparison Tool (CCT)
Various formats J http://stothard.afns.ualberta.ca/do wnloads/CCT/
BLAST Ring Image Generator (BRIG)
Various formats http://sourceforge.net/projects/brig /.
[22]
GenomeDiagram Various formats PY http://bioinf.scri.ac.uk/lp/program s.html
[13]
GenomeVx Flat file of GeneBank C++ http://wolfe.ucd.ie/GenomeVx/ [14]
Circos GFF-style data PL http://circos.ca/ [5]
DNAPlotter Sequence formats J https://www.sanger.ac.uk/science/ tools/dnaplotter
[15]
Circoletto Fasta format PL http://tools.bat.infspire.org/circolet to/
[4]
Circleator GenBank Sequence
Alignment/SAM or BAM format
PL http://jonathancrabtree.github.io/C ircleator/
[18]
RCircos Specific data frame R https://bitbucket.org/henryhzhang /rcircos
[16]
Circlize Specific data frame R https://github.com/jokergoo/circlize [17]
OmicCircos Specified matrix data R https://www.bioconductor.org/pac kages/release/bioc/html/OmicCirc os.html
[19]
Circular Interactive Layout
Converter Free Services (clicO FS)
Three type of file: Karyotype, Data, Configuration file.
358
*Programming Language: J – Java; JS – Javascript; PL – Perl; PY – Python; R – R-programming
359
language; RU – Ruby, WT - Webtool
360
CIRCUS SAM, BAM, Annotation, CNV and, variant files.
R -- [20]
CircosVCF VCF file WT http://www.ariel.ac.il/research/fbl/ software
[8]
J-Circos Flat file format JS https://sourceforge.net/projects/jcir cos/
BioCircos.js Various formats JS http://bioinfo.ibp.ac.cn/biocircos/ [11] Interactive
Protein Sequence Visualization (I-PV)
Protein sequence, conservation and SNV data
PL http://i-pv.org/ [7]
SOFIA Various formats R https://cggl.horticulture.wisc.edu/ [21] Circos for
Genomics and Transcriptomics Data
Visualization (CGDV)
Various formats WT
https://cgdv-upload.persistent.co.in/cgdv/
[24]
CiVi Various formats PY, JS http://www.cbs.dtu.dk/services/g wBrowser
![Figure 2. Visualization of whole genome by using Circos [5]. Data taken from the ICGC, specifically](https://thumb-us.123doks.com/thumbv2/123dok_us/7985399.1324892/3.595.88.479.262.598/figure-visualization-genome-using-circos-data-taken-specifically.webp)
![Figure 3. Genetic variant visualization on circus plot using circosVCF [8]. All genetic variants of human chromosome 21 were visualized based on the familial whole genome data from Corpas et al.[9], Which included data from a couple and their two children](https://thumb-us.123doks.com/thumbv2/123dok_us/7985399.1324892/4.595.77.514.378.642/genetic-visualization-circosvcf-variants-chromosome-visualized-familial-included.webp)