2764
Qualitative and Quantitative Methods for Determination
of Drug Luliconazole
Manish Kumar*, Nithya Shanthi, Arun Kumar Mahato
Department of Pharmaceutical Sciences, Sardar Bhagwan Singh Post Graduate Institute of Biomedical Science and Research, Balawala, Dehradun, Uttarakhand (India)
Abstract- Present paper involve development of qualitative and quantitative methods for luliconazole (LNZ),
recently approved by the FDA (2013) for treatment of fungal infections. Qualitative methods involved determination of melting point, absorption maxima, Fourier-transform infrared spectroscopy (FTIR), Powder X-Ray Diffraction, simultaneous thermal analysis, solubility and lipophilicity. UV-Visible spectrophotometric and HPLC as quantitative method were developed and validated. Melting point and absorption maxima for luliconazole were 149℃ and 296nm respectively. Various characteristics peaks and patterns obtained with FTIR and Powder X-Ray Diffraction analysis were specific to luliconazole structure. Drug revealed low aqueous solubility 0.0034±0.000067mg/ml and high permeability 3.35 thus considered as Class II drug of Biopharmaceutical Classification System. UV method was developed using methanol: water (1:1) as solvent where precision, accuracy, Limit of Detection (LOD) and Limit of Quantification (LOQ) for luliconazole were 0.61, 99.86%-101.37%, 0.234 and 0.709 respectively. Development of HPLC method was done by use of C-18 column using methanol as mobile phase and detection was made at 296 nm. HPLC Retention time was obtained as 2.22±0.042min. Precision, accuracy, LOD and LOQ for luliconazole with HPLC were found to be 0.094-0.523, 99.97-105%, 0.207 and 0.629 respectively. The procedures were validated as per ICH guidelines and were simple, easy and economic.
Keywords: Melting Point, Absorption Maxima, Fourier-Transform Infrared Spectroscopy, Powder X-Ray
Diffraction, Simultaneous Thermal Analysis, UV- Visible Spectrophotometric Method and HPLC Method.
1. INTRODUCTION
[image:1.595.309.530.446.773.2]Luliconazole, a topical broad-spectrum imidazole antifungal drug belonging to dichlorobenzene class of organic compounds is an optically active R-enantiomer. It was approved in November 2013 by FDA for the treatment of fungal infections caused by Trichophyton rubrum and Epidermophyton floccosum, specifically tinea pedis, cruris, and corporis, reported to be safe and well tolerable by human subjects [1, 2]. It is poorly water-soluble drug with high permeability. It is low toxic well tolerable, being both fungistatic and fungicidal with minimum inhibitor concentration, MIC 0.004– 0.008μg/ml for most of the dermatophytes [1, 3]. The mechanism of action of LNZ involves Cytochrome P450 2C19 Inhibition [4]. LNZ found to inhibit the enzyme Lanosterol demethylase required for the synthesis of Ergosterol, a major component of the fungus cell membranes [5]. A maximum plasma concentration of 0.40±0.76 ng/mL in 16.9±9.39 hours was obtained after the first dose of LNZ administered topically in patients with tinea pedis. Physicochemical properties of drug was as enlisted in Table 1.
Table 1. Physicochemical properties Molecular
Formula
[6]
Molecular Weight
354.267 ⁄ [6]
Category Topical azole antifungal [6] IUPAC
Name
2-[(2E,4R)-4-(2,4- dichlorophenyl)-1,3-dithiolan-2- ylidene]-2-(1H-imidazole-1-yl)acetonitrile [5]
Appearance Light yellow to yellow solid [7]
(strongest basic)
6.34
4.27 [5]
Solubility Water 0.0659 ⁄ [5], Methanol [7]
DMSO 50 ⁄ [8], soluble in acetonitrile, DMSO [7].
Melting Point 149℃ [9]
Half-Life Mean plasma half-life was 21.1 or 32.4 hours on day 15 of once-daily topical application of 1% cream in adults with tinea cruris or tinea pedis respectively [10].
2765 Tinea cruris or tinea corporis:
Apply to affected area and ~1inch of the immediate surrounding area once daily for a week, each gram containing 10mg of LNZ [10].
At present, none well stabilized qualitative and quantitative methods for LNZ were available till now. Development of methods would play a vital role in conduction of Preformulation and characterization study proving beneficial to researchers and small laboratories. Further developed quantitative method would help in determination of amount of drug in developed and marketed dosage forms with ease.
2. MATERIALS AND METHOD
2.1 Materials
LNZ was obtained as a gift sample from Virupaksh Organics Ltd., Telangana, India; UV-Visible Double Beam Spectrophotometer (Shimadzu 1800); HPLC System (Waters 2489); HPLC Grade Water and Methanol purchased from Himedia, India.
2.2 Qualitative Method
2.2.1 Determination of Melting Point: The drug was filled in one end open capillary tube and temperature to which drug starts melting was recorded with the help of Perfit Digital Melting Point Apparatus.
2.2.2 Determination of Absorption Maxima: 100mg of LNZ sample was weighed and transferred to 100ml volumetric flask and diluted up to the mark with methanol (1000μg/ml). 10ml of the above solution was pipetted out in a 10ml volumetric flask and diluted up to the mark. From this 1.5ml of the solution was pipetted out and transferred into a 10ml volumetric flask and diluted up to the mark with methanol to form 15μg/ml that was scanned in the range of 200-400nm using UV-visible Double Beam Spectrophotometer (Shimadzu 1800) [11].
2.2.3 FTIR Spectroscopy: FTIR analysis for LNZ was done by FTIR NICOLET 6700. Each sample was mixed with potassium bromide in 1:100 and compressed to form pellets later observed at the range from 4000to 400cm-1.
2.2.4 Powder X-Ray Diffraction (PXRD): PXRD analysis was performed by using D8 Advanced Diffractrometer, (Bruker AXS D8 Advance, Serial
No-D8-03/202035 D76181 Karlsruhe, Germany, USA). The PXRD estimation of drug was done at scanning rate of 2℃/min over a 2 range of 5-40℃.
2.2.5 Differential Scanning Calorimetry (DSC): DSC was performed using instrument EXSTAR TG/DTA 6300. In DSC analysis 10 mg of sample was placed in an aluminium pan and examined at scanning rate of 10℃/min at temperature range of 0 to 800℃ in an inert atmosphere maintained with nitrogen.
2.2.6 Determination of Aqueous Solubility: Saturation shake-flask method was used which involve agitation of excess amount of sample in distilled water at 50rpm and 37℃ for 24-72 h followed by phase separation of saturated solution from undissolved solute. [12]
2.2.7 Determination of Lipophilicity: The traditional shake flask method was used for determination of lipophilicity. Drug was placed into a flask and measured volumes of octanol and aqueous buffer were added. The flask was agitated for 24-72 h to achieve equilibrium. The solution was transferred to a separating funnel and left aside for half hour to separate the two phases. The test compound in each phase was sampled and quantitated using UV spectroscopy. The ratio of obtained concentration in octanol phase to the concentration in the buffer phase was determined and the log10 of the ratio was calculated [13].
2.2.8 Determination of Retention time in HPLC Column: The column was first equilibrated for about 30min with HPLC Methanol. Retention time of peak was determined by injecting 20l of the reference drug solution and determining time required to cover the distance along the baseline between the point of injection and perpendicular dropped from the maximum of the peak of interest [14].
2.3 Quantitative Method
2.3.1 UV Spectrophotometric Method
Preparation of Standard Stock Solution: Standard
2766
Preparation of Working Solutions: A series of
concentrations ranging from 4-18g/ml. was prepared by pipetting out 0.4, 0.6, 0.8, 1, 1.2, 1.4, 1.6 and 1.8ml of standard working stock solution to different 10ml volumetric flasks. 1:1 methanol: water was added upto the mark to give 4-18g/ml working solutions of LNZ.
Determination of Absorption Maxima for LNZ in
Distilled Water and Methanol (1:1): The
wavelength of maximum absorbance, max for
LNZ in distilled water and methanol (1:1) was determined with the help of UV-Visible Spectrophotometer. Prepared solution of concentration 15μg/ml was scanned in the range of 200-400nm.
Preparation of Standard Plot in Distilled Water
and Methanol (1:1):Observed absorption maxima,
max 299nm was used for further analysis of
absorption for concentration ranging from 4 to 18μg/ml. The linear plot was constructed and correlation coefficient (r2) value was determined. The results were plotted with the help of error bars (Mean±SD).
2.3.2 HPLC based Method
Preparation of Standard Stock Solution: 10mg of
accurately weighed LNZ was transferred to a 10ml volumetric flask and 1:1 Methanol: Water (HPLC grade) was added upto the mark to form 1000g/ml solution. 1ml of 1000g/ml stock solution was transferred to a 10ml volumetric flask and volume was adjusted upto the mark using HPLC grade methanol to give 100g/ml solution as standard working solution.
Preparation of Working Solutions: Concentrations
ranging from 2-12g/ml was prepared from standard stock solution of LNZ in 1:1 Methanol: Water (HPLC grade). 0.2, 0.4, 0.6, 0.8, 1 and 1.2ml of standard working stock solution was pipetted out to different 10ml volumetric flasks and HPLC grade methanol was added forming 2-12g/ml working solutions of LNZ.
Preparation of Standard Plot: Different working
solutions of LNZ were injected and area under curve was determined using Gemini Su C-18 column (1504.60mm 5micron) and HPLC grade methanol as mobile phase. Observation was made at 296nm using UV detector. Area under curve on y axis versus concentration on x axis was plotted to obtain linear plot.
2.3.3 Determination of Accuracy, Precision, LOD and LOQ for UV and HPLC Methods.
Accuracy: Accuracy reflects the closeness of
agreement between the value found and value expected or true value. Accuracy was measured by determination of three different known concentrations estimated using regression line equation. Determination of each concentration was made in triplicate [16].
Precision: Closeness of observations between a
series of measurement of a sample under same conditions was determined at inter-day to verify the repeatability and reproducibility.
Limit of Detection and Limit of Quantification: In
present study an approach described by ICH guidelines was used for determination of LOD and LOQ. LOD and LOQ were calculated by employing the 3.3 × (SD/Slope) and 10 × (SD/Slope) criteria respectively where SD and S were the standard deviation of y-intercept of regression line and the slope of the calibration curve respectively [15].
Statistical Analysis: All the results were analyzed
statistically using Graph pad prism Version 6.05. The results were indicated in Mean (*n=3) with Standard Deviation (SD).
3 RESULTS
3.1 Qualitative Methods
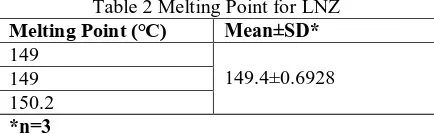
[image:3.595.311.528.621.688.2]3.1.1 Determination of Melting Point: Melting point determination, an elementary test to identify the obtained drug was determined by the capillary method and was found to be 149℃ (Table 2). The observed value was identical to the reported value i.e. 149℃ as reported byMasuda, T., Pola Pharma Inc. and Nihon Nohyaku Co. Ltd., 2015 [9]. The observed melting point confirmed the drug as LNZ.
Table 2 Melting Point for LNZ
Melting Point (℃) Mean±SD*
149
149.4±0.6928 149
150.2
*n=3
2767 wavelength of maximum absorbance acts as
a characteristic value for a compound. Observed value for the obtained sample of pure LNZ was 296nm found to be identical to the reported value by Desai and Maheshwari, 2014 that confirmed the obtained sample as LNZ [11].
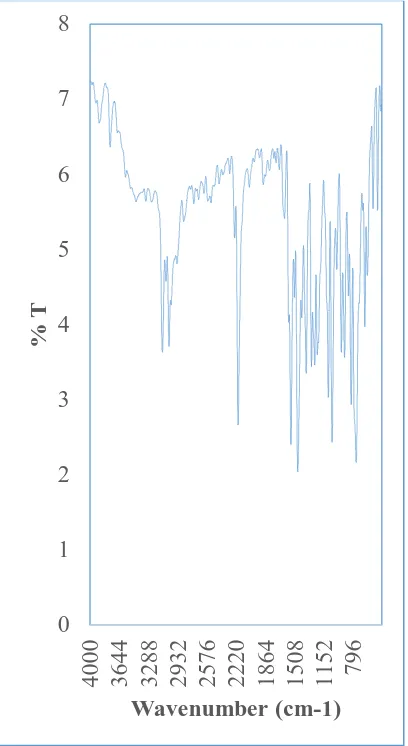
[image:4.595.310.530.97.462.2]3.1.3 FTIR Spectroscopy: FTIR Spectrum of LNZ was obtained by scanning the drug in the range of 4000 to 400 . Major peaks observed were as 3039.39, 3076 & 3119cm-1 (Aromatic C-H Stretch), 2941 (C-H aliphatic stretch), 2527 & 2614cm-1 (S-H Stretch), 2199.08 (C N Stretch), 1698cm-1, 1737, 1816, 1892 (C=C Alkene Stretch), 1634cm-1 (C=N Stretch), 1555.96cm-1 (C=C Aromatic Stretch) and 761 & 1100cm-1 (C-Cl Stretch) whose presence resembled the structure of LNZ (Fig 1). Observed FTIR spectra and standard value were as depicted in Fig. 3 and Table 3. The observed value were within the range or very close to the characteristic peaks of standard value confirming drug as LNZ.
[image:4.595.310.530.105.467.2] [image:4.595.75.279.366.739.2]Fig 1 FTIR Spectra for LNZ
Table 3 FTIR Data for LNZ
Type of
Vibration
Wave Number cm-1 Inference
Standard Observ
ed
C-H Aromatic stretch
3000-3100 3039, 3119, 3076
Present
C-H aliphatic stretch
2840-2950 2941 Present
S-H Stretch
2550-2600 2527, 2614
Presence of S group C N
Stretch
2100-2400 2199 Presence of C N group C=C
alkene stretch
1650-2000 1698, 1737, 1816, 1892
Presence of aromatic Ring
C=N- stretch
1600-1700 1634 Present
C=C aromatic stretch
1450-1650 1555, Present
Aromatic C=C For Chloroben zene
1446,1478,1 584
1472, 1582
Presence of Chlorobenz ene
C-Cl stretch
600-800, 1089-1096
761, 1100
Presence of Chloro group
3.1.4 Powder X Ray Diffraction (PXRD):
X Ray Powder Diffraction was performed using D8 Advance X ray Diffractometer (Bruker). PXRD testing was done to determine crystalline state of drug. Coarse LNZ showed characteristics peak at 2= 15.6857, 17.5783, 20.665, 21.1058, 22.6466, 23.8135, 25.0052, 26.2619, 27.2455, 29.1017and 42.6894 indicating presence of crystalline nature (Fig 2). Diffraction peak at 2= 23 in PXRD pattern represents (021) plane due to two chlorine and a nitrogen atom belonging to cyano group present in LNZ structure [18]. The crystal system was found to be monoclinic determined using PANalytical Software, V1.1 where crystal system was identical to the observation reported for crystal of LNZ by Masuda, T., Pola Pharma Inc. and Nihon Nohyaku Co. Ltd., 2015 [16].
0
1
2
3
4
5
6
7
8
4000
3644
3288
2932
2576
2220
1864
1508
1152
796
%
T
2768
Fig. 2 X-Ray Diffraction pattern for LNZ
3.1.5 Simultaneous Thermal Analysis: Melting point of 149℃ observed with digital melting point apparatus was confirmed by DSC curve showing a sharp endothermic peak at 149℃, a characteristic peak to LNZ (Fig 3). A sharp endothermic peak was observed due to the purity of procured LNZ. Change in shape might be observed due to presence of an impurity. Degradation was also observed in DSC curve at 589℃. TG curve showed that first stage degradation was initiated at 239℃ which continued upto 324℃ with a loss of 50% of total mass. Second stage degradation was observed between 324℃ and 500℃ (42.37% mass loss). With further increase in temperature beyond 500℃ resulted in total weight loss of 80.25%. From DTG curve, it can be concluded that there would be mass loss at temperature near 277℃. The DTG curve at 277℃ was in accordance with the curves of TG within the temperature range of 239℃-324℃.
Fig 3 DSC, DTG and TG Curve for LNZ
3.1.6 Determination of Solubility:The solubility of pure LNZ was determined using saturation shake-flask method. The solubility of LNZ in aqueous
medium was observed as
0.003435±0.0000678mg/ml which was too low, revealed the poor aqueous solubility behaviour of the drug also described by Kansagra and Mallick, 2015 [17].
3.1.7 Determination of lipophilicity: High permeability plays an important role in the dermal delivery of the drug. log10 P is the logarithmic
value of partition coefficient (P), the ratio of an amount of solute in the organic phase to aqueous phase that helps to determine the lipophilicity of drug. In this research lipophilicity of drug was determined by interpreting the value of log P calculated from partition coefficient. The value for log10 P was obtained as 3.35 close to the reported
value of 4.07 [5]. The result reflected the lipophilic nature of drug and thus LNZ found to have high permeability.
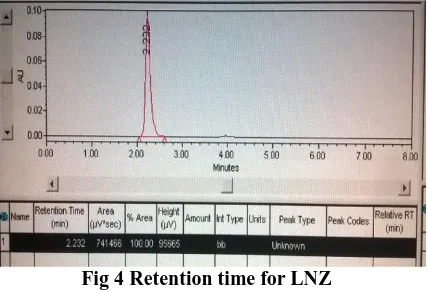
3.1.8 Determination of Retention time in HPLC Column
[image:5.595.316.530.469.616.2]Retention time was determined properly using HPLC (Fig 4). Retention time for LNZ was found to be 2.22±0.042min. This retention point can be used as reference for determination of relative retention of LNZ in a formulation [14].
Fig 4 Retention time for LNZ
3.2 Quantitative Methods
3.2.1 UV Spectrophotometric Method
The wavelength of maximum absorbance, max for
LNZ in distilled water and methanol (1:1) was determined with the help of UV-Visible Spectrophotometer (UV 1800). Prepared solution of concentration 15μg/ml was scanned in the range of 200-400nm. The max observed was 299nm.
Observed absorption maxima, max 299nm was
[image:5.595.76.294.568.733.2]2769 linear plot was obtained and obeyed beers law in
concentration range 4 to 18μg/ml and correlation coefficient (r2) value was found to be 0.9996. The results were plotted with the help of error bars (Mean±SD) as in Fig 5. Precision and accuracy for LNZ was found to be 0.61 and 99.86%-101.37% respectively. LOD and LOQ were 0.234 and 0.709 respectively (Table 4).
C o n c e n t r a t i o n ( µ g / m l )
A
b
s
o
r
b
a
n
c
e
(
M
e
a
n
±
S
D
*
)
0 5 1 0 1 5 2 0
0 .0 0 .5 1 .0 1 .5
Y = 0 .0 5 3 3 5 * X + 0 .0 2 5 3 1
R2= 0 .9 9 9 6
Fig. 5 UV-Visible method based standard Plot for LNZ
Table 4 Summary of validation parameters for UV method
Parameters Results
Linearity and Range 4-18 μg/ml Correlation Coefficient 0.9996
Precision (%RSD) Intraday: 0.610, Interday: 1.77
Accuracy 99.86- 101.37%
LOD 0.234
LOQ 0.709
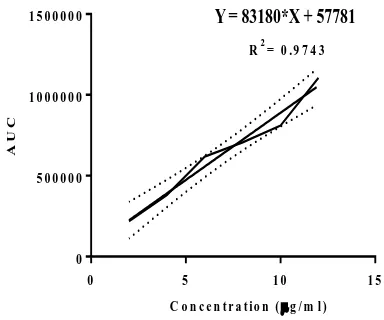
3.2.2 HPLC Method
The study was conducted using HPLC system equipped with 515 HPLC pump and UV-Visible detector (Waters 2489). Absorption maxima, max
296nm was used for determination of AUC for varying concentration of working solutions ranging from 2 to 12g/ml. AUC versus concentration was plotted to obtain standard curve and correlation coefficient (r2) was calculated, found to be 0.9743. The linear equation obtained was y=83180x+57781 where beers law was obeyed in concentration range 2 to 12g/ml (Fig. 6). LOD and LOQ for LNZ was found to be 0.207 and 0.629 respectively. Precision and accuracy were 0.094-0.523 and 99.97-105% respectively (Table 5).
0 5 1 0 1 5
0 5 0 0 0 0 0 1 0 0 0 0 0 0 1 5 0 0 0 0 0
A
U
C
Y = 83180*X + 57781
[image:6.595.322.514.112.272.2]C o n c e n t r a t io n (g / m l ) R2= 0 .9 7 4 3
[image:6.595.71.284.207.376.2]Fig. 6 HPLC method based standard Plot for LNZ
Table 5 Summary of validation parameters for HPLC method
Parameters Results
Linearity and Range 2-12 μg/ml Correlation Coefficient 0.9743
Precision (RSD) Intraday: 0.094-0.523, Interday:1.64
Accuracy 99.97-105%
LOD 0.207
LOQ 0.629
CONCLUSION
From the outcomes of solubility and lipophilicity analysis, it was concluded that the drug belongs to BCS Class II. The drug showed low aqueous solubility and high permeability of 0.003435±0.0000678mg/ml and 3.35 respectively. HPLC retention time specific to drug was 2.22±0.042min which can vary due to presence of impurity and can be used as reference for determination of relative retention time for its analogues or chemically modified entity. Linear equation was obtained with UV and HPLC based methods with LOD and LOQ values. Thus present study demonstrated developed quantitative and qualitative methods which can be used for determination of LNZ in marketed formulations and analysis of procured sample. Developed UV and HPLC method were economic, simple, precise and accurate which can be applied at small laboratories and academics for research work.
REFERENCES
2770 agent. Journal of Infection and Chemotherapy,
2004; 10(4):216-219.
[2] Scher, R. K., Nakamura, N. and Tavakkol, A. Luliconazole: a review of a new antifungal agent for the topical treatment of onychomycosis. Mycoses, 2014; 57(7) 389-393.
[3] Zargaran, M., Taghipour, S., Kiasat, N., Aboualigalehdari, E., Rezaei Matehkolaei, A., Mahmoudabadi, A. Z. and Shamsizadeh, F. Luliconazole, an alternative antifungal agent against Aspergillus terreus. Journal de Mycologie Médicale, 2017; 27(3):351-356. [4] Luliconazole, FDA, Available at
https://www.accessdata.fda.gov/drugsatfda_do cs/label/2013/204153s000lbl.pdf (Accessed at 24 June 2018).
[5] Luliconazole, Accession No. DB08933,
Available at
https://www.drugbank.ca/drugs/DB08933 [Accessed 27 rebmetpeS 2017].
[6] Luliconazole, national center for biotechnology information. PubChem compound database; CID=3003141, https://pubchem.ncbi.nlm.nih.gov/compound/3 003141 (accessed June 24, 2018)
[7] Luliconazole, Available at https://www.alsachim.com/product-C5487-glo.bal-Luliconazole-13C7.html [Accessed 27 rebmetpeS 2017].
[8] Luliconazole, Available at
http://www.chemspider.com/Chemical-Structure.2273807.html [Accessed 27 rebmetpeS 2017].
[9] Masuda, T., Pola Pharma Inc. and Nihon Nohyaku Co. Ltd. Crystal having crystal habits and pharmaceutical composition obtained by processing the crystal. 2015; U.S. Patent 9,199,977B2.
[10]Luliconazole, Available at https://www.drugs.com/ppa/luliconazole.html[ Accessed 27 rebmetpeS 2017].
[11]Desai, N. J. and Maheshwari, D. G. UV spectrophotometric method for the estimation of luliconazole in marketed formulation (lotion). Pharma Science Monitor, 2014; 5(2):48-54.
[12]Wang, J., Urban, L. and Bojanic, D. Maximising use of in vitro ADMET tools to predict in vivo bioavailability and safety. Expert Opinion on Drug Metabolism & Toxicology, 2007; 3(5):641-665.
[13]Li Di Edward H. Kerns. Chapter 23 – Lipophilicity Methods in Drug Like Properties (Second Edition) Concepts, Structure Design and Methods from ADME to Toxicity Optimization. Academic press, 2016; 299–306.
Available at
https://www.sciencedirect.com/science/article/ pii/B978012801076100023X
[14]Indian Pharmacopoeia. Indian Pharmacopoeia Commission Ghaziabad, 2014; Vol. 1, pp. 156-157.
[15]ICH guidelines for validation of analytical
procedure, Available at
https://www.ich.org/fileadmin/Public_Web_Sit e/ICH_Products/Guidelines/Quality/Q2_R1/St ep4/Q2_R1__Guideline.pdf. (Accessed at 24 June 2018)
[16]Masuda, T., Pola Pharma Inc. and Nihon Nohyaku Co. Ltd. Crystal having crystal habits and pharmaceutical composition obtained by processing the crystal. 2015; U.S. Patent US20150183766.
![Table 1. Physicochemical properties [6]](https://thumb-us.123doks.com/thumbv2/123dok_us/737581.1083672/1.595.309.530.446.773/table-physicochemical-properties.webp)