Analysis of Genomic Sequence Using DSP
Techniques in LABVIEW
Dr. K.B.Ramesh1, Khushboo K Gandhi2, Shradda Pai K3, Sushma M4
Associate Professor, Dept. of Instrumentation Technology, R.V College of Engineering, Bangalore, Karnataka, India 1
UG Student, Dept. of Instrumentation Technology, R.V College of Engineering, Bangalore, Karnataka, India2
UG Student, Dept. of Instrumentation Technology, R.V College of Engineering, Bangalore, Karnataka, India 3
UG Student, Dept. of Instrumentation Technology, R.V College of Engineering, Bangalore, Karnataka, India4
ABSTRACT: Digital Signal Processing (DSP) applications in bioinformatics have received great attention in the recent years, where new effective methods for genomic sequence analysis, such as the detection of coding regions, have been developed. Rheumatic Arthritis (RA) is a chronic systemic inflammatory disease involving primarily the peripheral synovial joints. In this work, the software module has been implemented using LabVIEW which supports DSP toolbox. The DSP techniques such as Fast Fourier Transform (FFT) are incorporated in the algorithm. Analysis is performed on the generated power spectrum. The algorithm is tested for different normal and abnormal DNA sequences available in databases. Here genomic sequence is accessed from the standard database.
KEYWORDS: Rheumatic Arthritis, palindrome sequence, LabVIEW, Genomic analysis, Digital Signal Processing.
I. INTRODUCTION
The analysis of the genomic sequence is done using LabVIEW. In this project, Rheumatic Arthritis (RA) which
is a
chronic systemic inflammatory disease involving primarily the peripheral synovial joints is the disease taken for analysis. Many genes which are responsible for RA disease were found out and also the genomic sequence for each of these gens were found using databases such as KEGG (Kyoto Encyclopaedia of Genes and Genomes) and National centre of Biotechnology Information (NCBI). Along with abnormal genes few normal genes were also taken. Both normal and abnormal genes were then compared using the Digital Signal Processing techniques (DSP). Here, Fast Fourier Transform (FFT) is applied to achieve the comparison. The FFT tool is available in LabVIEW Software 2011 version. Appropriate code was written to extract a string sequence, convert this string sequence into numeric sequence and then apply FFT both the normal and abnormal. Gene sequence was given as inputs to the code. Analysis of the spectrum obtained for both normal and abnormal sequence was done by computing the mean amplitude. Separate code were written and implement for calculating the mean amplitude.
II. LITERATURE SURVEY
III
.
SOFTWARE IMPLEMENTATIONThe method to implement this paper is based on database of genomic sequence , LabVIEW and digital signal processing techniques. The acquired DNA sequence is compared with the standard DNA sequence structure. The analysis of these two sequences are done using DSP tool that are available in LabVIEW. A genomic sequence is accessed from the standard database and pasted in a text document. This text file is called in program through file input output function. Genomic sequence are generally in the form of string (mainly A,G,T and C) This string is converted into numerical form using select function along with comparison. Array of this, string converted into its corresponding numerical form, is obtained. FFT is applied and PSD coefficients are obtained. Using unbundle by name function, value of amplitude at each point can be accessed , mean amplitude is hence calculated. . Also the given sequence is palindrome or not can be verified.
Fig.1 Block diagram
In fig 1 the block diagram for the proposed work is shown.
Fig.2 Flowchart showing the 4 major steps
.
Fig.3 Accessing the genomic sequence(courtesy: KEGG)
Step 1.Genomic sequence Extraction
The genomic sequence of the genes responsible for Rheumatic Arthritis (RA) is taken from a standard database. There are many websites available for the extraction of genomic sequences. The National center of Biotechnology Information (NCBI) database is the most popular one. Others are Kyoto Encyclopaedia of Genes and Genomes or KEGG, PubMed, etc. The procedure followed for the same is that we need to enter the official gene name or the gene number to access the genomic sequence. They are two types of genomic sequences one is the AA sequences which stands for the amino acid sequencing and the other is the NT sequence which stands for nucleotide sequences. Here, NT sequence has been used. A snap shot for KEGG website is showed in the figure 3.
Step 2. Conversion of string to numeric form
The accessed genomic sequences which is in the form of NT sequence is converted to a complex format. As already mention earlier, the sequence obtained is in a string format and hence to apply FFT on it we need a discrete form. In a DNA sequence we have to assign numbers to the characters A, T, C, G, respectively. A proper choice of the numbers can provide potentially useful properties to the numerical sequence. For example, if we choose complex conjugate pairs T =A* and G = C* , then the complementary DNA strand is represented conjugate, symmetric numerical sequences which have interesting mathematical properties, including generalized linear phase. In this work complex conversion is taken as below and the code for the same is as shown in figure 4.
A à 1+ j G à-1+ j T à +1- j C à -1 - j
There are other conversions like binary where presence and absence is represented by 1 or 0 and other one is representing using electron ion interaction potential (EIIP) values.
Fig.5 A part of the code resulting in a FFT spectrum Step 3.Applying DSP techniques
After the conversion is done, next step is to to create a waveform. To built this waveform LabVIEW tool called the “build waveform” is used after which FFT is applied to it. Hence the resultant spectrum obtained is ready for analysis. The build waveform icon and the FFT tool can be seen in figure 5.
Fig.6. Finding mean amplitude Step 4.Analysis (comparison)
We compare the two waveform s obtained for normality and abnormality by finding out their mean amplitude whose code is given in figure 6.
IV. PALINDROME SEQUENCE
words from the nucleotide base alphabetsA, C, G, T that are symmetrical in the sense that they read exactly the same as their complementary sequences in the reverse direction. DNA palindromes are crucial for gene regulation, DNA replication and initiation of geneamplification.
Fig.7 Identification of a palindrome sequence.
The code is shown in figure 7 where if the 5’ to 3’ sequence and 3’ to 5’ sequence is entered it will show whether it’s a palindrome sequence or not. Many restriction endonucleases (restriction enzymes) recognize specific palindromic sequences and cut them. The restriction enzyme EcoR1 recognizes the following palindromic sequence:
5’- G A A T T C- 3’
3’- C T T A A G- 3’
V. RESULT
In a Normal sequence we observe that the mean amplitude is less than 1, and there is one clear peak obtained. For an abnormal sequence (with respect to RA disease) the mean amplitude is more than 1. Also, no clear peak is obtained in this case. Hence, we have successfully obtained power spectrum of both normal and abnormal sequence and compared them. Snap shots of the various normal and abnormal genes are shown in figure 8,9 and 10 respectively.
In Fig.8, The figure on the left shows the spectrum obtained from a sequence of TLR9 and the figure on the right shows an sequence of BLK.
In the Fig.9 ,The figure on the top shows the spectrum obtained from a sequence of HBA2 and figure on the bottom shows an sequence of CD5.
In the Figure 9 ,The figure on the top shows the spectrum obtained from a normal sequence (HBA2) and figure on the bottom shows an abnormal sequence (CD5). For normal sequence we observe that we obtain only one peak.
In the Fig 10 ,The figure on the left shows the spectrum obtained from a sequence of ABO and figure on the right shows a sequence of PTPN22.
Fig.11 Identifications of the coding regions in gene F56F11.4 in c-elegans chromosome III.
In figure 11,The effectiveness of the approach has been brought out in predicting the gene F56F11.4 with five exons. The snap shot of this gene is shown, where the five peaks show the five coding regions of this gene.
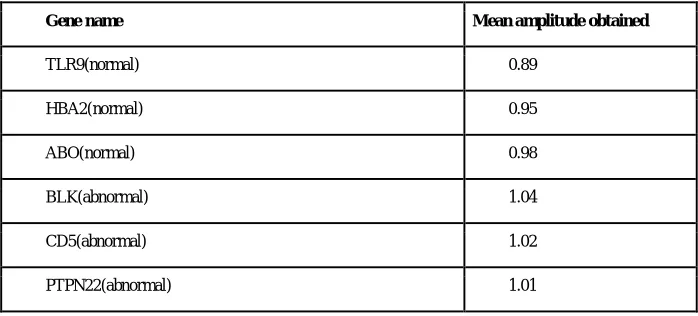
TABLE 1
Results obtained for various normal and abnormal genes.
Gene name Mean amplitude obtained
TLR9(normal) 0.89
HBA2(normal) 0.95
ABO(normal) 0.98
BLK(abnormal) 1.04
CD5(abnormal) 1.02
PTPN22(abnormal) 1.01
An observation table has been made by noting down the mean amplitude values for various genes which is given in the table 1.
VI. CONCLUSION
The application of DSP methods to genomic data have begun to make important contributions to genomic research. In this system, complex based values-based approach, as an alternative to the binary sequence method, has been suggested for genomic signal processing. Open access to raw genomic data makes it easy for DSP experts to get involved in genomic research. With the huge amount of powerful techniques developed over the years being applied to genomics, we can hope to see rapid advances in specialized areas such as customized drug design and genetic remedies, which will greatly benefit humankind.
VII. FUTURE SCOPE
developed module can be still improved by detecting the stage of disease. The proposed algorithm can be made as universal standard and also can be used to predict the other disease.
REFERENCES
1. P.Saranya, V.Harigopalkrishna, D.Murali, M.Ravikumar, M.Sujatha,”Analysis of Genomic and Proteomic Sequence Using Fir Filter”,IJMER,Vol. 4 , Iss. 2, Feb. 2014 ISSN: 2249–6645
2. Inbamalar T M and Sivakumar R,“Study of DNA Sequence Analysis Using DSP Techniques” ,Journal of Automation and Control Engineering ,Vol. 1, No. 4, December 2013
3. P. P. Vaidyanathan and B.-J. Yoon, “Digital filters for gene prediction applications,” in Proc. IEEE Asilomar Conf. Signals Syst. Comput., Monterey, CA, Nov. 2002.
4. A.Khare, A. Nigam, and M. Saxena,“Identification of DNA sequences by signal processing tools in protein-coding regions”, Search & Research, vol. 2, no. 2, pp. 44-49, 2011.
5. R. K. Deergha and M. N. S. Swamy, “Analysis of genomics and proteomics using DSP techniques”, IEEE Transactions on Circuits and systems Regular papers, vol. 55, no. 1, pp. 370-379, 2008.
6. D. Anastassiou, “Genomic signal processing,” IEEE Signal Process. Mag., vol. 18, no. 4, pp. 8–20, 2001.
7. Tuqan J, Rushdi A,”A DSP Approach for Finding the Codon Bias in DNA Sequences”.IEEE J Select Topics Sign Proc2008; vol2: 343- 56.