Martin, Haydn
A self stabilising multiplexed interferometer for online surface measurement
Original Citation
Martin, Haydn (2006) A self stabilising multiplexed interferometer for online surface
measurement. In: Proceedings of Computing and Engineering Annual Researchers' Conference
2006: CEARC’06. University of Huddersfield, Huddersfield, pp. 16.
This version is available at http://eprints.hud.ac.uk/id/eprint/3792/
The University Repository is a digital collection of the research output of the
University, available on Open Access. Copyright and Moral Rights for the items
on this site are retained by the individual author and/or other copyright owners.
Users may access full items free of charge; copies of full text items generally
can be reproduced, displayed or performed and given to third parties in any
format or medium for personal research or study, educational or notforprofit
purposes without prior permission or charge, provided:
•
The authors, title and full bibliographic details is credited in any copy;
•
A hyperlink and/or URL is included for the original metadata page; and
•
The content is not changed in any way.
For more information, including our policy and submission procedure, please
contact the Repository Team at: [email protected].
A Self Stabilising Multiplexed Interferometer for On-line Surface
Measurement
Haydn Martin
University of Huddersfield, Queensgate, Huddersfield HD1 3DH
Abstract
This paper introduces a new surface measurement method for potential online surface measurement application. It features high stability due to using near common-path configuration combined with active stabilisation. The active stabilisation is supplied by the use of a multiplexed reference interferometer and piezo-electric translator mounted mirror. The active compensation makes the system resistant to disturbance, pointing toward the possibility of on line use. The method should be of great benefit to advanced manufacturing, especially for quality and process control in precision manufacturing and on the production line. Proof-of-concept experiments have been successfully conducted by measuring the system stability over time.
Keywords multiplexed fibre interferometer stabilisation surface measurement
1 Introduction
Research into online optical measurement is not a new field, however, current methods do not have the accuracy or sensitivity to measure the micro-structures present on MEMS devices. Light scattering methods are numerous and well established; they can give a qualitative idea of overall surface roughness and are in general suitable for in-situ measurement. Unfortunately they cannot provide traceability as they work using fitting and statistical interpretation and, as they are all area averaging techniques, cannot be used to discern micro-structures [1].
A variation of phase shifting interferometry has been developed using a combination of a swept wavelength laser light source coupled with Fourier analysis of the returned signal periods to provide a real time 3D profile of a surface; its major drawback however is its lack of height resolution (approx 1µm) and as such is unsuitable for MEMS manufacturing requirements [2, 3]. Another method that has been developed recently uses analysis of the Fraunhofer diffraction pattern formed from a surface. Accurate results have been obtained using this method but it is currently only possible to measure isotropic surfaces with periodic structures [4].
Optical interferometric techniques for metrology hold many advantages such a speed, resolution, traceability and non-contact measurement. They are not however very suitable for the application to on-line measurement due to their high sensitivity to disturbance. This research hopes to try and alleviate this issue by providing immunity to disturbance during the measurement interval by way of active compensation, and thus realise an instrument with the benefits of an optical interferometer, but which is suitable for on-line applications.
2 The Un-stabilised System
The surface measurement system is composed of an on-machine optical dispersive probe and a remote opto-electronic system as illustrated in figure 1. Light from a tuneable laser is coupled into an optical circulator and is then collimated and focused onto a dispersive element by a graded-index lens (GRIN). The light is diffracted from a blazed diffraction grating and then reflected from the surface to be measured; this then combines and interferes with a reference beam retro-reflected from a flat reference mirror.
The diffraction grating provides two beams, a 0th order (or reflected) beam and the diffracted 1st order.
The 0th order beam is retro-reflected by a mirror to form the reference arm. The measurement arm is
tuneable frequency laser source, causes the 1st order light beam to scan a path across the surface of a length,
S
that is equal to;d
f
S
=
⋅
∆
λ
where f is the focal length of the objective lens, d is the pitch of the diffraction grating and ∆λ is the range of the wavelength scanning.
The recombination of the returning beams at the diffraction grating yields an interference signal that is directly related to the surface topography. This interference beam is reflected, by the grating, back to the GRIN lens and thus into the fibre; it is then eventually incident on a PIN photodetector. An op amp current to voltage (IV) converter and amplifier provides a voltage signal proportional to the intensity of light incident on the photodetector.
Variations in surface height cause the distance travelled by the first order beam to change, hence altering its phase at the recombination point. This changing phase results in a variation of light intensity the intensity of the recombined light beam,
I
(x
)
being;(
)
+
+
=
h
x
l
x
x
B
x
A
x
I
2
(
)
)
(
2
cos
)
(
)
(
)
(
λ
π
where
A
(x
)
andB
(x
)
are the bias intensity and fringe visibility at a point x along the scan path respectively.h
(x
)
is the height variation at the pointx
of the sample surface around the average optical path difference between the interferometer arms,l
.As the tuneable laser wavelength is swept, the intensity of the interferogram is sampled by a data acquisition (DAQ) card. After the wavelength has been swept we have a set of data sampled at regular intervals along the along the scan path.
Extraction of phase data from the output of an interferometer is non-trivial due the co-sinusoidal nature of the response; the topic is a broad and well researched one. In this system, Phase Shift Interferometry (PSI) techniques were used to retrieve the phase information from the interferometers output and, specifically, the Carré algorithm was implemented [5]. This algorithm was used in preference to others e.g. the Schwider-Hariharan [6] because, although it lacks insensitivity to phase shifting non-linearities, it does not require the wavelength to be known. This is of obvious benefit in this system, where the wavelength changes between each sampled point on the scan profile.
If
φ
(x
)
is the original phase at a sampled pointx
on the surface, and the phase is altered by 4 equal steps; -3α, -α, α and 3α around this point then 4 intensity values are obtained;)
(
1
x
I
,I
2(
x
)
,I
3(
x
)
andI
4(
x
)
respectively. These can then be solved using the Carré algorithm to yield the original phase value;(
)(
)
(
)
24 3 2 1 4 3 2 1 4 1 3 2 1
)
(
)
(
)
(
)
(
)
(
)
(
)
(
)
(
)
(
)
(
)
(
3
)
(
3
tan
)
(
x
I
x
I
x
I
x
I
x
I
x
I
x
I
x
I
x
I
x
I
x
I
x
I
x
+
−
−
−
−
+
+
−
−
=
−φ
The phase shift is obtained by using a piezoelectric translator (PZT) to move the reference mirror, thus altering slightly the optical path length in the reference arm; this changes the relative phase difference.
3 Experimental Results
In order to ascertain the accuracy of the setup, a high accuracy PZT was used to position the reference mirror in 50nm steps over a 250 nm range in order to alter the optical path difference. The profile of mirror surface was then measured after each step. The height data for each step measured is shown in figure 2.
Figure 2 also shows the average displacements of each consecutive step and the linear fit for the data, the standard deviation of the measurement data being 4.1 nm. It is assumed that the variation between the results is due to temperature drift as there as approximately 15 seconds elapsed between consecutive measurements.
The next experiment was designed to test another important element of any measurement system, repeatability. The same profile of the mirror surface was again measured five times and again, there was approximately 15 seconds between each scan. Any DC offset variation between the data sets was then removed; the resulting profiles can be seen in figure 3.The mean standard deviation between equivalent measurement points along the scan path was then calculated to be 1.6 nm.
4 The Stabilised System
In order to try and improve the repeatability of the instrument, the concept of active stabilisation was applied. The multiplexing of two interferometers, running at different source wavelengths, but following almost identical optical paths will result in them experiencing the same path length changes due to disturbances. Using one of the interferometers as a reference, we can follow any optical path length changes occurring in the setup and actively compensate for them. Figure 4 shows the experimental setup.
The compensation was performed by a combination of a Proportional-Integral (PI) controller coupled with a PZT, on which the reference mirror was mounted. Both interferometers use the same reference mirror so the act of stabilising the reference interferometer simultaneously stabilises the measurement interferometer.
A key feature of the system is the combination of fibre optic circulators and fibre Bragg gratings (FBGs) in order to de-multiplex the outputs of the two interferometers. This setup effectively separates the reference interferometer source wavelength from the range of swept wavelengths, sourcing the measurement interferometer, so they can be analysed separately by the electronics using separate PIN detectors.
The reference interferometer source is a fixed wavelength laser diode, running at 1550nm and its output provides feedback for the PI controller. The measurement interferometer (sourced by the tuneable laser) is stabilised, but still free to perform wavelength scanning and provide measurement capability.
A setpoint voltage, relating to the required point on reference fringe we want to lock the interferometer, is applied to the controller. This is done using a computer controlled DAQ card capable of generating analogue voltages. Once the setpoint has been applied, the fed back reference interferometer output is subtracted from it, to provide an error signal. A PI controller consisting of an opamp amplifier and integrator provides a suitable control voltage; this is then applied to the PZT upon which the reference mirror is mounted. Tuning was performed by applying a square wave voltage to the setpoint input and adjusting the proportional and integral gains to get a good settling response with minimal overshoot. It is now possible to lock the reference interferometer at any point on the reference fringe simply by adjusting the setpoint. This holds obvious advantages for the purpose of accurately moving the reference mirror for phase shift interferometry; non-linearities present in all PZTs e.g. hysteresis, are now overcome as the system is working in the closed loop. A low voltage PZT stack is utilised (PI 820.10) which provides a displacement of 15µm/100V. This means with a 0-10V control voltage range we can apply approximately 1500nm of displacement thus providing 2 full fringes of compensation range.
5 Experimental Results
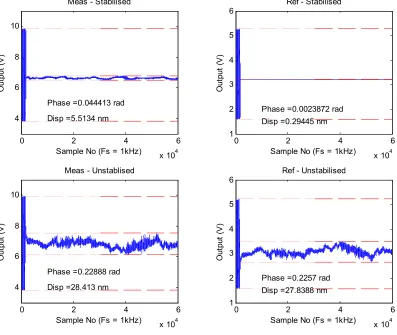
Experiments were carried out to judge the effectiveness of the system at eliminating environmental disturbance. The reference interferometer was locked at around the quadrature point i.e. the portion of the fringe over which
sin
ϕ
≈
ϕ
. The outputs of both interferometers were then sampled at 1 KHz over a period of 60 seconds. No wavelength sweeping took place, the measurement interferometer was held at a single wavelength. The results are shown in figure 4.In order to calculate the actual phase variation from the measured output of the interferometers we need to determine the visibility. This was be done by applying a triangular wave voltage to the PZT of a magnitude that created a displacement shift slightly more than λ/2. The resulting peak to peak oscillation in the interferometer output shows the full fringe visibility. The actual minimum and maximum phase readings on the signal can then be calculated using,
−
=
−V
c
I
1
sin
φ
Where I is the interferometer output voltage, V is the visibility and c is the quadrature point voltage. The actual displacement can then be calculated as
π
φλ
4
=
x
, whereλ
is the source wavelength.The results show that the drift of both interferometers is of a similar magnitude in the un-stabilised system at approximately 28nm over the 60 second sampling period. With the compensator switched on, the stability of the reference interferometer improves dramatically, keeping within 0.3nm. The measurement interferometer still wanders slightly, however the result is much improved, with a drift range of 5.5nm. This is a vast improvement over previous incarnations of the multiplexed fibre interferometer [7].
The wandering seen in the measurement arm after stabilisation is linked to the evolution of the state of polarisation (SOP) in the interferometer arms and input/output lead and is caused by environmental perturbation. The SOP for light in a low-birefringence optical fibre can be changed dramatically by mechanical actions upon the fibre such bending, kinking, twisting etc [8]. This alteration in the SOP leads to a variation in the visibility of the interferometer output according to;
η
cos
=
V
,where
2
η
is the angle subtended by the great circle arc betweenC
randC
s, the normalised Stokes vectors of the light in the reference and signal arms respectively, when plotted as coordinates on a Poincare sphere. Maximum visibility is afforded whenη
=
0
, i.e. the SOPs are co-incident. The coordinates ofC
randC
s are dependant on two factors [8]. Firstly, the polarisation effects in the interferometer arms which, being in free space, are static and not affected by any fibre perturbation. Secondly, the SOP of the input light which in turn, is altered by the varying birefringence of the input lead.In order to ascertain this is in fact the case, the mirror mounted PZT was again oscillated with a triangular wave to obtain the fringe visibility. At the same time the input fibre lead to the interferometer (from the tuneable laser) was manipulated. It was seen that the visibility varied dramatically as the lead was manipulated.
The error signal fed to the controller tracks the reference interferometer output which in turn is affected by both OPD changes and visibility variation due to SOP evolution in the fibre. Whilst the OPD variations between the reference and measurement interferometers are almost identical, the SOP effects are not, hence we see an effect on the stability of the measurement interferometer.
Another method is to use polarisation scrambling [8], whereby different SOPs are produced at a rapid rate (typically 500MHz); these SOPs are spread evenly over the Poincare sphere, and thus over a sufficiently long interval, the light can be considered to be unpolarised. If the scrambling rate is sufficiently higher than the rates of the fading affects in optical system, the problem of signal fading is eliminated at the price of slightly reduced visibility. While the polarisation scrambling method is attractive in its simplicity, issues arise because of the re-polarisation of light that passing through the fibre-optic circulators.
Currently, the effect of SOP evolution in the fibre optic interferometers is kept to a minimum by taping down all the fibre optic cable to the optical isolation table so movement of the fibre due to air currents and vibrations is minimised.
6 Conclusion
A fibre interferometer possessing the ability to scan a surface with a wavelength altered light beam has been demonstrated. Furthermore, a multiplexed variant with a reference interferometer, working at a separate wavelength has been shown to provide effective compensation for disturbances due to environmental perturbation.
It has been shown that the effectiveness of the compensation system is limited by polarisation fading effects due to birefringence changes in the fibre input lead. Possible methods of overcoming this issue are polarisation scrambling and active polarisation compensation; future work will look into this in more detail.
The next stage of development will be to design and build a digital compensator based around a digital signal controller (TMS320F2812). This will provide the ability to change controller parameters more easily and provide the possibility of using different control algorithms and filters to try and improve on the performance of the compensator further down the line.
The stabilised setup must also be used to carry out phase shifting measurement and real measurement data must be compared with that taken from the un-stabilised system in terms of repeatability and so forth.
References
1) Vorburger, T. and Teague, E., “Optical techniques for on-line measurement of surface topography”, Precision Engineering 3(2), 61-83 (1981).
2) Kuwamura, S., Yamaguchi, I., “Wavelength scanning profilometry for real-time surface shape measurement”, Appl. Opt. 36, 4482 (1997).
3) Yamamoto, A. and Yamaguchi, I., “Profilometry of SIoped Plane Surfaces by Wavelength Scanning Interferometry”, Optical Review 9(3), 112-121 (2002).
4) Taguchi, A., Miyoshi, T., Takaya, Y. and Takahashi, S., ”Optical 3D profilometer for in-process measurement of microsurface based on phase retrieval technique”, Precision Engineering 28, 152-163 (2004).
5) K. Creath, "Phase-Measurement Interferometry Techniques," in Progress in Optics. XXVI, E. Wolf, ed. ( Elsevier Science Publishers, Amsterdam,1988), pp.349-393
6) Schwider, J., Burow, R., Elssner, K., Grzanna, J., Spolaczyk, R. and Merkel, K., “Digital wave-front measuring interferometry: some systematic error sources”, Appl. Opt. 22, 3421.
7) Jiang, X., Lin, D., Blunt, L., Zhang, W. and Zhang, L., “Investigation of some critical aspects of on-line surface measurement by a wavelength-division-multiplexing technique”, Meas. Sci. Technol. 17(3), 483.
8) Kersey, A., Marrone, M. and Dandridge, A., “Analysis of Input-Polarization-Induced Phase Noise in Interferometric Fiber-optic Sensors and Its Reduction using Polarization Scrambling”, J. Lightwave Technology, 10(6), 838.
Tuneable Laser Circulator GRIN Ref. Mirror Detector 1 1 2 3 Phase Grating Objective Lens Sample m λ Phase detection
0thorder
1storder
Computer Optical Probe PZT f f DAQ Card Tuneable Laser Circulator GRIN Ref. Mirror Detector 1 1 2 3 Phase Grating Objective Lens Sample m λ Phase detection
0thorder
1storder
Tuneable Laser Circulator GRIN Ref. Mirror Detector 1 1 2 3 Phase Grating Objective Lens Sample m λ Phase detection
0thorder
1storder
[image:7.595.59.504.78.171.2]Computer Optical Probe PZT f f DAQ Card
[image:7.595.80.244.212.341.2]Figure 1: The setup of the un-stabilised measurement system.
Figure 2: Results of displacement experiment. (a) Measured displacements of each consecutive step; (b) Average displacement and calculated linear fit.
1560 1565 1570 1575 1580 1585 1590 1595 -15 -10 -5 0 5 10
Optical Wavelength (nm)
D isp la ce m en t ( nm )
Circulator 1 Gradient index lens 1 2 3 Phase grating Objective lens Sample m λ
0th order
1st order
Optical probe Tuneable Laser Laser Diode Coupler Circulator 2 Detector 1 Phase detection 1 FBG 2 3 Ref. Mirror 0 λ PZT Servo electronics Detector 2 Figure 3: Results of the repeatability experiment, DC
[image:7.595.259.474.217.340.2]offsets have been removed.
Figure 4: Setup of the actively stabilised interferometer
0 2 4 6
x 104 4 6 8 10 Out put ( V )
Sample No (Fs = 1kHz) Meas - Stabilised
Phase =0.044413 rad
Disp =5.5134 nm
0 2 4 6
x 104 1 2 3 4 5 6 Out put ( V )
Sample No (Fs = 1kHz) Ref - Stabilised
Phase =0.0023872 rad Disp =0.29445 nm
0 2 4 6
x 104 4 6 8 10 Out pu t ( V )
Sample No (Fs = 1kHz) Meas - Unstablised
Phase =0.22888 rad Disp =28.413 nm
0 2 4 6
x 104 1 2 3 4 5 6 Out pu t ( V )
Sample No (Fs = 1kHz) Ref - Unstabilised
[image:7.595.90.487.390.725.2]Phase =0.2257 rad Disp =27.8388 nm