ASSESSING
TEACHERS
NEEDS
USING
DATA
MINING
Archna Bajaj (Author)
1, Dr. S.K.Saxena
21
PhD Scholar, Dept. of Computer Science and System Studies,
Mewar University, Chittorgarh (India)
2Senior Faculty, Dept. of Computer Science and Engineering
Delhi Technological University, New Delhi, (India)
ABSTRACT
The aim of this research paper is to assess and prioritize the Teachers’ needs using Data Mining. Working in incredibly challenging environments, Teachersare the backbone of the education system.Meeting their needs is crucialto the success of the educational institutions. In this study, a closed-ended questionnaire is used to collect data from teachers of higher education institutes. The paper focuses on the academic needs of the teachers and the responses generated help the educational institutes analyze the gaps in teachers needs and provide for a better and effective teaching experience. Sophisticated teaching abilities are required nowadays due to complex curriculums, diverse student needs and enhanced education standards. Keeping a tab on teachers needs is hence attaining importance. Further, it can help in increasing the teaching standards and planning for staff and instructors.
Keywords: Data Mining, Educational Data Mining (EDM), Faculty Needs.
I. INTRODUCTION
In the modern world, education has set new benchmarks.The educational institutes understand that every aspect of their reforms depends on highly skilled and motivated teachers for its success. Higher education institutes nowadays, are more diversifiedwith increased emphasis on performance and quality of education. The plethora of programs and advanced education technologies require increase in wider participation by the faculty. This not only results in better student satisfaction, it also helps the faculty establish and achieve their own professional goals.
This growing diversity in higher education makes it imperative for these institutes to understand the faculty needs, which can help in building a more effective higher education system. “Need” is defined as the gap between current outcomes or outputs and desired (or required) outcomes or outputs [1]. It is important to understand, identify and address these gaps so as to enhance their skills, teaching methodologies and overall in-classroom teaching experience.
Marketing, Medicine, Insurance and many other sectors. But application of DM in the field of Education is still limited.DM can help educators in getting a focused understanding of students needs and improve upon the same. Data Mining tools predict behaviours and future trends, allowing businesses to make proactive, knowledge-driven decisions [2]. Educational Data Mining is an emerging field that focuses on applying Data Mining tools to Education related Data [3].
II. RESEARCH BACKGROUND
Researches within Educational Data Mining field have focused on topics like finding set of Weak students, Student evaluation, Faculty Evaluation, Student dropout ratio, Understanding students enrollment data, impact of feedback on teachers and students behavior.
Recent literature on Educational Data Mining is presented below:
Romero and Ventura conducted survey on Educational Data Mining between Years 1995 to 2005 and concluded that Educational Data Mining is a promising area of research [4].
Alaa-El-Haleez gave a case study that used Educational Data Mining to analyze student-learning behavior [5]. B.K.Bhardwaj and Saurabh Pal used classification task on student database to predict the students division on the basis of previous database and reduce fail ratio [6].
Chong Ho Yu used Data Mining techniques to study the predictors affecting University student retention [7]. S.Anupama and Vijaylakshmi used Data Mining techniques to study behavior and performance of students [8]. Ajay Kumar Pal and Saurabh Pal used Data Mining techniques in EDM for predicting performance of students [9].
J.Ranjan and K.Malik used data-mining techniques for exploring the effects of probable changes in processes related to admissions, course delivery and recruitments [10].
Dr. Mohd Maqsood Ali, “Role of data mining in education sector”, International Journal of Computer Science and Mobile Computing Vol. 2, Issue. 4, April 2013[11].
Agrewal, S., G. Pandey, and M. Tiwari. "Data mining in education: data classification and decision tree approach.” International Journal of e-Education, e-Business, e-management and e-learning, 2 (2) (2012)[12]. In 2012, M. Sukanya, S. Biruntha, Dr. S. Karthik and T. Kalaikumaran analyzed and assisted the low academic achievers in higher education using Bayesian Classification Method of Data Mining [13].
Pandey, Umesh Kumar, and Saurabh Pal. "A Data mining view on class room teaching language”.International Journal of Computer Science Issues (2011)[14].
Randa Kh. Hemaid , and Alaa M. El-Halees, “Improving teacher performance using Data mining”, International Journal of Advanced Research in Computer and Communication EngineeringVol. 4, Issue 2, February 2015 [15].
Ahmadi,F.,and Abadi, S. “Data Mining in Teacher Evaluation System using WEKA”, International Journal of Computer Applications (0975 – 8887), Vol 63 – No.10, February 2013[16].
III. OBJECTIVES
1. The proposed work uses Data Mining to identify the needs of faculty and further enhances their skills to help them achieve their career goals.
2. Identify the needs and preferences of teachers towards appropriate course ware, teaching methodologies, faculty competency & approach and ways of assessment.
3. Prioritize the needs of the faculty and help them in developing new, focused and more effective teaching strategies and methodologies. Need patterns can be further studied to identify the focus areas that need to be developed in order to achieve improved learning outcome.
IV. DATA MINING TECHNIQUES
Data Mining Techniques consist of various algorithms and techniques for finding out patterns from the data. These Techniques can be classified into two categories: Predictive and Descriptive.
A. Predictive Data Mining: It uses some variables or fields to predict unknown or future values of variables of that interest. It includes Classification, Regression and Prediction techniques.
B. Descriptive Data Mining: It focuses on finding patterns describing the data that can be interpreted by humans. It includes Clustering, Summarization and Association techniques.
V. RESEARCH METHODOLOGIES
A. Data Collection Strategy
The data for this study has been collected from faculty of undergraduate courses of different colleges. A sample size of 66 teachers has been used in the study. The closed-ended questionnaire comprised of various attributes pertaining to academic needs.
Participants on the scale of 1 to 5 responded to the Likert scale based questionnaire: 1. Very Important
2. Fairly Important 3. Neutral
4. Not Important 5. Not at all Important.
B. Cleaning and preparing data
The collected data needs to be pre-processed and cleaned before Data Mining Techniques can be applied on the same to extract meaningful information. In this step only those fields were selected which were required for data mining. The pre-processing was done in terms of filling up missing values, rectifying inconsistent data and removing duplicate data. The Excel dataset collected from various sources has been collated into a single dataset for further analysis.
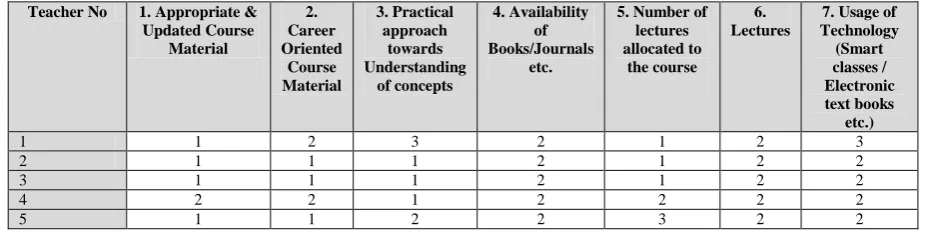
C. Partial Data Set (raw data)
TABLE 1. (Sample of 5 respondents)
Above data set is for 23 questions and has been filled by 66facultymembers of undergraduate courses of different colleges.
D. Reliability Test
Cronbach‟s alpha test is a measure of internal consistency that is, how closely related sets of items are as a group. It is a co-efficient of reliability (or consistency) [18].
TABLE 2. Reliability Statistics
Cronbach's Alpha Cronbach's Alpha Based on Standardized Items N of Items
0.948 0.950 23
The Alpha co-efficient is 0.948 suggesting that the items have relatively high internal consistency.
E. Data mining exploration
A popular DM tool, IBM SPSS has been used for initial statistical analysis of the data. The Excel dataset is imported into SPSS.
Data has been explored using Statistical Measures (Median and Mode). Refer Table 3 below:
TABLE 3. (Sample)
1.Course Material 2. Career Oriented 3. Practical approach towards
Understanding of concepts
4. Availability of
Books/Journals etc.
N
Valid 66 66 66 66
Missing 0 0 0 0
Median 1.00 1.00 1.00 1.50
Mode 1 1 1 1
The table shows Median and Mode of individual questions reflecting the central tendency.
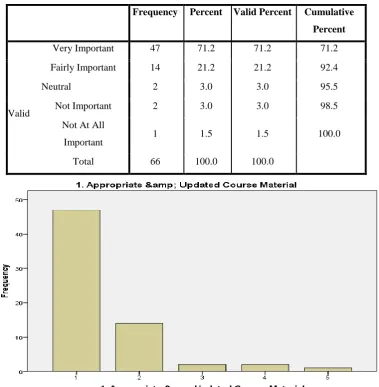
Response to each question has been analyzed separately. The table 4 below shows the frequency and percentage of responses to individual questions.
Refer Table 4 and Bar chart 1 below:
Teacher No 1. Appropriate &
Updated Course Material 2. Career Oriented Course Material 3. Practical approach towards Understanding of concepts 4. Availability of Books/Journals etc.
5. Number of lectures allocated to
the course
6. Lectures
7. Usage of Technology (Smart classes / Electronic text books etc.)
1 1 2 3 2 1 2 3
2 1 1 1 2 1 2 2
3 1 1 1 2 1 2 2
4 2 2 1 2 2 2 2
TABLE 4. (Q1: Course Material)
Frequency Percent Valid Percent Cumulative Percent
Valid
Very Important 47 71.2 71.2 71.2
Fairly Important 14 21.2 21.2 92.4
Neutral 2 3.0 3.0 95.5
Not Important 2 3.0 3.0 98.5
Not At All
Important 1 1.5 1.5 100.0
Total 66 100.0 100.0
Fig. 1. Bar chart 1 (for Q1: Course Material)
After analyzing individual questions and applying various statistical techniques a priority list of the needs was generated which showed that „Appropriate and Updated Course material‟ ranked the highest.
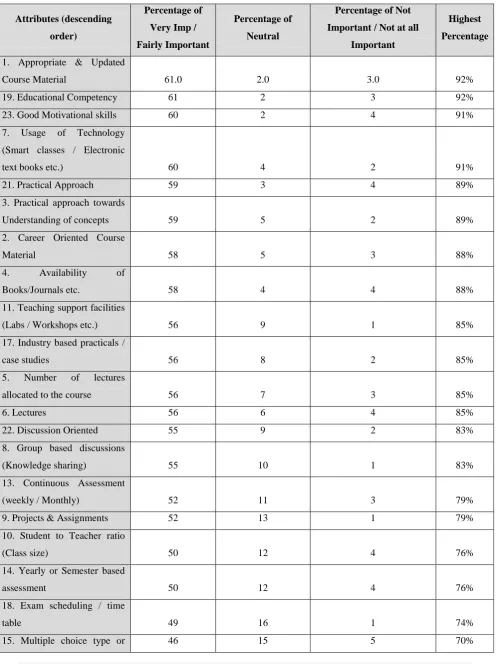
Table 5 below displays the percentages of responses in the (Very Imp + Fairly Imp) category, Neutral category and (Not Imp + Not at all Imp) category with respect to total responses. These responses have been further filtered from highest to lowest and the TOP 3 attributes are as follows:
1. Appropriate and Updated Course material 2. Educational Competency
3. Good Motivational skills
TABLE 5. (Highest to lowest on Percentage of Importance)
Attributes (descending order)
Percentage of Very Imp / Fairly Important
Percentage of Neutral
Percentage of Not Important / Not at all
Important
Highest Percentage
1. Appropriate & Updated
Course Material 61.0 2.0 3.0 92%
19. Educational Competency 61 2 3 92%
23. Good Motivational skills 60 2 4 91%
7. Usage of Technology (Smart classes / Electronic
text books etc.) 60 4 2 91%
21. Practical Approach 59 3 4 89%
3. Practical approach towards
Understanding of concepts 59 5 2 89%
2. Career Oriented Course
Material 58 5 3 88%
4. Availability of
Books/Journals etc. 58 4 4 88%
11. Teaching support facilities
(Labs / Workshops etc.) 56 9 1 85%
17. Industry based practicals /
case studies 56 8 2 85%
5. Number of lectures
allocated to the course 56 7 3 85%
6. Lectures 56 6 4 85%
22. Discussion Oriented 55 9 2 83%
8. Group based discussions
(Knowledge sharing) 55 10 1 83%
13. Continuous Assessment
(weekly / Monthly) 52 11 3 79%
9. Projects & Assignments 52 13 1 79%
10. Student to Teacher ratio
(Class size) 50 12 4 76%
14. Yearly or Semester based
assessment 50 12 4 76%
18. Exam scheduling / time
Essay type assessment
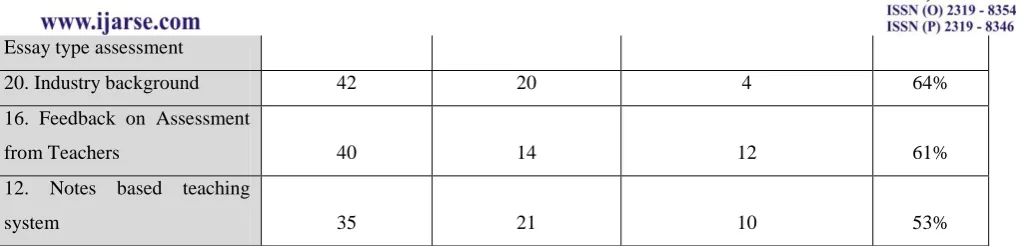
20. Industry background 42 20 4 64%
16. Feedback on Assessment
from Teachers 40 14 12 61%
12. Notes based teaching
system 35 21 10 53%
The needs are categorized under different Groups as follows: 1. Courseware: Q1 to Q5
2. Assessment techniques: Q6 to Q12 3. Teaching Methodologies: Q13 to Q18 4. Teachers‟ competencies: Q19 to Q23
T-test
T-test has been conducted to compare the needs of the above groups.
TABLE 6. T-test
One-Sample Statistics
N
Mean
Std.
Deviation
Std. Error
Mean
Course_Material 66 1.5667 .72966 .08982
Teaching_Method 66 1.8312 .68301 .08407
Assessment 66 2.0631 .63768 .07849
Teachers 66 1.6970 .67959 .08365
The T-test indicates that there is significant difference in the Means of various Groups. Refer Table 6 above: Assessment group followed by Teaching methodologies rank the most important as per the T-test conducted.
VI. CONCLUSION
The priority list of the „Faculty Needs‟ has been established and the study clearly shows the inclination of the teachers towards „Appropriate and Updated Course material‟ and „Educational competency‟.Teachers firmly believe in the importance of „Motivational skills‟ and „Usage of Technology‟ in the education system.
VII. FUTURE SCOPE
be done in case of faculty members of schools or postgraduate courses, technical institutions, management courses etc. to judge their priority needs.
REFERENCES
[1] R. A. Kaufman, “Why Needs Assessment,” in Needs Assessment-Concept and Applications, 1st
ed. New Jersey, Educational Technology Publications, 1979, pp. 8.
[2] S. Sumathi & S. N. Sivanandam,“Introduction to Data Mining Principles,” Introduction to Data Mining and it‟s Applications, Vol. 29, pp. 16, 2006.
[3] R. S. J. D. Baker and K. Yacef, “The State of Educational Data Mining in 2009: A Review and Future Visions,” Journal of Educational Data Mining, Article 1, Vol. 1, No. 1, pp. 3-17, Fall 2009.
[4] C. Romero & S. Ventura, “Educational Data mining: A survey from 1995 to 2005,” Expert Systems with Applications, Vol. 33, No. 1, pp. 135-146, 2007.
[5] A. El-Halees, “Mining Students Data to analyze learning behavior: A case study,” Department of Computer Science, Islamic University of Gaza P.O.Box 108 Gaza, Palestine, 2009.
[6] B. K. Baradwaj & S. Pal, “Mining Educational Data to Analyze Students,” IJACSA, Vol. 2, Issue 6, pp. 63-69, Oct. 2011.
[7] Chong Ho Yu et al., “A Data Mining Approach for Identifying Predictors of Student Retention from Sophomore to Junior Year,” Journal of Data Science, Vol. 8, pp. 307-325, 2010.
[8] S. A. Kumar and M. N. Vijayalakshmi, “Relevance of Data Mining Techniques in Edification Sector,” International Journal of Machine Learning and Computing, Vol. 3, No. 1, pp. 4-6, Feb. 2013.
[9] A. K. Pal and S. Pal, “Classification Model of Prediction for Placement of Students,” I.J. Modern Education & Computer Science, Vol. 5 Issue 11, pp. 49-56, Nov. 2013.
[10] J. Ranjan & K. Malik, “Effective educational process: A data-mining approach”, VINE, Vol. 37, Issue 4, pp. 502–515, 2007.
[11] Dr. Mohd Maqsood Ali, “Role of data mining in education sector”, International Journal of Computer Science and Mobile Computing Vol. 2, Issue. 4, Apr. 2013.
[12] Agrewal, S., G. Pandey, and M. Tiwari. "Data mining in education: data classification and decision tree approach.” International Journal of e-Education, e-Business, e-management and e-learning, 2 (2) (2012). [13] Sukanya, M., S. Biruntha, Dr S. Karthik, and T. Kalaikumaran. "Data mining: Performance improvement in
education sector using classification and clustering algorithm." In International conference on computing and control engineering,(ICCCE 2012),vol. 12. 2012.
[14] U. K. Pandey & S. Pal, “A Data Mining view on Classroom Teaching Language,” ICJSI, Vol. 8, Issue 2, Mar. 2011.
[15] Randa Kh. Hemaid, and Alaa M. El-Halees, “Improving teacher performance using Data mining”, International Journal of Advanced Research in Computer and Communication EngineeringVol. 4, Issue 2, February 2015. [16] Ahmadi,F.,and Abadi, S. “Data Mining in Teacher Evaluation System using WEKA”, International Journal of
Computer Applications (0975 – 8887), Vol 63 – No.10, February 2013.