On the boundary layer structure on suction side of an airfoil
Václav Uruba1,2,*, Pavel Procházka1, and Vladislav Skála1
1Institute of Thermomechanics, ASCR, v.v.i., Dolejškova 5, Praha 8, CR
2UWB, FME, Department of Power System Engineering, Universitní 8, Plzeň, CR
Abstract. The structure of boundary layer on an airfoil suction side was studied using stereo time resolved PIV technique experimentally in low Reynolds number, about 33 thousands. The mean velocity field is close to the 2D case, however the instantaneous structure is highly dynamical and 3D. Dynamics of the vortices in the boundary layer has been analysed using POD method. The results show lag of coherence in the streamwise direction, oblique patterns are detected instead.
1 Introduction
Boundary layer on the suction side of an airfoil is to be subjected to experimental study. The main aim of the study is description of the 3D topology of the unsteady structures within the boundary layer under adverse pressure gradient on the downstream half of the upper surface in vicinity of the airfoil trailing edge.
The flow-field around a prismatic airfoil in homogeneous inflow is usually considered to be 2D, as the boundary conditions as also 2D, constant along the airfoil span. This precondition is physically justified only in the case of laminar flow, in the turbulent case it could be applied only on distributions of velocity statistics as mean values and variances, but definitely not on instantaneous situations.
In our preceding studies the presence of streamwise vorticity within the turbulent boundary layer on the suction side of simple airfoil was proved experimentally, see [3, 8, 9]. This is indication that similar vortical structures arise in various positions in streamwise direction. However theirs appearance seems to be random in the spanwise direction. Now we face the question whether the vortex structures are correlated in streamwise direction or not. Existence of streamwise vortices in the boundary layer on an airfoil suction side is predicted by [1, 2] and forms basic idea of the “new theory of flight”. This study will show the typical shape of vortices along the upper surface of the airfoil.
To prove or disprove existence of the vortices along the suction side of the plate we prepared the new decisive experiment. Stereo PIV measurements are carried out in the plane parallel to the plate in the distance of position of the biggest vortices centres detected by the POD method. Then, positive and negative velocity fluctuations in direction perpendicular to the plate in y-direction could indicate shape of the vortices within the measuring plane.
The simplest airfoil represented by an inclined flat plate will be considered in this paper.
2 Experimental setup
The experiments were carried out in the blow-down facility in the Institute of Thermomechanics.
2.1 Model
Flat plate inclined with angle of attack (AOA) 7 degrees has been placed in a uniform low turbulent stream. The blow-down facility produces a jet with uniform velocity distribution, mean velocity U0 about 5 m/s, intensity of turbulence less than 0.2%. The plate of thickness 2 mm has rounded edges, chord is 100 mm and span 450 mm. The Reynolds number based on plate chord is about 33 thousands. Schematics of the experiment is in figure 1.
Fig. 1. Schematics of the experiment.
Cartesian coordinate system is introduced with z axis in streamwise direction parallel to the plate surface, x in spanwise direction and y perpendicular to the plate surface. Origin of the coordinates is fixed on the upper plate surface at the centre of the leading edge (red dot in
AOA Flow
Plane of measurement 2
z x y
c
The transversal plane of measurement 1 is placed in (xy) plane, intersecting the plate trailing edge. The plane of measurement 2 is located parallel to the plate surface in the distance 5 mm corresponding to 0.05 c above the plate surface. The planes of measurement 1 and 2 are shown in figure 1 in red and green colours respectively.
2.2 Instrumentation
The time-resolved stereo PIV measuring system was used for the experiments.
The measuring system DANTEC consists of laser with cylindrical optics and two CMOS cameras with Scheinpflug mounting of lenses 60 mm focal length. Laser New Wave Pegasus Nd:YLF, double head, wavelength 527 nm, maximal frequency 10 kHz, a shot energy is 10 mJ for 1 kHz (corresponding power 10 W per head). Two cameras NanoSense MkIII, resolution 1280 x 1024 pixels and frequency 500 double-snaps per second, 1600 double-snaps were acquired in sequence corresponding to 3.2 s of the record time. The stereo-PIV method has been used for evaluation all 3 velocity components in the measuring plane. The configuration of the stereo PIV system is in Figure 2.
Fig. 2. Stereo PIV configuration.
The Scheinpflug mounting of lenses was used to keep the focus plane within the laser sheet. The calibration was performed using the standard dot PIV calibration target 100 x 100 mm2, moving in the
direction perpendicular to the target using a precise traversing system equipped by stepper motor drive, 5 positions are used (-2,-1, 0, 1 and 2 mm). For seeding particles, a standard SAFEX fog generator has been used.
3
Results
The presentation of the results is divided into two parts. First the typical vortical structures in transversal measuring plane 1 are to be shown. Then, the structure of the instantaneous vortices in streamwise direction will be demonstrated by results obtained in the plane parallel to the plate, measuring plane 2.
All quantities are normalised to be in dimensionless form. The distances are normalised by the chord c, velocities by the velocity of incoming flow U0 and turbulent kinetic energy by square of it.
3.1. Transversal plane
The results in the measuring plane 1 will be shown first to identify the streamwise vorticity within the boundary layer. The position y/c = 0 indicates the plates trailing edge.
The time-mean flow is characterized by mean velocity and Turbulent Kinetic Energy (hereinafter TKE) distributions in figures 3 and 4 respectively.
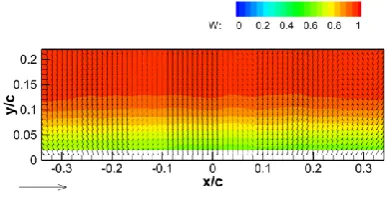
Fig. 3. Mean velocity components distribution, measuring plane 1.
Figure 3 shows the mean velocity distribution, vectors pointing downward represent in-plane velocity components U and V, the out-of-plane velocity component W is represented by the colour. In the left lower corner there is a reference vector of the size 1, showing that U and V components are much smaller than 1, while streamwise mean velocity component W
exceeds 1.
Fig. 4. TKE distribution, measuring plane 1.
Figure 4 represents the turbulence kinetic energy distribution with maximum in position around y/c = 0.05. The time-mean flow-field shows the clearly the down-wash effect. The thickness of the boundary layer on the upper suction side of the plate in the trailing edge position could be estimated on 0.2 c. The mean flow is pretty regular, it could be considered to be close to 2D, independent on x coordinate in the first approach. Furthermore, no vorticity component perpendicular to the plane of measurement is visible in the mean velocity vectors distribution.
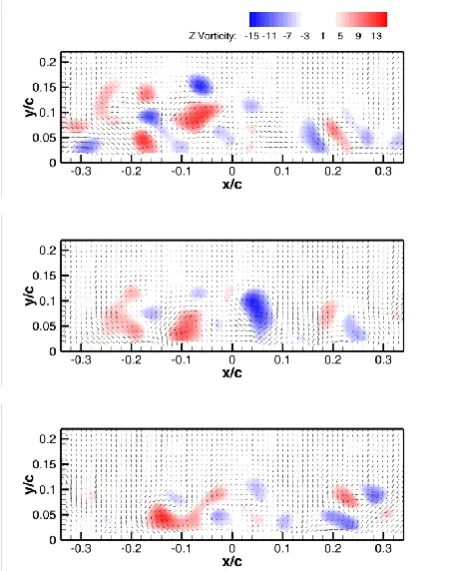
However the instantaneous velocity distributions are very different, consisting of numerous vortices appearing randomly both in time and spanwise position. To show this, the 3 examples of instantaneous velocity fields are shown in figures 5 and 6. Figure 5 shows the streamwise velocity component distribution in colour, while in figure 6 the colour corresponds to the streamwise vorticity component. The 3 examples of the instantaneous flow-field are the same in both figures. Measuring plane
Camera A Camera B
Fig. 5. Instantaneous velocity vectors with vorticity distributions, measuring plane 1 (3 examples).
The spanwise vorticity component distribution is depicted in colours (red positive, blue negative) in the following figure.
Fig. 6. Instantaneous velocity vectors with vorticity distributions, measuring plane 1 (3 examples).
Figure 6 shows clearly presence of the streamwise
within the airfoil suction side boundary layer. The vortices are variable both in sizes and locations.
To recognize typical vortex parameters, further analysis using Proper Orthogonal Decomposition (hereinafter POD) method was performed. Details on implemented POD algorithms could be find in [6, 7].
The POD analysis reveals appearance of similar vortices distributed quasi-periodically in span direction. In figure 7 there are POD spatial modes 1, 4 and 7, suggesting existence of contra-rotating vortex pairs oriented in streamwise direction with various spacing.
Fig. 7. POD modes 1, 4 and 7 of vector-field dynamics, measuring plane 1.
In figure 7 the colour denotes streamwise vorticity similarly as in figure 6. More details on the results of POD analysis of velocity fields in planes perpendicular to the flow could be find in [3].
3.2. Parallel plane
The position of measuring plane 2 was chosen
y/c = 0.05, which correspond to position of the energetic vortices, compare figures 4 and 7. The value z/c = 1 corresponds to the position of the plate trailing edge.
Observing this measuring plane from above, the in-plane instantaneous vector components u and w indicates flow within the boundary layer, while the component v
perpendicular to the measuring plane indicates presence of vortices with cores within the measuring plane. The shape of the vortex core could be tracked as the vortex centreline is surrounded by positive and negative v velocity component regions, order is connected with the individual vortex orientation.
components. The in-plane components U and W are shown as vectors, the unit vector is shown in lower left corner. The out-of-plane velocity component V is in colour (blue negative, red positive). It is clear that the only nonzero velocity component is the streamwise W
with value approaching 1, the other two components U
and V approximating zero. No indications of presence of vortices in the mean velocity field were observed.
Fig. 8. Mean velocity components distribution, measuring plane 2.
The TKE distribution is depicted in figure 9.
Fig. 9. TKE distribution, measuring plane 2.
The highest TKE region is close to the plate half in flow direction, as the boundary layer reattachment take place just upstream (approximately at z/c = 0.3-0.4).
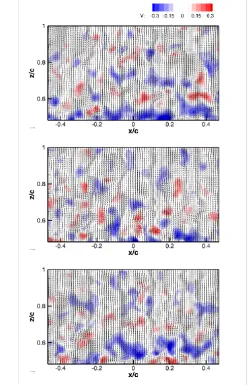
Again, as in the case of the measuring plane 1, we could conclude, that the mean flow is regular and it could be considered to be close to 2D, independent on the spanwise coordinate. To visualize the appearing vortices the instantaneous velocity field has been studied. In figure 10 there are 3 arbitrarily chosen instantaneous velocity fields within the measuring plane 2.
Fig. 10. Instantaneous vector fields, measuring plane 2 (3 examples).
Within the v-component velocity field distributions in figure 10 we could recognize positive (red) and negative (blue) spots randomly distributing in the measuring plane. Both the shapes and sizes of spots vary, however we could recognize tendency of spot distribution along the diagonal direction. To study this behaviour in detail, the POD analysis has been applied on the data.
The energy distribution along the POD modes is shown in figure 12.
Fig. 12. Energy fraction of POD modes, measuring plane 2.
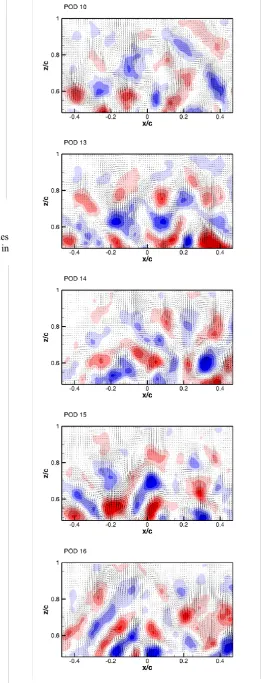
We will show a few examples of the POD modes topologies from this group. The typical modes are in figure 13.
In figure 13 all 3 velocity components are represented, the in-plane velocity components U and W
are vectors and the out-of-plane component V is represented by colour. Red colour denotes positive value, blue is negative and white is close to zero. In modes 1, 8, 10 the chequered distribution of positive and negative spots of V velocity components could be detected. In modes 4 and 13 process of interconnection of neighbouring spots is visible, while in modes 14, 15, 16 clear oblique strips are developed. The modes features are a little bit combined, as the structures are randomly distributed within the measuring plane, more or less homogenously. So, the V velocity component distribution suggests presence of the more or less regular structures oriented obliquely in the angle close to 45 degrees in the POD modes.
The in-plane velocity components U and W shows typical turbulent velocity field with numerous vortices. So, the vorticity instantaneous vectors are not only in the measuring plane, but also intersecting it.
The topology of the vortical structures in the boundary layer on the suction side of the inclined plate has features of a mixing layer undergoing helical pairing presented by Silvestrini et al. [5]. The vortices originally parallel to the flow direction are interconnecting forming oblique secondary vortices. The similar structures have been found by Schlatter et al. [4] in DNS simulation of flow around an airfoil. However the Reynolds number was considerably higher in this case.
4 Conclusions
The flow structure of the boundary layer is found to be pretty 2D as for statistical characteristics, the mean velocity field is free of stationary vortices. The fluctuation part of the velocity field is close to well-developed turbulence i.e. homogeneous in spanwise direction and not very far from isotropy state. As for topology, no explicit streamwise oriented vortical structures have been detected, the oblique structures with relatively short length were found instead. The vorticity component perpendicular to the airfoil surface is not negligible.
The structure of the turbulence within the boundary layer on the suction side of an airfoil has to be subjected to further analysis.
The experimental study was performed in a very low Reynolds number, about 33 thousands.
This work was supported by the Grant Agency of the Czech Republic, project No. 17-01088S.
References
1. J. Hoffman, C. Johnson, The Mathematical Secret of Flight, Normat 57, 4, pp.1–25, (2009)
2. J. Hoffman, C. Johnson, Resolution of d’Alembert’s paradox, J. Math. Fluid Mech., 12 (3), pp.321-334, (2010)
3. P. Procházka, V. Uruba, V. Skála, Evolution of vortical structures behind an inclined flat plate,
MATEC Web of Conferences 168 (2018) Article number 05003
4. P. Schlatter, Q. Li, R. Örlü, F. Hussain, D.S. Henningson, On the near-wall vortical structures at moderate Reynolds numbers, European Journal of Mechanics B/Fluids48 (2014) 75–93
5. J.H. Silvestrini, E. Lamballais, M. Lesieur, Spectral-dynamic model for LES of free and wall shear flows, International Journal of Heat and Fluid Flow 19 (1998) 492-504
6. V. Uruba, Near Wake Dynamics around a Vibrating Airfoil by Means of PIV and Oscillation Pattern Decomposition at Reynolds Number of 65 000,
Journal of Fluids and Structures, 55, pp. 372-383 (2015)
7. V. Uruba, Decomposition methods in turbulent research, EFM11, EPJ Web of Conferences, 25 01095 (2012)
8. V. Uruba, P. Procházka, V. Skála, On 3D Flow Structure of the Boundary Layer on the Suction Side of a Plate, EPJ Web of Conferences 180 (2018) Article number 02112
9. V. Uruba, D. Pavlik, P. Prochazka, V. Skala, V. Kopecky, On 3D flow-structures behind an inclined plate, EPJ Web of Conferences 143 (2017) Article Number UNSP 02137