DNA POLYMORPHISM DETECTABLE
BY
RESTRICTION ENDONUCLEASESMASATOSHI NE1 A N D FUMIO TAJIMA
Center for Demographic and Population Genetics, University of Texas at Houston, Houston, Texas 77025
Manuscript received July 21, 1980 Revised copy received December 12, 1980
ABSTRACT
Data on DNA polymorphisms detected by restriction endonucleases are rapidly accumulating. With the aim of analyzing these data, several different measures of nucleon (DNA segment) diversity within and between popula- tions are proposed, and statistical methods f o r estimating these quantities are developed. These statistical methods are applicable to both nuclear and non- nuclear DNAs. When evolutionary change of nucleons occurs mainly by mu- tation and genetic drift, all the measures can be expressed in terms of the product of mutation rate per nucleon and effective population size. A method f o r estimating nucleotide diversity from nucleon diversity is also presented under certain assumptions. It is shown that DNA divergence between two populations can be studied either by the average number of restriction site differences or by the average number of nucleotide differences. In either case, a large number of different restriction enzymes should be used for studying phylogenetic relationships among related organisms, since the effect of stochas- tic factors on these quantities is very large. The statistical methods developed have been applied to data of SHAH and LANGLEY on mitochondrial (mt)DNA from Drosophila melanogaster, simulans and uirilis. This application has suggested that the evolutionary change of mtDNA in higher animals occurs mainly by nucleotide substitution rather than by deletion and insertion. The evolutionary distances among the three species have also been estimated.
I N recent years, an increasing number of authors have examined genetic varia- tion of DNA by means of restriction endonucleases. Although this technique does not necessarily detect all genetic variation of DNA, it is much simpler than complete DNA sequencing and thus has a great utility for population genetics and evolutionary studies. Application of this technique to initochondrial DNA has already generated important information on the rate of nucleotide substitution in evolution and genetic structure of populations (UPHOLT and DAWID 1977; LEVINGS and PRING 1977; AVISE, LANSMAN and SHADE 1979; BROWN, GEORGE and WILSON 1979; SHAH and LANGLEY 1979). The study of nuclear DNA by means of restriction enzymes requires additional techniques such as DNA cloning, so that the progress has been slower. Yet, KAN and DOZY (1978) have identified the restriction-site polymorphism of the /.?-globin gene region in man and success- fully applied the polymorphism to genetic counseling with respect to sickle-cell anemia. Furthermore, BOTSTEIN et al. (1980) have initiated an ambitious project
146 M . NE1 A N D F. TAJIMA
for detecting DNA polymorphisms with the aim of constructing a detailed human linkage map.
For the analysis of data generated by these works, new statistical methods are required. Such methods have already been studied by UPHOLT (1977),
NEI
andLI
(1979), KAPLAN andLANGLEY
(1979) and GOTOH et al. (1979) with respect tothe measurement of DNA divergence among different species or populations. However, the theory pertaining to DNA polymorphism within populations is still insufficient. Particularly, the relationship between restriction-site polymor- phism and nucleotide polymorphism is not well established. The relationship be- tween DNA divergence and polymorphism is a h not clear. In this paper, we shall study these relationships in detail and present some statistical methods for estimating important genetic parameters. We shall present some data analyses to illustrate the methods developed.
MUTATION RATE PER NUCLEON
Nomenclature: Before going into the detail, we would like to introduce two new technical terms to avoid cumbersome descriptive phrases such as “restriction fragment length polymorphism” used by BOTSTEIN et al. (1980). I n the study of DNA polymorphism, a given segment of DNA is often identified, and the poly- morphism of this segment is investigated. Such a segment is sometimes quite long (often about 20 kilobases) and includes many structural genes; whereas, in other cases, it may include only a part of one gene. Furthermore, on some occasions, the DNA segment may include only a noncoding region. I n this paper, any seg- ment of DNA will be called a nucleon. In physics, this word has been used to indi- cate a particle of the atomic nucleus, such as a proton or neutron. To our knowl- edge, however, this word has not been used in biology. Each nucleon is character- ized by the restriction-site map or the number and lengths of DNA fragments. Different restriction-site patterns for a given nucleon are called nucleomorphs. Nucleomorphs correspond to allelomorphs or alleles at a locus in classical ge- netics; whereas, nucleons correspond to genes. Two nucleomorphs that differ at the nucleotide level may be regarded as the same when only a small number of restriction enzymes are used. However, as long as the same set of restriction enzymes are used, the nucleomorphs are the unit of polymorphism.
Mitochondrial
DNA:
Mitochondrial DNA (mtDNA) is circular, and the entire DNA molecule is usually used as a nucleon in studies of mtDNA polymorphisms (AVISE, LANSMAN and SHADE 1979; BROWN 1980). In some cases, however, the nucleon studied represents a part of the DNA (SHAH and LANGLEY 1979). Let mT be the total number of nucleotides in a nucleon and gl, g2, g3 and g4 be the fre- quencies of guanines (G),
cytosines (C),
adenines (A) and thymines (T) in the 5’-3’ strand of the nucleon. We assume that mutational changes among the four nucleotides are balanced, so that gi remains constant (see APPENDIX). We alsoassume that all nucleotides are randomly distributed in the nucleon, so that the expected frequency of restriction sites with r nucleotide pairs is given by
where rl, r2, r3 and r4 are the numbers of nucleotides G,
C,
A and T in the restric- tion site. Since a is generally small, the number of restriction sites per nucleon ( m ) will be distributed approximately as a Poisson variate with mean E ( m ) =mTa.
The number and locations of restriction sites in a nucleon change when one or more of the existing sites are lost or new sites are created by mutation. W e as- sume that all mutational changes of DNA occur by nucleotide substitution. The effect of insertion or deletion will be considered later. Let pl, p2, p 3 and p4 be the rates of mutation of nucleotides G, C, A and T to other nucleotides, respectively, per host generation. The probability of loss of a restriction site by mutation is therefore
1 - ( 1 - p l ) ~ l ( l - p 2 ) ~ ~ [ l - p 3 ) ~ 8 ( 1 - p 4 ) ~ 4
ripl
+
r Z p 2+
r 3 p 3+
r4pa = r p,
( 2 ) where fi is the weighted mean of mutation rates per nucleotide site. Therefore, unless the mutation rate is the same for all nucleotides, p depends on the type of restriction enzyme usd. At any rate, when there are m restriction sites in a nucleon, the total probability of loss of at least one restriction site is 1-
(1-
rp)" mrp. Since the expected value of m is mTa, this probability may be written as mTarp. At steady state, the probability of appearance of new restriction sites must be equal to the probability of loss. Indeed, this can be proved mathematically, as shown in the APPENDIX. Therefore, the probability of mutational change ofrestriction-site sequence or nucleomorph is
~ Z 2 m ~ a i - p
.
(3)In the case of linear nucleons, the total number of sequences of r nucleotides is mT - r
3-
1, but since mT is generally very large, formula (3) still applies ap- proximately. KAPLAN and LANGLEY (1979) derived a formula equivalent to (3),but their formula is much more complicated because of the different assumptions they made (see APPENDIX).
Nucleon polymorphisms are generally studied by using several different re- striction enzymes. When s such enzymes are used, the mutation rate per nucleon is given by
8 8
-U = 2mT, 2 = 2mT 0=1 ,2 scrip
,
(4)where ai, ri and pi are the values of a, r and p for the ith enzyme, respectively, and
2=1
- 8
is the weighted mean of p+, i.e., p = .E airifii/
,:
aOr%..8=1 0=1
148 M. NE1 A N D F. TAJIMA
TABLE 1
Examples of uaricus types of restriction enzymes, expected frequency of restriction sites (a), the mutation rate per site (rp) and the mutation rate per nucleon (v)
Enzyme
4-base
HaeIII [GGCC] MboI [GATC]
EcoRII [CC($)GG] HinfI [GANTC]
BamHI [ GGATCC] EcoRI [ GAATTC] Hue1 [($)GGCC(:)] Hind11 [GTPyPuAC]
SmaI [CCCGGG]
5-base
6-base
3.9
x
10-3 3.9x 10⁻³
1.0
x 10-4
1.6
x
10-32.0
x
IC-3 3.9x 10⁻³
8.0
x 10-5
1.6 x 10⁻³
2.4
x
10-49.8
x
1 0 4 9.8x
10-4 2.4x
1 0 41.6 x 10⁻⁵
6.4
x
10-5 4.0x 10⁻⁴
1.0
x
iw
2.4
x
1 F 2.6x
le450% 5%
4 6 . 9 ~ 4 6 . 9 ~ 1 6 6 . 7 ~ 1 6 6 . 7 ~ 46.98
12.8p 2 0 4 . 8 ~
11.9p 2 0 4 . 8 ~
3 . 1 ~ 4 9 . 2 ~ 10.9.u 6 8 . 3 ~
0.2P
A nucleon is assumed to consist of 16000 nucleotides.
* (1) g, = g, = g, .= gT .= 0.25.
1-
( 2 ) g, '= g, = 0.1, ga = g, = 0.4.different sequences, i.e., AGGCCT, AGGCCA, TGGCCT and TGGCCA. Under the assumption of random nucleotide distribution, the a value for this enzyme is
Any mutation in the second to fifth nucleotide sites results in the loss of the restriction site, but the mutation at the first and sixth positions does so only with a certain probability. If we assume that, once mutation occurs, it is equally likely to be to any of the other three nucleotides, this probability is 2/3. Therefore, the probability of loss of existing restriction sites is approximately 2fi1 -I- ~ J L ,
+
2 2
-p3 -I- -p4, which is equal to (16/3)p, where p is the weighted mean of the
3 3
mutation rates. Thus, if we define r = 16/3, formula
(4)
can be used. The values of a and r for other types of restriction enzymes are given in Table 1.In the above formulation, we assumed that the frequencies of nucleotides G, C, A and T are known. Unfortunately, this information is not always available. However, the value of mTa can be estimated by the observed number of restriction sites for a given enzyme. Therefore, the mutation rate per nucleon may be related to the average mutation rate per nucleotide
(6)
bya = (g3+gi)Zg:g;
.
Nuclear
D N A :
The polymorphism of nuclear DNA is studied in two different ways. One way is to extract and clone a nucleon from the genome by recombinant DNA techniques and digest the cloned nucleon by restriction enzymes. (In this case, the cloned nucleon is generally linear, but the above theory directly applies unless the nucleon is very small.) The other is first to digest the entire DNA of an organism and then separate the different DNA fragment lengths by electro- phoresis. The fragment that is homologous to a particular nucleon is then identi- fied by using a DNA probe (BOTSTEIN et al. 1980). The DNA probe is the same piece of DNA as the nucleon under investigation, but labeled with a radioactive isotope. I n this case, any fragment that is partially or wholly homologous to the nucleon can be detected, as seen from Figure 1. It is clear that in this case nucleo- morphs that have one or more restriction sites in the nucleon region will be picked up. The nucleomorphs that have no restriction sites in this region, but cover the entire region, will also be picked up, since they are homologous to the nucleon. Therefore, all nucleomorphs detected by this method refer to the genetic variation of the nucleon under investigation, even though some fragments may include DNA from outside the nucleon region. Thus, the above theory again applies.Efjects of deletion and insertion: The nucleotide sequence of DNA often changes due to deletion and insertion, particularly in noncoding regions of DNA. In higher animals, most changes of mitochondrial DNA seem to result from nucleotide substitution, but, in nuclear DNA, deletion and insertion play an im- portant role. These deletions and insertions are considered generally to result from unequal crossing over, but it is not easy to make a precise formulation of the effects of deletion and insertion on DNA polymorphism, since the pattern of DNA change due to these events is not well understood. However, recent data on nucleo- tide sequences of the globin family genes suggest that the number of nucleotides involved in each event of deletion and insertion is relatively small and that these events occur recurrently (e.g., EFSTRATTADIS et al. 1980). If this observation is general, the change in the restriction site pattern or nucleomorph due to deletion or insertion would occur roughly at a constant rate per generation. In this case, the nucleon polymorphism can be studied in the same way as that due to nucleo- tide substitution. I n this case, U simply represents this mutation rate per nucleon per generation.
I n addition to nucleotide substitution, deletion and insertion, usual recombi- nation may also change the nucleotide sequence of DNA. However, the effect of recombination seems to be small, as long as a nucleon of about 2.0 kilobases or less is studied.
Probe DNA
1 I I A I
-
-
A3A2 Nucleomorphs
150 M. NE1 A N D F. T A J I M A
GENETIC V A R I A T I O N WITHIN POPULATIONS
Nucleon diversity: Suppose that there are 1 nucleomorphs at a given nucleon site in DNA in a population and let p i be the frequency of the ith nucleomorph. By analogy to heterozygosity or gene diversity (NEI 1975), we can define the nucleon diversity by
h = l -
In randomly mating diploid organisms, h for nuclear DNA is equal to hetero- zygosity. Mitochondrial DNAs are maternally inherited, and in mammals there is little genetic heterogeneity among mtDNAs in one host individual (UPHOLT and DAWID 1977), but it is still a good measure of genetic variation among host individuals. Suppose that, at this nucleon site, a sample of n nucleons is drawn from this population, and the sample frequency of the ith nucleomorph is xi. Then the nucleon diversity may be estimated by
h = n ( l - ( 7 )
The sampling variance of can be computed by the same formula as that for gene diversity (NEI 1978).
In
addition to the sampling errors at the time of nucleon sampling,h
is subject to random variation due to stochastic changes of gene frequencies. If we assume no selection, the mean and variance of h over the stochastic process are H =M /
(1 -t
M )
andV (
h) = 2 M / ( 13- M ) z
(2+
M ) (3+
M )
,
respectively ( WATTER-SON 1974; LI and NEI 1975; STEWART 1976). Here
M
= 4N,v, where N e and U de-note the effective population size and the mutation rate per nucleon, respectively. It is therefore clear that nucleon diversity depends on the mutation rate. which in turn depends on the types and numbers of restriction enzymes used. As an exam- ple, suppose that gl = gz = gs = ga and that application of EcoRI gives H = 0.091, with 4N,v = 0.1. Then application of NaeIII is expected to give H = 0.516 with
4 N , v = 1.066 (see Table 1). In this connection, one might wish to estimate the value of 4N,v under the assumption of neutral mutations by equating the observed diversity to its expectation, i.e., using the relationship h = M / ( 1 -t- M ) or
M
=h / ( 1
-
h )
.
However, it is known that this method overestimates 4Neu, unless a large number of nucleon sites are used and H is estimated by the average ofh
over all sites (ZOUROS 1979). According to EWENS (1972), a better estimate of4N,v may be obtained from the number of nucleomorphs in the sample, as long as all nucleomorphs are selectively neutral.
Number of nucleomorphs: The extent of nucleon polymorphism can also be studied in terms of the number of nucleomorphs. The number of nucleomorphs in a sample is, however, highly dependent on the sample size. I f we use the infinite-allele model of neutral mutations, the expected nrimber of nucleomorphs
DNA
151
M M
M
M M + l M + n - 1
E (
k)
=-
,+
~+
*.
.
+
-
(EWENS 1972). Thus, E ( k ) increases as n increases. For example, i n the case of M = 0.5, n = 10 gives E ( k ) = 2.5, but n = 50 gives
E ( k )
= 3.3. E ( k ) also de- pends on the M value, which in turn depends on the types and numbers of re- striction enzymes used. For example, in the case of n = 50, M = 0.1 gives E ( k ) = 1.5; whereas, M = 0.5 givesE (
k)
= 3.3. A detailed numerical relationship amongE
(k)
,
n and M is given byEWENS
( 1972). In general, it is more efficient to in- crease M than to increase n in order to detect more nucleomorphs. As mentioned earlier, it is possible to estimate M from the number of nucleomorphs.EWENS
(1972) gives a table for obtaining a maximum likelihood estimate (&Z) of M and the stochastic variance ofM .
Mean number of restriction-site diflerences: Another measure of nucleon vari- ation is the mean number of restriction-site differences between two randomly chosen nucleons. This number is defined as
V I =
Z
pipjvij 3 (9)1.3
where vil is the number of restriction-site differences between the ith and jth nucleomorphs and summa tion is taken over all combinations of nucleomorphs. Note v i i = 0. Since the expectation of xixj (i#j) is pipj (1
-
l / n ) , Y may beestimated from sample nucleomorph frequencies estimator.
by .the following unbiased
(10)
h
The sampling variance of v for given values of pi is obtained by considering the multinomial sampling of nucleomorphs. It becomes
When there are only two types of nucleomorphs, (1 1) reduces to
152 M. NE1 A N D F. T A J I M A
GRIFFITHS 1980). At any rate, if we use this model, the mean [ E ( v ) ] and vari- ance [
V
( v ) ] of v are given byE ( v )
= M ,
(13) V ( v ) =M
+
M’
(14)(WATTERSON
1975). It is known that (13) is not affected by recombination within the nucleon (KIMURA 1969). Since (IO) is an unbiased estimate of M , it is obvious that (13) is better for estimatingM
than using the formula M =Number of segregating restriction sites: A quantity closely related to v is the number of segregating restriction sites, i.e., the number of restriction sites that are polymorphic in a sample of n nucleons. If we use
WATTERSON’S
(1975) infinite-site model, the mean [ E ( K ) ] and variance [ V ( K ) ] of this number ( K )over the stochastic process become A/(1 -
A ) .
E ( ~ ) ~ M [ 1 f 1 / 2 f 1 / 3 + ~ ~ ~ ( ~ ~ l ) ~ 1 ] , (16)
Therefore, it is possible to estimate
M
from this number. However, it is interesting to see that V ( K ) / E ( K ) is smaller than V ( V ) / E ( v ).
Nucleotide diversity: I n the above statistical methods, the genetic variability of nucleons was related to the mutation rate per nucleon or 4N,v. Therefore, whether the evolutionary change of restriction sites occurs by nucleotide substi- tution or by insertion and deletion, the above theories are applicable, as long as the mutation rate per nucleon remains the same. However, when evolutionary change of restriction sites occurs mainly by nucleotide substitution, 4N,v is not a fundamental parameter, since the mutation rate ( U ) depends on the kind and number of restriction enzymes used. Only when the same kind and same number of restriction enzymes are used can estimates of these parameters be compared between different nucleon sites or different organisms.
A more fundamental measure of
DNA
polymorphism is the proportion of dif- ferent nucleotides between two randomly chosen nucleomorphs (the number of nucleotide differences per nucleotide site). NEI and LI (1979) have called this nucleotide diversity. Since the genetic variability is measured per nucleotide site in this case, it can be used for comparing any pair of nucleon sites o r organisms. NEI and LI showed how to estimate the number of nucleotide differences be- tween a pair of nucleomorphs from data on the proportion of shared restriction sites(8)
or of shared restriction fragments(k).
For example, if restriction-site maps are available, the number of nucleotide differences per site ( q j ) betweenthe ith and jth nucleomorphs may be estimated either by (-lnk)/r or by - (3/2) 1n[(4&/2‘ - 1)/3] (formulae (8) and (9) in NEI and LI 1979), where r is the value given in Table 1. They defined the nucleotide diversity ( x ) by
7r = I: pipprij
,
(17)DNA
153
wherep i
is the population frequency of the ith nucleomorph. I n practice, how- ever, the number of nucleons sampled (n) is often very small. In this case the expectation of Z x.x.T.. becomesizj
p i p i x i j (1-
l/n). Therefore, T in( 17) should be estimated by
ifi
2.3where :<j is the estimate of T C ~ . If we assume that T i i is a constant, the sampling
variance of f, is given by (1 1 )
,
replacing v i j by T C ~ .I n practice, the estimate ~ iis subject to stochastic errors in the evolutionary j
process, and the variance of $ i j can be computed by the method of NEI and LI (1979). Unfortunately, there were computational errors in their formula. The variance of the estimate
(i)
of S should beA A
(19)
A 1 . 1
V(S) =-. [ S ( 1 4 ) - 3 2 (1 -&Z){l f - (1 - S 1 / 2 ) } ]
,
m 2
A
where
Z-
= (mi f mj)/2. Using this value, the variance of ~ i i = - (ln$)/r (;inNEI and LI'S paper) is given by
When ~ iis estimated by -(3/2)ln[ j (4&lzT-- 1)/3], it becomes
V&) = [ 9 i ~ / ~ V ( $ j / [ 4 i W Z T - l ) r i ] 2 (21)
instead of (14) in NEI and LI (1979).
If we assume that the population is in equilibrium and the infinite-site model of neutral mutation applies, the nucleotide diversity can be related to the popu- lation size and mutation rate. Namely, E ( T )
'=LEN,;,
where is the average mutation rate per nucleotide site. Therefore, if there is no effect of insertion and deletion, T can be estimated by 1/(2,;
miri) of M from (5). This relation-ship may be used for testing whether or not the underlying assumptions are satisfied.
L = l
GENETIC VARIATION BETWEEN POPULATIONS
As in the case of genetic variation within populations, the mathematical theory of interpopulational genetic variation based on the infinite-allele model can be directly applied to data on restriction-site variation, as long as the varia- tion is identified at the nucleomorph level. Thus, NEI'S (1972, 1973) theories
154
M. NE1 AND F. TAJIMArestriction-site differences between nucleomorphs gives additional information about the interpopulational differentiation of
DNA among populations.
Restriction-site differences between populations: Let pi and qi be the fre- quencies of the ith nucleomorph in populations
X
andY ,
respectively. Then, the mean number of restriction-site differences between two randomly chosen nucleomorphs, one each from population X and Y , isV X Y =
5
piqjvij 7 (22)where vi$ ,= 0. If the sample frequencies of the ith nucleomorph are xi and yi
in populations X and Y , respectively, this number may be estimated by A
VXY = Z Xiyjvij
.
This number, however, includes the restriction-site differences within popula- tions when there is polymorphism. The number of restriction-site differences within populations can be estimated by (IO). Therefore, the number of net restriction-site differences between the two populations is estimated by
(23)
h h A
where vX and vP are the value of v given by
(IO)
in populationsX
andY ,
respec- tively. When the two populations are closely related and n is small,d
may become negative.The sampling variance of
d
is given by1 A A A A
-
-
[COV(VXP, vx)+
cov(vxY7 VY)l,
2where
A
cov < t X Y , VX) = 2 [
.z
. PiPjqkVijVik z # 3 k-
(QiPjVij) (zpiqjvij)I/%
7 (27)A h
cov(VxY, VY) '= 2[ . E . 2 qiqjpkvijvik 2 2 3 k
-
(zpiqjvij) ( ~ q i q ~ i i ) l l n ~,
(28) and V ( t x ) andV ( & )
are given by (11).populations. As mentioned earlier, the expectations of v X end v y are approximately
M ,
assuming the sameN e
for the two populations. On the other hand, v x y is the mean of mxf
my-
emxy for all pairs of nucleomorphs, where mx and my are the numbers of restriction sites of a nucleomorph from populations X and Y ,respectively, and mxy is the number of restriction sites that are shared by the pair of nucleomorphs. In equilibrium populations, the expectation of mx or my is mra; whereas, the expectation of mxy is moc2rht, where h is the rate of nucleo- tide substitution per generation (or per year depending on the definition) and m, is the value of m at t = 0
(NEI
and LI 1979). In the absence of selection, h is equal toi.
If
we note that E ( v X y ) = E ( v x ) =M
at time 0 and assume that all nucleomorphs are neutral, we have(29)
(30)
E ( v X Y ) =
M
4-
(2mTa-
M )
(1-
e-2rzt),
E ( v x y ) = M
4-
20t which becomesapproximately if 2rFt Q 1, since U = 2mTarii. Therefore, for a relatively short
period of time,
d
is expected to increase linearly with time.However,
2
has a large stochastic variance in addition to the sampling variance given by (25). Particularly when v X y is close to 2mTa, its relationship with t is expected to be poor. I n this case, NEI and LI’S (1979) method of relating the number of nucleotide substitutions to divergence time should be used with the modi€ication of their variance formula given in (20) of this paper.When a population is subdivided into many subpopulations, it is often im- portant to partition the total genetic variation into the variation within and between subpopulations. This can be done by applying NEI’S (1973) method of gene diversity analysis either to nucleon diversity data or to data on the number of restriction-site differences. In the analysis of the latter data,
Dij,
H i j ,Hi
andH j in NEI’S (1973) formula (6) should be replaced by d i j , vi!, v i and vj, respec-
tively, where i and
i
each stand for the ith and jth populations.Some of the statistics proposed in this paper require an extensive computa- tion, and we have developed a computer program, a copy of which is available by request.
NUMERICAL EXAMPLE
SHAH and
LANGLEY
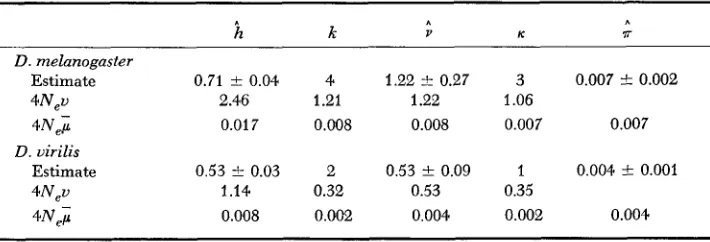
(1979) studied the genetic variability of mtDNA in Drosophila melanogaster, simulans and virilis by using restriction endonucleases HueIII, HpuII, EcoRI and HindIII. They identified seven nucleomorphs, and the frequencies of these nucleomorphs are given for each species in Table 2. I n D. simulans, only five nucleons were sampled, and no polymorphism was found. Intraspecific variation: In D. melunogaster, there were four nucleomorphs, and the estimate of nucleon diversity( A )
is 0.71 k 0.04 (Table 3 ) . From this156 M. NE1 AND F. TAJIMA
TABLE 2
Nucleomorph frequencies in mtDNA samples from three species of Drosophila
D . melanogaster 0.1 0.3 0.5 0.1 10
D . simulans 1
.o
5D. uirilis 0.6 0.4 10
t
n = sample size.the estimate obtained from nucleon diversity. This difference apparently oc- curred because nucleon diversity tends to give an overestimate, as mentioned earlier. In this connection it should be noted that mitochondria are maternally inherited, so that the effective population size is 1/4 that for nuclear genes if the sex ratio is 1: 1.
To compute the mean number of restriction-site differences, it is convenient to make a table of the number of restriction-site differences ( v i j ) for each pair
of nucleomorphs (Table 4). The numbers of restriction-site differences in Table 4
are obtainable from the restriction-site maps for nucleomorphs given in SHAH and
LANGLEY’S
Figure 1. From the values of v i j forD.
melanogaster in Table4,
we obtain = 1.22 by using (10). Under the assumption of neutral nucleomorphs, this is an estimate of 4Nev. Interestingly, it is close to the estimate obtained from the number of nucleomorphs.The nucleon polymorphism in
D.
mdanogaster is caused by the polymorphism (segregation) at three restriction sites (SHAH and LANGLEY’S Figure 1) ; namely,K = 3 in this species. Therefore, if we equate this number to the expectation in
!
lS),
we have 3 = 2.83M, since n = 10. Therefore, we have another estimate ofk
= 1.06, which is close to the estimates fromk
and v . This agreement suggests that the change of mtDNA occurs mainly through nucleotide substitution. (In many Drosophila species, mtDNA contains a large A-T-rich segment, but inA
TABLE 3
Nucleon diversity
(h),
number of nucleomorphs (k), average number of restriction-site differences (;), number of segregating sites ( I C ) , and nucleotide diversity (7) inD. melanogaster and D. virilis
i2
k V K 7rD. melanogaster
Estimate 0.71 k 0.04 4
4 N i 0.01 7 0.008
Estimate 0.53 t 0.03 2
4 N e v 1.14 0.32
4Neu 2.46 1.21
D. uirilis
4N,i 0.008 0.002
1.22 t 0.27 3 0.007 -t 0.002 1.22 1.06
0.008 0.007 0.007
0.53 t 0.09 1 0.004 t 0.001
0.53 0.35
$,
Nucleoniorph n m, ml, mc S U Ud
m 1 1 1 11 13 14
0.94 2 2 10 12 13
mu
1 .oo
2 12 14 15
0.94. 0.94
mC 1.00 0.94 1.00 12 14 15
0.w 0.94 0.89
S 0.40 0.43 0.40 0.40 14 15
0.84 0.84 0.80 0.80
V 0.17 0.18 0.17 0.17 0.22 1
0.71 0.71 0.67 0.67 0.59
mb 1.00 0.94.
U d 0.17 0.18 0.17 0.17 0.22 1.00
0.67 0.67 0.63 0.63 0.56 0.92
The figures above the diagonal are the restriction-site differences; those below are the Sii
values. The upper
5,
value for each pair of nucleomorphs is for HsleIII and HpaII ( r I= 4) ; whereas, the lower S i f value is for EcoRI and HindIII ( r ' = 6).D.
virilis this segment is deleted. However, since there are no restriction sites f o r the four enzymes used in this segment inD.
melanogaster andD.
simulans, the evolutionary change in this segment can be disregarded. Furthermore, this type of deletion or addition seems to be rare in the mtDNA's of higher animals(BROWN, GEORGE and WILSON 1979).
Let us now relate 4Np to 4N$ under the assumption that all evolutionary changes in these species occurred by nucleotide substitution. The average num- ber of restriction sites for HaeIII, HpalI, HindIII and EcoRI for the four nucleomorphs of
D.
melanogaster are 3.7,4,
4.6 and 4, respectively. Therefore, the estimate of u is U = 2Zmi7-i; = 164.8;. Similarly, we obtain U ( = 180i forD.
simulans and^U
= 1 0 0 . 8 ~ forD.
virilis. The average of these estimates is 149;. In this connection, it should be noted that the G + C content of mtDNA in Drosophila is about 0.22 even if the A-T-rich region is excluded (KAPLAN and LANGLEY 1979), and thus Had11 and HpaII do not produce many restriction sites. At any rate, if we use the relationship U = 149;, the estimates of 4Ne; can be obtained from the 4N,v value. They are about 0.008, though the estimate obtained from nucleon diversity is two times larger. The latter value is, however, probsbly an overestimate for the reason mentioned earlier.To estimate the nucleotide diversity, T , we must first compute the proportion
of shared restriction sites for each pair of nucleomorphs by using the formula
hij = 2mii/(mi
4-
m i ) , where mi and m j are the numbers of restriction sites forthe ith and jth nucleomorphs, respectively, and mii is the number of shared
158 M. NE1 AND F. TAJIMA
restriction sites (NEI and LI 1979). Then, the estimate of ~ - $ j is given by
$ij = (-- lnSij)/r. When more than one enzyme with the same r value is used,
Sij should be computed by pooling mi, mj and mij over all enzymes; but, if r is not the same, they should be computed separately. In Table 4,
Sij
values are given separately for HaeIII and HpaII (r = 4 ) and for EcoRI and Hind111 (r = 6 ) . From these values, x can be computed in the same way as v is computed. I nD.
melanogaster it becomes 0.0061 for enzymes with r = 4 and 0.0076 for enzymes with r = 6, the average being 0.007. This value is another estimate of 4NeF and close to the other estimates.I n
D.
virilis, the same computations were done, and the results obtained are given in Table 3. It is clear that all estimates of genetic variability in this species are smaller than those inD.
melanogaster, and the estimates of 4N$ are again more-or-less the same, except the estimate from nucleon diversity. This result suggests that the mtDNA inD.
virilis is less variable than that inD.
melano- gaster. However, since the number of nucleons sampled and the restriction enzymes used are both small, a more extensive study should be done before any definite conclusion is derived. I n this connection, it should be noted that the standard errors given in Table 3 are those for nucleon sampling, and the standard errors arising from the stochastic process in the evolutionary process are much larger than these. For example, thet
value f o rD.
melanogaster is 1.22. There- fore, the stochastic standard error under the assumption of neutral mutations is (1.22-k 1.222)1/2 = 1.6 from (14). This is larger than the estimate itself. Similarly, the stochastic standard error of forD.
virilis is 0.90, compared with the estimate of 0.53. Therefore, if we use these standard errors, the difference in v between the two species is not statistically significant. To reduce the stan- dard error relative to the estimate, it is necessary to use a large number of restriction enzymes.Znterspecific variation: The number of net restriction-site differences between species can be computed from the v i j matrix given in Table 4 by using (24). Noting that v for
D.
simulans is 0, we obtain&,
= 10.7*
0.3 as a value ofd between
D.
melanogaster andD.
simulans. Similarly, the values f o r the pairs of melanogaster-virilis and simulans-virilis are dmv = 12.8*
0.4 and d,, =14.1 0.1, respectively. Note that the standard error given here includes only that due to nucleon sampling; the stochastic error is much larger than this. At any rate, the sibling species, melanogaster and simulans, show the smallest value, as expected. However, considering the morphological differences between uirilis and the melanogaster-simulans complex, the d values for the other two pairs seem to be too small. This is apparently due to the fact that d is not a good measure of genetic distance when it is large, as mentioned earlier.
A better estimate of interspecific genetic distance is provided by formula (25) of
NEI
and LI (1979), i.e.,A A
A
A
DNA
POLYMORPHISM 159 tween the two species. We must again compute6
for the enzymes with r 8 = 4 and r = 6 separately and take the average. It can be obtained from the $6 values given in Table 4. I n the comparison ofD.
m e h o g a s t e r withD.
simularzsb
becomes 0.2204*
0.0031 for the 4-base enzymes and 0.0300*
0.0017 for the 6-base enzymes. The standard error given here is that due to immediate sampling of nucleons and is much smaller than the estimate itself. This error seems to be important only when two closely related populations are compared. On the other hand, the stochastic standard error increases with increasing 6 and is much larger than the sampling variance when 6 is large.Computation of the total variance of
6,
including both sampling and stochastic variances, is very complicated. However, in interspecific comparisons rxy in 6are generally much larger than or
&.
Therefore, the variance ofs^
is largely due to the variance of rxy. Furthermore, the variance of v X y is approximately given by (20) if we replace S by the weighted average(3)
of8ij
for all nucleo- morph comparisons between two species. In the present cases
becomes 0.4086 for the 4-base enzymes and 0.8168 for the 6-base enzymes. The former value has a standard error of 0.0932, the latter 0.0187. Obviously, these are minimum standard errors, but they are much larger than the sampling standard errors.If
we use these stochastic standard errors, the normal deliate for the difference between the 4-base and 6-base enzymes is (0.2204-
0.0300)/[0.0932'+
0.01872]1/2 = 2.0, which barely reaches the5%
significance level. However, since our estimates of standard errors are minimum, it is possible that the differ- ence in$
between the 4-base and 6-base enzymes is due to stochastic errors. Indeed, in the remaining two species comparisons, the differences between the 4-base and 6-base enzymes were not statistically significant. At any rate, if we take the average ofs*
for the two types of enzymes, it becomes 0.1252 2 0.0672. This value is close toKAPLAN
and LANGLEY'S (1979) estimate (2; = 0.1302) by a different method.(KAPLAN
and LANGLEY eliminated the rRNA region, as well as the A-T-rich region, from their study.)We have done similar computations for the other two species comparisons. The average
d
value for melanogaster vs. uirilis was 0.2490*
0.1495; whereas, the value of simulans vs. uirilis was 0.2324*
0.1429. Thercfore, the genetic distance betweenD.
melanogaster andD.
simulans is about half the distances for the other species comparisons. Considering the morphological differences among the three species, however, the latter distances relative to the former still seem to be too small. To make a more definite conclusion, we must use a larger number of restriction enzymes.A
A
DISCUSSION
160 M. NE1 A N D F. T A J I M A
mean number of restriction sites among independent nucleons seems to agree roughly with the expected number ( m T s ) under the assumption of random dis- tribution. For example, in Drosophila the total number of mcleotides in mtDNA is about 14,000 (SHAH and LANGLEY 1979), excluding the A-T-rich region, and the G S C content is 0.22 (KAPLAN and LANGLEY 1979). Therefore, if we assume g G = gc and g A = g T , the expected number of restriction sites f o r Hue111 ( G W C )
and HpaII (CCGG) is mTu = 2.0. SHAH and LANGLEY list the number of restric- tion sites for these enzymes for each nucleomorph. If we use one nucleomorph (the most common one) from each species, the mean number is 2.83 f 0.48.
Similarly, the expected number of restriction sites for EcoRI (GAATTC) or Hind111 (AAGCTT) is 3.9; whereas, the observed number is 4.33
*
0.61. There- fore, the observed and expected numbers agree with each other fairly well. We have done a similar but more extensive analysis of human data, which indicated that the agreement between the observed and expected numbers is also reasonably good. This result will be published elsewhere.In our study we have implicitly assumed that all DNA fragments digested by restriction enzymes are identifiable by the experimental method used. I n practice, small fragments are often disregarded because of experimental difficulty (BROWN, GEORGE and WILSON 1979). I n these cases our theory should be modi- fied to some extent. However, the effect of elimination of small fragments is generally unimportant, as will be discussed in a separate paper.
Another assumption we have made in relating nucleon diversity to nucleotide diversity is that the rate of nucleotide substitution or mutation rate is the same for all nucleotide sites. This assumption apparently does not hold in general. There is evidence that the rate of nucleotide substitution varies considerably from gene to gene in a genome and from region to region in a gene (e.g., NEI 1975). However, when the number of nucleotide differences per nucleotide site is small, say less than 0.3, the assumption of equal rate does not lead to any serious error in the computation of average nucleotide differences (NEI and CHAKRABORTY 1976). I n practice, the average number of nucleotide differences per site between two randomly chosen nucleomorphs seems to be generally smaller than 0.1 within a species (Table 3 ; see also NEI and LI 1979). so that the present method for analyzing polymorphism within populations will not be seriously affected by our assumption. However, when the number of nucleotide differences between a pair of species is large, our formula (31) tends to give an underestimate of 8 = 2rXt (see NEI and LI 1979).
The study of polymorphism of nuclear DNA by means of restriction enzymes has just started, and there are not enough data to test the validity of our theory. I n nuclear DNA, however, deletion and insertion seem to be quite important. Therefore, DNA polymorphism should be studied in terms of nucleon diversity rather than in terms of nucleotide diversity, unless the nucleon studied refers only to the coding region.
APPENDIX
PROBABILITY OF PRODUCTION OF NEW RESTRICTION SITES BY MUTATION
Let g,, g,, g,+ and g , be the frequencies of nucleotides G, C, A and T in a nucleon consisting of a large number of nucleotides, respectively, and p I j be the mutation rate of the ith nucleotide to the jth nucleotide per generation. The total mutation rate of the ith nucleotide to the other nucleotides is then given by p 1 p , , for j#i. Let g he the vector of nucleotide frequencies
i n a generation, i.e., g = ( g , , g2, g,+, g , ) . If we assume no selection, the transition matrix for nucleotide state (i=1,2,3,4) is given by
This matrix is different from a similar matrix of KAPLAN and LANGLEY (1979), who assumed that the muts'ion rate is the same for all nucleotides, but once mutation occurs, each nucleotide changes to one of the other three nucleotides with a specific probability, Furthermore, they considered only the case where g , '= g, and g , = g,. Our matrix is more general than K~PLAN
and LANGLEY'S. At any rate, at steady state we have
g = gP. (A21
Namely, 4
gi=g.i ( l - - P i )
+
z g g p j i.
j =1
Therefore. j+i
As in the text, we consider a restriction-site sequence of r nucleotides and denote the num- bers of G, C, A and T in the restriction site by r l , r 2 , r g and r 4 , respectively. In the computatiorl of the probability of appearance of new restriction sites, we first note that in most cases new sites are formed from those DNA sequences in which one nucleotide is different from the re- striction-site sequence, since the probability of double and triple mutations i n a sequence of four to six nucleotides is extremely small. W e therefore ignore the case where multiple mutations produce a restriction site. The expected frequency of a sequence of r nucleotides that differs from the restriction-site sequence by one nucleotide is given by
a l = rlg2-1 g;?+l g$ g?
+
rlg>-l gl;: g>+' g?+
rlg2-l g> g;:, gr4+''f
r,g>+l g2-l gx:< g,>f r,g> g2-I g > f l g ) f ' ' . f T&? g> g>i-l g2-I
4 r 4
I,
where U i* given h j - (1). Since there are mT possible sequences of r nucleotides i n a circular DNA of m,, nucleotides, the total number of such sequences is m T a l . Therefore, the probability of appearance of new sites is
4 r. 4
4
= m y n a
izl
ri pi- mTarp.
-
This is identical with the probability of loss of restriction sites.
(from (A3))
162 M. NE1 AND F. T A J I M A
LITERATURE CITED
AVISE, J. C., R. A. LANSMAN and R. 0. SHADE, 1979 The use of restriction endonucleases to measure mitochondrial DNA sequence relatedness in natural populations. I. Population structure and evolution in the genus Peromyscus. Genetics 92: 279-295.
BOTSTEIN, D., R. L. WHITE, M. SKOLNICK and R. W. DAVIS, 1980 Construction of a genetic linkage map in man using restriction fragment length polymorphisms. Amer. J. Hum. Genet. 32: 314-331.
BROWN, W. M., 1976 Animal mitochondrial DNA. I. Intraspecific comparisons. 11. The fidelity of replication of mitochondrial DNA fragments grown as recombinant plasmids i n Esch- erichia coli. Ph.D. thesis. California Institute of Technology, Pasadena, California.
-,
1980 Polymorphism in mitochondrial DNA of humans as revealed by restriction endo- nuclease analysis. Proc. Natl. Acad. Sci. U.S. 77: 3605-3609.BROWN, W. M., M. GEORGE, JR. and A. C. WILSON, 1979 Rapid evolution of animal mito- chondrial DNA. Proc. Natl. Acad. Sci. U.S. 76: 1967-1971.
EFSTRATIADIS, A., J. W. POSAKONY, T. MANIATIS, R. M. LAWN, C. O'CONNELL, R. A. SPRITZ, J. K. DERIEL, B. G. FORGET, S. M. WEISSMAN, J. L. SLIGHTOM, A. E. BLECHL, 0. SMITHIES, F. E. BARALLE, C. C. SHOULDERS and N. J. PROUDFOOT, 1980 The structure and evolution of the human p-globin gene family. Cell 21: 653-668.
The sampling theory of selectively neutral alleles. Theoret. Popul. Biol.
An improved method for estimating sequence divergence between related DNAs from changes in restriction endo- nuclease cleavage sites. 5. Mol. Evol. 14: 301-310.
GRIFFITHS, R. C., 1980 Genetic identity between populations when mutation rates vary within and across loci. J. Math. Biol. (in press).
KAN, Y. W. and A. M. DOZY, 1978 Polymorphism of DNA sequence adjacent to human p-globin structural gene: relationship to sickle mutation. Proc. Natl. Acad. Sci. US. 7 5 : 5631-5635. KAPLAN, N. and C. H. LANGLEY, 1979 A new estimate of sequence divergence of mitochondrial
DNA using restriction endonuclease mappings. J. Mol. Evol. 13 : 295-304.
KIMURA, M., 1969 The number of heterozygous nucleotide sites maintained in a finite popula- tion due to steady flux of mutations. Genetics 61: 893-903.
LEVINGS, C. S. and D. R. PRING, 1977 Diversity of mitochondrial genomes among normal cyto- plasms of maize. J. Hered. 68: 350-354.
in a finite population. Genetics 8 5 : 331-337.
states. Genet. Res. 2 5 : 229-248. EWENS, W. J., 1972
GOTOH, O., J.-I. HAYASHI, H. YONEKAWA and Y. TAGASHIRA, 1979
3: 87-112.
LI. W.-H., 1977 Distribution of nucleotide differences between two randomly chosen cistrons
LI, W.-H. and M. NEI, 1975
NEI, M., 1972 -,
1973 Analysis of gene diversity in subdivided populations. Proc. Natl. Acad. Sci. U.S. 70: 3321-3323. -, 1975 Molecular Population Genetics and Euolution. North Holland, Amsterdam and New York.
-
, 1978 Estimation of average heterozygosity and genetic distance from a small number of individuals. Genetics 89: 583-590.Empirical relationship between the number of nucleotide substitutions and interspecific identity of amino acid sequences in some proteins. J. Mal. Evol. 7: 313-323.
Mathematical model for studying genetic variation in terms of restriction endonucleases. Proc. Natl. Acad. Sci. U.S. 76: 5269-5373.
Drift variances of heterozygosity and genetic distance in transient
Genetic distance between populations. Am. Naturalist 106: 283-292.
NEI, M. and A. CHAKRABORTY, 1976
DNA
163SHAH, D. M. and C. H. LANGLEY, 1979 Inter- and intraspecific variation i n restriction maps of Dromphila mitochondrial DNAs. Nature 281 : 696-699.
STEWART, F. M., 1976 Variability in the amount of heterozygosity maintained by neutral mu- tations. Theoret. Popul. Biol. 9: 188-201.
UPHOLT, W. B., 1977 Estimation of DNA sequence divergence from comparison of restriction endonuclease digests. Nucleic Acids Research 4 : 1257-1265.
UPHOLT, W. B. and I. B. DAWID, 1977 Mapping of mitochondrial DNA of individual sheep and goats: rapid evolution in the D loop region. Cell 11 : 571-583.
WATTERSON, G. A., 1974 Models for the logarithmic species abundance distributions. Theoret. Popul. Biol. 6: 217-250.
-
,
1975 On the number of segregating sites in genetical models without recombination. Theoret. Popul. Biol. 7: 256276.Mutation rates, population sizes and amounts of electrophoretic variation of enzyme loci in natural populations. Genetics 92: 623-6443.