A Model Simulating the Dynamics
of
Plant Mitochondrial Genomes
Anne Atlan’ and Denis Couvet
Laboratoire d’Evolution des Systimes Ginitiques CEFE-CNRS BP 5051, 34033 Montpellier Cedex, France
Manuscript received July 29, 1992 Accepted for publication May 14, 1993
ABSTRACT
Molecular evolution of the plant mitochondrial genome involves rearrangements due to the presence of highly recombining repeated sequences. As a result, this genome is composed of a set of molecules of various sizes that generate each other through recombination. The model presented simulates the evolution of various frequencies of the different types of molecules over successive cell cycles. It considers the mitochondrial genome as a population of circular molecules evolving through recombination, replication and random segregation. The model parameters are the rates of recom- bination of each sequence, the frequency of each type of recombination, the replication rates of the circles and the total amount of mitochondrial DNA per cell. This model demonstrates that high recombination rates lead to rapid deletions of sequences in the absence of selection. T h e frequency of deletion is dependent on the simulated reproductive mechanism. The conditions leading to reversible or irreversible rearrangements were also investigated.
D
URING the last decade, the plant mitochondrialgenome has been the object of an increasing amount of interest. This is illustrated by the large number of reviews on the subject (e.g., BENDICH 1985;
NEWTON 1988; LEVINGS and BROWN 1989; HANSON
1991; ANDRE, LEVY and WALBOT 1992). T h e plant mitochondrial genome differs from other cytoplasmic genomes in several ways. It is much larger and more variable in size than plant chloroplasts and than the animal, fungal or protozoan mitochondria. Its size varies from 200 kb in Brassicae (PALMER and HERBON
1987) to 2500 kb in watermelon (WARD, ANDERSON
and BENDICH 1981). However, little variability has
been found in DNA sequences since the evolution of nucleotide sequences is very slow. T h e substitution rate is of the order of 0.2 substitutions per site and per billion years, which is 10 times less than in the nucleus and 100 times less than in animal mitochon- dria (WOLFE, LI and SHARP 1987). In contrast, great variability is found in the order of the genes and differences can be found between closely related spe- cies or even within the same species (PALMER and
HERBON 1987; PALMER 1988). This diversity is gen-
erally assumed to be generated by recombination be- tween repeated sequences (e.g., LONSDALE et d . 1988): a molecule containing these repeats can generate new molecular forms through recombination, so that sev- eral different molecules coexist within the same cell.
An ever-increasing amount of molecular data are now making it possible to understand the structure and evolution of the plant mitochondrial genome. The current idea is that plant mitochondria represent
’
Present address: Laboratoire “Dynamique du G n o m e et Evolution,” Universit; Paris 6. 2 Place Jussieu, 75251 Paris Cedex 05, France. Genetics 135: 213-222 (September, 1993)a set of molecules at a stoichiometric equilibrium, where rearrangements due to recombination events are the main force creating variability (BUTOW 1986;
LONSDALE et al. 1988). However, the complexity of
this “multipartite” organization, when added to the non-Mendelian segregation of the molecules during cell division, makes it very difficult to understand both the molecular mechanisms that determine the propor- tions of the different molecules within a cell and the underlying evolutionary processes. Mathematical and computer models taking into account recombination, replication and segregation would thus seem a useful tool to improve our knowledge of such issues. Few models have, however, been built to simulate the dynamics of cytoplasmic DNA. TAKAHATA and SLAT- KIN (1 983) modelled non-Mendelian segregation of cytoplasmic DNA but did not take into account recom- bination. BRENDEL and SEGEL (1987) modelled the dynamics of the plant mitochondrial genome under recombination, replication and segregation, but only in a simple case of a tripartite organization (one mol- ecule being cut into two). CONDIT and LEVIN (1990) modelled the evolution of bacterial plasmids carrying antibiotic resistance under segregation, transposition and drift, but their work can hardly be applied to plant mitochondria.
214 Atlan and Couvet REVIEW OF T H E KEY EVIDENCE
Several different molecules coexist: Some mole- cules exist in important proportions-and are re- ferred to as “major” molecules, Many others are pres- ent in very low proportions-and are referred to as “substoichiometric” molecules or “sublimons” (BUTOW 1986). T h e general stoichiometry is stable through generations and among individuals, but slight differ- ences are observable. T h e estimations of the number of mitochondrial genomes per cell are quite variable but generally range from 100-200 (e.g., WARD, AN-
DERSON and BENDICH 1981). T h e restriction maps of
the molecules are almost always circular, but obser- vations under the microscope reveal mainly linear molecules (see QUETIER et al. 1985; BENDICH 1985;
BENDICH and SMITH 1990). Whether these molecules
are circular in vivo is debatable, but it is generally assumed that at least the replicating form is circular. Most, if not all, of the molecules only contain part of the mitochondrial genome and are therefore called “subgenomic molecules.” T h e molecule containing the whole genome is called the “master circle.” This master circle was found as a physical entity in some plants, but in general it seems that the master circle is only an a posteriori construction.
There is an active system of recombination: In cases where different major molecules have been iden- tified and mapped, it was possible to see how small (“subgenomic”) molecules resulted from recombina- tion within a bigger one (reviewed by LONSDALE et al.
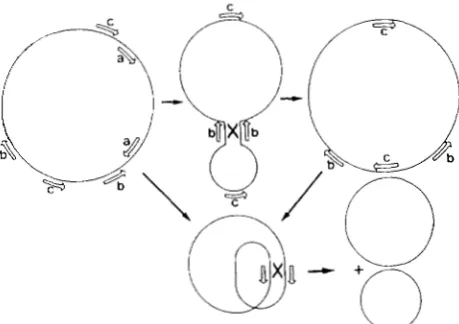
1988). When cells with different mitochondrial ge- nomes are fused, the two parental genomes recombine to generate a new rearranged one, as first described by BELLIARD, VEDEL and PELLETIER (1979). Mito- chondrial rearrangement after protoplast fusion is a general phenomenon (for review see HANSON 1984). T h e rate of recombination is therefore very high. Most of the recombination occurs at specific sites. These are direct or inverted repeats that may be very short (1 00- 1000 bases) and constitute recombina- tional hot spots. Traditional recombinations between duplicated genes also occur, but they are too rare to be implied in the “multipartite” organization. Recom- bination between repeats in a direct orientation leads to the division of one molecule into two smaller ones, whereas recombination between inverted repeats re- sults in an inversion of the sequences between them (see Figure 1, from QUETIER et al. 1985). Most of the short recombining repeats are in a direct orientation (LONSDALE et al. 1988).
The replication mechanism is still unknown: De- spite several attempts to identify the replication mech- anism, the number and location of replication origins is unknown and contradictory hypotheses exist. Ob- servations of BENDICH and SMITH (1990) on water- melon and cauliflower suggest a rolling circle mecha-
i
dX1n
-
+n
u
w
FIGURE 1 .-Generation of different molecules by reciprocal re-
combinations. The circular molecule represented on the left con- tains a pair of direct repeated sequences (a) and two pairs of inverted repeated sequences (b and c). A pair of direct repeated sequences (a) can generate two different molecules after a reciprocal recom- bination as shown at bottom. A pair of inverted repeated sequences
(c) can be converted into a pair of direct repeated sequences through
a reciprocal recombination of another pair of inverted repeated
sequences (b); this flip-flop mechanism gives in a first step the
circular molecule that is represented on the right side (and that differs from the left one); in a second step, the repeated sequences c that are now in a direct position can generate two different molecules by the same mechanism as that mentioned for a. This
model can also work with linear molecules. I t can explain the
observed heterogeneity of the population of mitochondrial DNA
molecules in higher plants. Figure and legend from QUETIER et al.
1985.
nism generating linear molecules. P. DORFEL, S. BACK-
ERT, R. LURZ, and T. BORNER observed linear tails on
circular molecules of all sizes, suggesting that the rolling circle mechanism is also valuable for subgen- omic molecules (unpublished data). The only success- ful attempt to identify replication origins is that of DE HAAS et al. (1 991) on petunia. Their results suggest that the master circle is the only replicating molecule and that this molecule replicates in a way comparable to that of animal mitochondria (described in CLAYTON
199 I), ie., duplicating circular molecules.
Natural rearrangements: Rearrangements occur- ring through recombination may lead to a change in the order of the genes, with or without deletions and duplications. PALMER et al. (1990) have recently shown that the phylogeny of these rearrangements follows the phylogeny of different species among the Brassicae. Rearrangements have also been shown to account for the transition from the ancestral “RU” type of maize mitochondria to the modern “N” type (SMALL, SUFFOLK and LEAVER 1989). Comparisons between “normal” mitochondria and mitochondria determining cytoplasmic male-sterility generally ex- hibit many rearrangements between the two forms. Supplementary sequences are often found in the ster- ile form. For instance, this is the case between the fertile and the sterile Ogura forms in radish (MAKA-
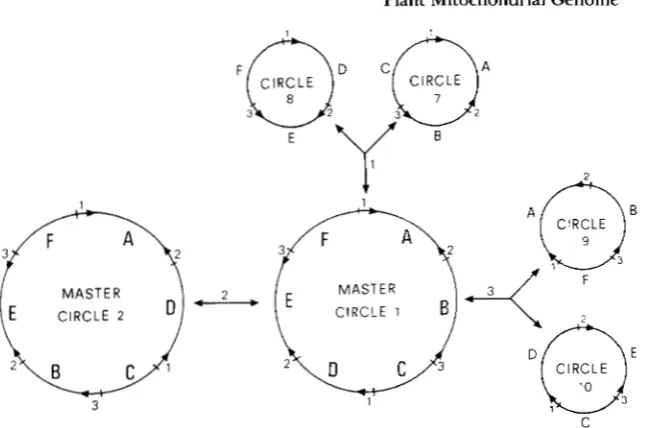
FIGURE 2.--Structure of master circle 1 and of the different mole- cules it can generate through one step of recombination. The upper- case letters (A, B, C, D, E, F) repre- sent the long sequences, including the coding regions, and the figures (1, 2, 3) represent the short repeated sequences. The orientation of the
long sequences is not indicated since
recombination through them does
CIRCLE
MASTER MASTER
CIRCLE 2 CIRCLE 1
the sterile T forms in maize (FAURON and HAVLIK 1989). According to data from investigations on cul- tivated lines of hermaphroditic species, re- arrangements seem to be relatively rare within a spe- cies. Recent studies on natural populations of gyno- dioecious species (species where male-sterile individuals are frequent), however, showed a higher level of polymorphism compared with cultivated her- maphroditic species, which may indicate a higher rate of rearrangements. This is the case in Beta maritima
(BOUTIN et al. 1987; SAUMITOU-LAPRADE et al. 1993),
Plantago lanceolata (VAN DAMME, unpublished data)
and Thymus vulgaris (A. ATLAN, E. BELHASSEN and D.
MANICACCI, unpublished data).
Rearrangements in tissue culture: Tissue culture often leads to mitochondrial rearrangements (for a review see HANSON 1984; and HARTMANN et al. 1989). Many of these rearrangements involve deletions, sometimes accompanied by duplication (e.g., FAURON
et al. 1990). T h e rearranged molecules are generally
smaller and may consist of several repetitions of the same unit (e.g., DALE, Wu and KIERNAN 1983). Such molecules first appear in low proportions, and their frequency increases more or less slowly, until a new stochastic equilibrium is obtained, which can take from a few days to more than 2 yr (e.g., SALEH et al.
1990). T h e modifications may have a phenotypic ef- fect on cytoplasmic male-sterility (LEVINGS and BROWN 1989). When the culture is made with cells from hermaphroditic plants, some male-sterile mu- tants may be observed in the regenerated plants (e.g.,
DE PAEPE et al. 1990). Conversely, tissue culture from male-sterile plants may produce some revertants to male-fertility due to the deletion of the male-sterility gene (e.g., FAURON, HAVLIK and BRETTELL 1990).
THE MODEL
T o simulate the evolution of the frequencies of the different mitochondrial molecules within a cell, we
-
not generate new circles. The num- bers above the arrows indicate which are the repeated sequences that re- combine.
CIRCLE
first had to identify all the possible molecules a given genome can generate through recombination. There is apparently no simple algorithm to identify this set of molecules, since it depends on the number, the position and the orientation of the repeated se- quences. A preliminary computer model was built to deduce the number and the composition of the mol- ecules generated through recombination, depending on the structure of an original master circle. However, if two different molecules with a common recombin- ing sequence are always available to fuse, the number
216 Atlan and Couvet
!AEhLm&
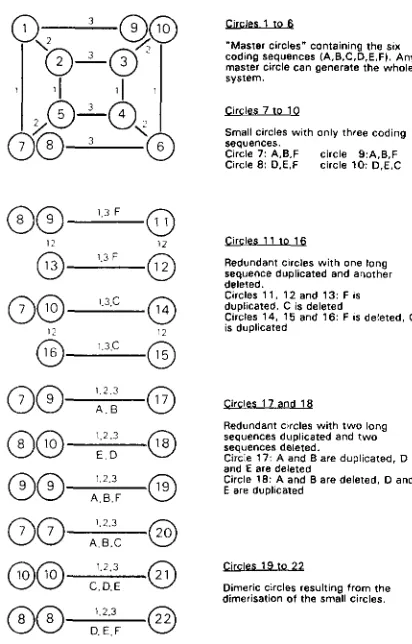
codlng sequences (A,B.C.D.E.FI. Any ”Master circles” containlng the SIX
master circle can generate the whole system.
Clrcies 7 to 1 0
Small circles with only three coding sequences.
Clrcle 7: A,B.F circle 9 : A . B . F
Ctrcle 8 : D.E.F circle 1 0 : D,E,C
Circles 1 1 lo 1 6
Redundant clrcies with one long sequence duplicated and another deleted.
Circles 1 1 . 1 2 end 1 3 : F IS
dupllcated. C IS deleted
Circles 14. 1 5 and 1 6 : F IS deleted. C is duplicated
G i r c l a 1 7 and 1 8
Redundant clrcles with two long sequences duplicated and t w o sequences deleted. and E are deleted
Circle 1 7 - A and B a r e duplicated, D
Circle 18: A and B are deleted. D and E are dupllcated
w s19 to 2 2
Dimeric C I d e s resultlng from the dimerisation of the small circles.
FIGURE 3.-The system of circles generated by the master circle
1 shown in Figure 2 after several steps or recombination. Each
number represents a different circles. Lines relate two circles (or
group of circles) that can generate each other through recombina- tion. The figures and letters above the lines indicate which are the possible recombining repeats.
T h e model presented in this paper simulates the evolution over successive cell cycles of the frequencies of the 22 circles generated by master circle 1 . This model was built using the general scheme presented below, which may be applied to the sets of circles generated by any type of master circle. Both deter- ministic and stochastic simulations were performed.
The deterministic version: In this version, a cell cycle is simulated as a succession of recombination and replication steps. T h e frequency of the circles is calculated after each step. There is a different equa- tion for every circle X , giving its frequency
Pg
+
1 ( X )at the generation g
+
1, in function of its frequencyP g ( X ) at generation g, as shown in the following scheme:
Recornbination Replication
P,(X)
-
PS(X)-
P ; ( x ) = Pg+l(X)Recombination: For simplicity, it was assumed that recombination among molecules occurs randomly, as suggested by LONSDALE et al. (1 988).
T h e parameters are the rates of recombination of the different sequences and of the different types of recombinational events. Every sequence may have a different recombination rate R, (where s is the name of the sequence) since the rate of recombination
should depend on the length and the composition of the sequence in question (DE ZAMAROCZY, FAUGERON-
FONTY and BERNARDI 1983). Three different types of recombinational events are possible: ( 1 ) fission of a molecule due to intramolecular recombination be- tween direct repeats; the rate of recombination be- tween direct repeats is Td; (2) inversion due to intra- molecular recombination between inverted repeats; the rate of inversion is Ti; (3) fusion of two different molecules due to an intermolecular recombination; the rate of fusion is TF
T h e different recombinational events that may cre- ate or destroy a given circle X , containing a total number oft recombining sequences, including d direct repeats and i inverted repeats are listed below. A circle X may disappear due to
“fusion with another circle X (dimerization) by recombination through any of its t recombining se- quences (this destroys two circles X )
“fusion with a different circle Y by recombination through one of their c common sequences
“fission by recombination through its d direct repeats
-inversion of sequences due to recombination through its i inverted repeats.
A circle X may be created by
“fusion of two circles
Q
(if X is a dimeric molecule) by recombination through one of their q recombining sequences“fusion of two circles V and W by recombination through one of their
k
common sequences“fission of a bigger circle R by recombination through its r direct repeats
“fission of one dimeric circle
M
into two circles Xthrough recombination by its m direct repeats -inversion of a circle 2 by recombination through its n inverted repeats. T h e relationship between P ( X ) (before recombination) and P ’ ( X ) (after recombina- tion) therefore depends on the frequencies of the other circles and is given by the following general equation:
P’(X) = P(X)
f c
-Tf
[2[P2(X) s=z
1 Rs]+
z
[2P(X)P(Y)z
Rs]]Y s= 1
a k
+
Tf[[P2(q) Rs]+
2 [PP(V)P(W) Z Rs]]s= 1 u,w s= 1
4 m
Plant Mitochondrial Genome 217
If there is only one step of recombination between two steps of replication, the recombination rates can- not exceed a maximum value (that depends on the other parameters) in order not to use more than the existing circles, It is, however, possible to increase further the average recombination rate within the cell by putting more than one recombination step between two replication steps. These kind of simulations did not provide new results and are therefore not pre- sented here.
Replication: Ax is the amplification rate of a given circle X . T h e value of Ax may depend on the length and/or on the composition of circle X . If there are n types of circles, P ” ( X ) , the frequency of a circle X after replication is given by:
P ” ( X ) = [AxP’(X)] AiP’(i)].
r
i= 1
The stochastic version: T h e model becomes sto- chastic if a step of random segregation is added. A cell cycle is then represented by a succession of three steps, as shown in the following scheme:
Recombination Replication
P g ( X )
-
P;(x)
-
P ; ( x )Segregation
f y ( X )
-
P i ( X ) = Pg+l(X).Segregation: T h e model first determines the com- position of the mother cell after recombination and replication. T o d o this, P ( X ) , the frequencies of each type of circle are transformed into m,, the number of circles X present in the mother cell. T h e amount of DNA within a cell before division is the parameter that is kept constant over successive cell cycles. Assum- ing that every long sequence has the same length, this results in keeping the number of long sequences con- stant. T h e number of circles can, however, vary since different circles may have different number of long sequences. T h e parameter N , referred to as the “num- ber of copies,” represents the number of master circles that could be created with same amount of DNA. Therefore, if the master circles contain s long se- quences, and if there are
k
long sequences within the cellN = k / s .
It was assumed that the replication step resulted in a doubling of the number of copies. If P ” ( X ) is the frequency of circle X before segregation, qx is defined as
q x = 2N P”(X) = intx
+
decx,where intx and decx are respectively the integer frac- tion and the decimal fraction of qx.Then mx, the number of circles X present in the mother cell will be given by
mx = intx with a probability (1
-
&xx)mx = intx + 1 with a probability dexx.
Once the composition of the mother cell is known, the composition of the daughter cell is determined. Each circle present in the mother cell has a probability 1/2 of being retained in the study daughter cell. Once the composition of the daughter cell is known, the frequency of each type of circle is calculated. This procedure would converge toward an hypergeometric distribution [ZN, N , P ( X ) ] (which is equivalent to a binomial, but sampled from a finite population with- out replacement) if all circles had the same number of long sequences.
In summary, the parameters are:
R,: the recombination rate of a sequence s
T,: the rate of recombination between inverted re-
Td: the rate of recombination between direct repeats
Tf: the rate of fusion between two different mole-
A x : the amplification rate of circle X
N the quantity of mitochondrial DNA within the peats
cules
cell, expressed in “master circles equivalent.”
RESULTS
Results of the deterministic version: Whatever the parameters, it was always possible to reach an equilib- rium. This equilibrium is reached when the recombi- nations and replications occurring at each generation do not affect the stoichiometry of the system ( i . e . , the proportion of each type of circles). It corresponds to the “panmictic mitochondrial DNA population which is in recombinational equilibrium” described by LONS-
DALE et al. (1988). At such equilibria, the frequency
of the different circles may differ by several orders of magnitude.
218 Atlan and Couvet
i
1..
::. :: ' . ~ . ' . ' . ' . ::' . ' . ' . ' . ' . ' .:.::'if"
" . . . . . . . . . . . . . . . . . . ., . . . . . .
*
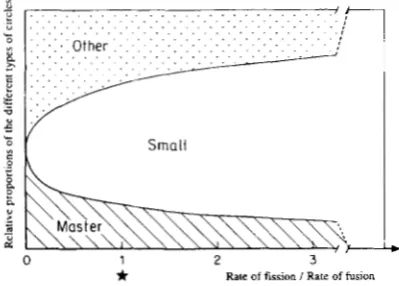
Rate of fission I Rate of fusionFIGURE 4.-Effect of the relative values of the rate of fission ( T d )
and of fusion (Tr) on the composition of the equilibrium after a recombination step. Amplification rate of all circles is 1 . Rates of inversion and of splicing are equal: T, = T, = 0.1. Recombination rates of the sequences 1 , 2 and 3 are equal: R , = R z = R3 = 0.1.
The absolute values of R , , Rz, Rj, T, and T d has no effect on the
equilibrium (see text). For Td/T, = 0, which may only be obtained for T d = 0, the fission never occurs and the equilibrium depends of
the initial state. When Td/T, increases, the proportion of small circles tends asymptotically to 1 (dashed lines).
Ampllfication rate of the master circles
FIGURE 5.-Effect of the replication advantage of the master circles on the composition of the equilibrium after a recombination step. Amplification rates of other circles are constant and inversely proportional to their size. Big circles with 6 long sequences have an amplification rate of 1. Small circles with 3 long sequences have an amplification rate of 2. Recombination rates of the short repeats are R , = Rz = R j = 0.1. Rate of inversion, fission and fusion are T,
= T d = Tr = 1. At the position of the stars, parameters in Figures 4
and 5 are equal, except the amplification rate of small circles that is equal to 1 in Figure 4 and equal to 2 in Figure 5. This illustrates the increase of small circles frequencies when the amplification rate
is dependent of the size.
amplification rate of the master circles (A,) was higher than the amplification rate of the other circles resulted in an increase in the frequency of master circles. Depending on the values of the parameters, the master circles may be more or less numerous (see Figure 5). However, as far as the fission of a molecule through recombination by direct repeats is possible, master circles are mixed with other molecules.
To take into account also the composition of a given circle to determine its replicating ability, we consid- ered that a given long sequence was necessary and sufficient for replication (as if this sequence did con-
tain a replication origin). T h e amplification rate of a circle was proportional to the ratio of the number of replication origins on the number of long sequences. As a result, small circles containing a replication ori- gin, and circles where the replication origin was d u - plicated, replicated faster than the others. Once equi- librium was reached, they were the only circles pres- ent. Since these two kinds of circles did not contain the totality of the genome, some sequences were lost. T h e number of sequences lost depended on the loca- tion of the replication origin in interaction with the position of direct repeats. Sequences lost were those separated from any replication origin by at least one direct repeat. For example, when the replication ori- gin was on sequence C, the only circles present at equilibrium were the small circle ABC and its dimeric form, ABCABC, so that sequences D, E and F were lost. When the replication origin was on sequence A, the equilibrium contained circles ABC, ABF, their fusion product ABCABF and their dimeric forms ABCABC and ABFABF, so that sequences D and E were lost.
Same sequences were lost when the amplification rate of the circles did not take into account the size of the circle or the number of replication origins, that is, if the amplification rate was 0 or 1, depending on the absence or presence of at least one replication origin. Same sequences were also lost when the "replication origin" was not necessary for replication but only enhanced the amplification rate of the circle carrying them. In these two cases, the loss of sequences took a larger number of generations than in the first set of simulations.
Results of the stochastic version: T h e results given here were obtained with the set of circles in Figure 3 and 200 copies of the genome ( N = 200). We first checked the conditions leading to a stable equilibrium, and then studied the conditions leading to reversible or irreversible rearrangements.
Plant Mitochondrial Genome
GROUP I
)
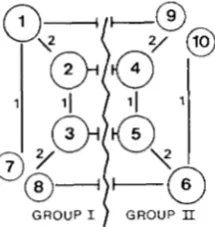
GROUP IIFIGURE 6,”Separation of the set of circles of Figure 3 into two
subgroups. Subgroup I contains master circles I , 2 and 3, small
circles 7 and 8, and their dimeric form 1 9 and 20. Subgroup I1
contains master circles 4, 5 and 6, small circles 9 and 10, and their
dimeric form 2 1 and 22. Transition between the two subgroups is
only possible through recombination of sequence 3. If sequence 3
does not recombine, the two groups cannot generate each other,
and redundant circles (from 1 1 to 18) are absent because they result
from the fusion of one small circle of subgroup I with one small
circle of subgroup 11.
copies of the genome was to give the master circles a replication advantage. An advantage of 10% was gen- erally sufficient to prevent the loss of information. As shown in Figure 5 this advantage of 10% (A,,, = 1.1) did not result in making the master circles predomi- nan t
.
The loss of one sequence results in definitive change of the stoichiometry of the remaining molecules and therefore an irreversible rearrangement. From an original stable equilibrium, a loss of one sequence may be obtained either by increasing drift (decreasing the number of copies) or by reducing the proportion of master circles (by decreasing the master circles advan- tage or by increasing the general recombination rate). These modifications may also lead to reversible rearrangements, which consist of transitions from one steady state with a given stoichiometry to another steady state with a different stoichiometry, both con- taining all sequences. Two steady states with different stoichiometry may exist if one repeated sequence re- combines much less than the other. They consist of different subgroups of the set of all possible circles the master circle can generate. Figure 6 illustrates how the set of circles presented in Figure 3 is distrib- uted into two independent subgroups if sequence 3 has a low rate of recombination. These subgroups both contain the six long sequences, but the order of the genes in the circles carrying them is not the same. The only way for a circle of one subgroup to generate a circle belonging to the other subgroup is by recom- bination involving sequence 3. If sequence 3 does not recombine, the equilibrium contains only circles of a single subgroup. If the rate of recombination of se- quence 3 is not equal to 0, but only small compared with the rate of sequences 1 and 2, the equilibrium contains mainly circles of one subgroup, but also a few circles belonging to the other subgroup. These
TABLE 1
Possibilities for recurrent paths between the two groups of
circles shown in Figure 6 depending on A,, the amplification
rate of master circles, and Rs, the replication rate of sequence 3
A.
R, 1 1.1 1.3 1.5 1.8 2 3 4 5 10
0 . 0 1 L N N N N N N N N N
0 . 0 2 5 L N N N N N N N N N
0 . 0 5 L R R R R R R R N N
0 . 0 7 5 L R R R R R R M M M
0.1 L M M M R R R M M M
0 . 2 5 L M M M M M M M M M
0.5 L M M M M M M M M M
L indicates an inevitable loss of some sequence, N indicates that
there are no paths between the two steady states, M indicates that
there is a mixture of circles from the two steady states, R indicates
that there are recurrent paths between the two steady states. The
frequencies of the three types of recombinational events (T,, T d and
T,c) are equal to 0.01. All other recombination and amplification
rates are equal to 1. The number of copies is 200.
few circles are generated at each recombination step, and in the segregation step that follows, drift leads either to a decrease or to an increase in their fre- quency. However, a mixture of circles from the two subgroups may be unstable, because many molecules are created by the fusion of two small circles of the two subsets. These are molecules with duplication and deletion (see Figure 3), and as we hypothesize a master circle advantage (see above), these molecules have a lower replication rate. Depending on the values of the parameters, there are three possibilities: (1) the two possible states are so stable that there is no possibility for transition from one subgroup to another;
(2)
there are two stable states, with recurrent transition from one to another; and (3) the two possible states are not stable, and a mixture of the two subgroups is observed. Table 1 shows which of these three possibilities is obtained depending on recombination rates and mas- ter circle advantage. The stability of the different subgroups decreases with the drift and the recombi- nation rates, and increases with the master circle advantage. The frequency of the transition between the two states is inversely correlated with their stabil- ity.Comparable phenomenon can be observed any time one sequence recombines much less than the others.
DISCUSSION
220 Atlan and Couvet
(1987). This is in agreement with observations of mitochondrial genome under microscope, which re- veal mainly molecules smaller than the master circle
(e.g., DALE, WU and KIERNAN 1983; BENDICH and SMITH 1990).
Maintenance of the integrity of the genome: Parts of the genome separated from replication origins by direct repeats are lost. Moreover, random segrega- tion, by inducing the loss of some molecules, induces the loss of additional sequences. This was not observed in the model of TAKAHATA and SLATKIN (1983) be- cause in their model all molecules contained all the genes. Taking into account recombination, Brendel and SECEL (1 987) found that small molecules become predominant if they are able to replicate. In the absence of selection, the loss of information is inevi- table unless there is a selection pressure to prevent it. This was experimentally demonstrated in the case of the petite mutation (BLANC and DUJON 1980): in an- aerobic conditions, yeast mitochondria lose many se- quences, so that the remaining molecules contain pri- marily copies of the replication origin. T h e loss of mitochondrial sequences frequently obtained in tissue culture (e.g., FAURON, HAVLIK and BRETTELL 1990) may be attributed to the same phenomenon: in tissue culture the selective pressures are probably relaxed. Selection preserving the integrity of the genome may act among molecules within the cell or among cells.
Selection within the cell seems a realistic hypothesis since there is good evidence in yeast (see DUJON and BELCOUR 1988; BIRKY 1973; BACKER and BIRKY 1985), as well as in metazoans (see GRUN 1976; EBER- HARD 1980). If one sequence enhances (or is necessary for) the replication of the circle carrying it, incomplete molecules containing duplication of the enhancing sequence are quickly created; and these molecules invade the cell, as for the petite mutation in yeast (BLANC and DUJON 1980). Consequently, some se- quences are lost. T h e integrity of the genome was therefore impossible to maintain when the existence of a replication origin in a given long sequence was simulated. Our model suggests that either all subgen- omic circles have comparable replication rates (for example, if there is a replication origin in every long sequence) or that the molecules containing all the sequences, that is, the “master circles,” have a repli- cation advantage. Considering that master circles are the only replicating molecules, as suggested by PAL- MER and SHIELD (1984), and simulated by BRENDEL and SECEL (1987), always result in maintaining all sequences. This results in making the master circles predominant (which is not compatible with experi- mental observations), except with a very high recom- bination rate and fission:fusion ratio. However, a slight replicative advantage of the master circles is sufficient to maintain the integrity of the genome with
200 number of copies, without making the master circles predominant. Experimental data are not yet consensual enough to choose between these two hy- potheses (see INTRODUCTION).
Selection among cells is probably also acting, cells with deleted mitochondria being likely to have phys- iological disadvantage. This difference among cell reproductive success was not taken into account in the model presented here but exists in the model of TAKAHATA and SLATKIN (1983). In their model, in- tercellular selection combined with drift is able to prevent the accumulation of deleterious mutation if the number of molecules is high enough. However, they did not take recombination into account. With a high rate of recombination, the rate of intracellular evolution may be too fast for selection acting solely at the cellular or individual level to eliminate deleterious mutations. An extension of our model that would deal with a population of cells is needed to test this hypoth- esis and to compare the consequences of selection among and within cells.
Rearrangements: Variation in stoichiometry has been suggested to be the main change occurring in plant mitochondrial DNA by several authors (e.g.,
LEAVER et a l . 1988; PALMER et a l . 1990). In our model, rearrangements d u e to recombinations never result in creating new molecules but only change their rela- tive frequency. In both experimental data (SMALL, SUFFOLK and LEAVER 1989) and our model, the fre- quency of a molecule may be increased by several orders of magnitude (from a “substoichiometric” to a “major” form).
Plant Mitochondrial Genome 22 1
Reversible rearrangements correspond to recurrent transitions from one equilibrium to another, that both contain all sequences. Except during few cell cycles when the transition from one steady state to another occurs, the offspring and the mother have the same genome organization. Whereas highly recombining sequences determine the frequencies of the circles at a given equilibrium, weakly recombining sequences determine the number of possible steady states. This explains why most of the transitions from one genome organization to another are attributable to the weakly recombining sequences (including the duplicated cod- ing regions) and not to the highly recombining repeats (LONSDALE et al. 1988). T h e frequency of transition between the different possible steady states depends on the number of copies, the advantage given to the master circles, and the replication rates. These param- eters might vary among species. Reversible re- arrangements may therefore be more or less frequent depending on the species, leading to a variable level of mitochondrial polymorphism. T h e shift from one steady state to another may considerably modify the organization of the genome, because the circles pres- ent in the two steady states may have completely different orders of sequences.
Our results also suggest possible mechanisms that may explain the nuclear effect on mitochondrial DNA organization. Indeed, the nuclear genotype may in- duce changes in the stoichiometry of the different mitochondrial molecules (e.g., SMALL et al. 1988). This may lead to a reversion to male fertility, as found in rice by NAWA et al. (1 987) and in maize by SMALL et
al. (1988). Such changes in the stoichiometry of the different circles is inducible in our model by changing the general replication and/or recombination rates of the mitochondria. These parameters may be under nuclear control. On the other hand, the fact that general stoichiometry of the circles is constant within a maternal lineage seems to indicate that little varia- bility of these parameters exists at the nuclear level.
CONCLUSION
A highly recombining genome may reach an equi- librium stable enough to give constant frequencies of the molecules among generations. Some re-
arrangements may, however, be regularly obtained accompanied or not by the loss of sequences. T h e frequency of these rearrangements depends both on genomic factors (recombination rates of the repeated sequences, number of copies of the genome etc
. .
.
)and on environmental factors (including nuclear back- ground) influencing selection, recombination and rep- lication. Recombination generally results in scram- bling the genome into small incomplete molecules, since most of the recombining repeats are in direct orientation. This phenomenon, when added to ran-
dom segregation, may easily lead to the loss of infor- mation when drift is too important. T h e plant mito- chondrial genome may therefore have been strongly selected to avoid the loss of information. This may explain why this genome contains such a high propor- tion of long repeats and noncoding DNA: it seems difficult to prevent both the loss of sequences and the accumulation of “useless” DNA.
We thank FINN KJELLBERG, PIERRE-HENRI GOUYON and JOHN
THOMSON for helpful discussions and comments, and two anony- mous referees for constructive criticisms in a previous version of the manuscript.
LITERATURE CITED
ANDRE, C., A. LEVY and V. WALBOT, 1992 Small repeated se- quences and the structure of plant mitochondrial genome. Trends Genet. 8(4): 128-132.
BACKER, J. S., and C. W. BIRKYJR., 1985 The origin of mutant cells: mechanisms by which Saccharomyces cerevisiae produces cells homoplasmic for new mitochondrial mutations. Curr. Genet. 9: 627-640.
BELLIARD, G., F. VEDEL and G. PELLETIER, 1979 Mitochondrial recombination in cytoplasmic hybrids of Nicotiana tabacum by protoplast fusion. Nature 281: 401-403.
BENDICH, A. J., 1985 Plant mitochondrial DNA: unusual variation on a common theme, pp. 11 1-1 38 in Genetic flux in plants,
Vol. 2, edited by B. HOHN and E. S. DENNIS. Springer-Verlag, Vienna.
BENDICH, A. J., and S. B. SMITH, 1990 Moving pictures and pulse- field gel electrophoresis show linear DNA molecules from chloroplast and mitochondria. Curr. Genet. 17: 421-425.
BIRKY JR., C. W., 1973 On the origin of mitochondrial mutants: evidence for intracellular selection of mitochondria in the origin of antibiotic-resistant cells in yeast. Genetics 74: 421- 432.
BLANC, H., and B. DUJON, 1980 Replicator regions of the yeast mitochondrial DNA responsible for suppressiveness. Proc. Natl. Acad. Sci. USA 77: 3942-3946.
BOUTIN, V., W. E. PANNENBECKER, G. SCHEWE, P. SAUMITOU- LAPRADE, R. JEAN, P. VERNET and G. MICHAELIS,
1987 Cytoplasmic male sterility and nuclear restorer genes in
a natural population of Beta maritima: genetical and molecular aspects. Theor. Appl. Genet. 73: 625-629.
BRENDEL, V., and L. A. SEGEL, 1987 On modes of recombination, replication, and segregation of the higher plant mitochondrial genome. J. Theor. Biol. 125: 163-176.
BUTOW, R. A., 1986 Rearranging the plant genome. Nature 324:
620.
CLAYTON, D. A., 1991 Replication and transcription of vertebrate mitochondrial DNA. Annu. Rev. Cell Biol. 7: 453-478.
CONDIT, R., and B. R. LEVIN, 1990 The evolution of plasmids carrying multiple resistance genes: the role of segregation, transposition and homologous recombination. Am. Nat. 135:
573-597.
DALE, R. M. K., M. WU and M. C. C. KIERNAN, 1983 Analysis of four tobacco mitochondrial DNA size classes. Nucleic Acids Res. 11: 1673-1685.
DUJON, B., and L. BELCOUR, 1988 Mitochondrial DNA instabili- ties and rearrangements in yeasts and fungi, pp 861-878 in
Mobile DNA, edited by D. E. BERG and M. M. HOWE. American Society for Microbiology, Washington D.C.
EBERHARD, W. G., 1980 Evolutionary consequences of intracel- lular organelle competition. Q. Rev. Biol. 55: 231-249.
222 Atlan and Couvet
genome of the normal type and the cytoplasmic male sterile type T have very different organization. Curr. Genet. 15: 149-
154.
FAURON, C. M. R., M. HAVLIK and R. I. S. BRETTELL, 1990 The mitochondrial genome organization of a maize fertile cmsT revertant line is generated through recombination between two sets of repeats. Genetics 1 2 4 423-428.
FAURON, C. M. R., M. HAVLIK, S. HAFEZI, R. I. S. BRETTELL and M. ALBERTSEN, 1990 Study of two different recombination events in maize cms-T regenerated plants during reversion to fertility. Theor. Appl. Genet. 7 9 593-599.
GRUN, P., 1976 Cytoplasmic Genetics and Evolution. Columbia Univ. Press, New York.
DE HAAS, J. M., J. HILLE, F. KORS, B. VAN DER MEER, A. J. KOOL, 0. FOLKERTS, and H. J. J. NIJKA34PP, 1991 Two potential Petunia hybrida mitochondrial replication origins show struc- tural and in vitro functional homology with the animal mito- chondrial DNA heavy and light strand replication origin. Curr. Genet. 2 0 503-5 13.
HANSON, M. R., 1984 Stability, variation and recombination in plant mitochondrial genomes via tissue culture and somatic hybridization. Oxford. Surv. Plant Mol. Cell. Biol. 1: 33-52. HANSON, M. R., 1991 Plant mitochondrial mutations and male
sterility. Annu. Rev. Genet. 2 5 461-486.
HARTMANN C., Y. HENRY, J. DE BUYSER, C. AUBRY and A. RODE, 1989 Identification of new mitochondrial genome organiza- tions in wheat plants regenerated from somatic tissue culture. Theor. Appl. Genet. 77: 169-175.
LEAVER, C. J., P. G. ISAAC, I. D. SMALL, J. BAILEY-SERRES, A. D. LIDDELL and M. J. HAWKESFORD, 1988 Mitochondrial ge- nome diversity and cytoplasmic male sterility in higher plants. Phil. Trans. R. SOC. Lond. B 3 1 9 165-176.
LEVINGS, C. S., and G. G. BROWN, 1989 Molecular biology of plant mitochondria. Cell 5 6 171-179.
LONSDALE, D. M., T. BREARS, T . P. HODGE, S. E. MELVILLE and W. H. ROTTMANN, 1988 The plant mitochondrial genome: homologous recombination as a mechanism for generating heterogeneity. Phil. Trans. R. SOC. Lond. B 3 1 9 149-163. MAKAROFF, C. A., and J. D. PALMER, 1988 Mitochondrial DNA
rearrangements and transcriptional alterations in the male- strile cytoplasm of Ogura radish. Mol. Cell. Biol. 8: 1474-
1480.
NAWA, S., Y. SANO, M. A. YAMADA and T. FUJII, 1987 Cloning of the plasmids in cytoplasmic male sterile rice and changes of organization of mitochondrial and nuclear DNA in cytoplasmic reversion. Jpn. J. Genet. 62: 301-314.
NEWTON, K. J., 1988 Plant mitochondrial genomes: organization, expression and variation. Ann. Rev. Plant. Physiol. Plant. Mol. Biol. 39: 303-532.
DE PAEPE, R., P. CH~TRIT, V. VITART, F. AMBARDBRETTEVILLE, D. PRAT and F. VEDEL, 1990 Several nuclear genes control
both male sterility and mitochondrial protein synthesis in Ni- cotiana sylvestris protoclones. Mol. Gen. Genet. 222: 206-210. PALMER, J. D., 1988 lntraspecific variation and multicircularity in
brassica mitochondrial DNAs. Genetics 118: 34 1-35 1. PALMER, J. D. and L. A. HERBON, 1987 Unicircular structure in
theBrassica hirta mitochondrial genome. Curr. Genet. 11: 565- 570.
PALMER, J. D., and C. R. SHIELD, 1984 Tripartite structure of the
Brassica campestris mitochondrial genome. Nature 307: 437- 440.
PALMER, J. D., C. A. MAKAROFF, I. J. APEL and M. SHIRZADEGAN, 1990 Fluid structure of plant mitochondrial genomes: evo- lutionary and functional implications, pp 85-96 in Molecular Evolution, edited by M. T. CLEGG and S. J. O’BRIEN. A. R. Liss, New York.
QUETIER, F., B. LEJEUNE, S. DELORME and D. FALCONET, 1985 Molecular organization and expression of the mitochon- drial genome of higher plants, pp. 25-36 in Encyclopedia of
Plant Physiology, New Series, Vol. 18, edited by R. DOUCE and D. A. DAY. Springer-Verlag, Berlin.
SALEH, N. M., H. S. GUPTA, R. P. FINCH, E. C. COCKING and B. J. MULLIGAN, 1990 Stability of mitochondrial DNA in tissue- cultured cells of rice. Theor. Appl. Genet. 79: 342-346. SAUMITOU-LAPRADE, P., G. J. A. ROUWENDAL, J. CUGUEN, F. A.
KRENS and G. MICHAELIS, 1993 Different CMS sources found in Beta vulgaris ssp maritima: mitochondrial variability in wild populations revealed by a rapid screening procedure. Theor. Appl. Genet. 85: 529-535.
SCHARDL, C. L., D. R. PRING and D. M. LONSDALE, 1985 Mitonchondrial DNA rearrangements associated with fertile revertants of S-type male-sterile maize. Cell 43: 361- 368.
SMALL, I . , R. SUFFOLK and C. J. LEAVER, 1989 Evolution of plant mitochondrial DNA via substoichiometric intermediates. Cell
SMALL, I. D., E. D. EARLE, L. J. WTE-CARLSON, S. GABAY- LAUGHNAN, J. R. LAUGHNAN and C. J. LEAVER, 1988 A comparison of cytoplasmic revertants to fertility from different maize sources. Theor. Appl. Genet. 7 6 609-618.
TAKAHATA, N., and M. SLATKIN, 1983 Evolutionary dynamics of extranuclear genes. Genet. Res. Camb. 42: 257-265.
WARD, B. L., R. S. ANDERSON and A. J. BENDICH, 1981 The mitochondrial genome is large and variable in a family of plants (cucurbitacea). Cell 25: 793-803.
WOLFE, K. H., W. H. LI and P. M. SHARP, 1987 Rates of nucleo- tide substitution vary greatly among plant mitochondrial, chlo- roplast and nuclear DNAs. Proc. Natl. Acad. Sci. USA 8 4 :
9054-9058.de Zamaroczy, M., G. Faugeron-Fonty and G. BER- N A R D ~ , 1983 Excision sequences in the mitochondrial genome of yeast. Gene 21: 193-202.
58: 69-76.