ABSTRACT
WANG, YUN. Colloidal Behavior of Polyampholytes. (Under the direction of Dr. M. A. Hubbe).
Polyampholytes are polymers that have both positively and negatively charged groups in the same chain. In recent years polyampholytes have started to be used in papermaking
applications, as well as in sludge treatment processes. Benefits, in the case of papermaking, have included increased dry-strength and faster removal of water. But the molecular
mechanisms by which such benefits are achieved have not been fully understood. This thesis project focused on effects related to polyampholyte charge density. A series of
Colloidal Behavior of Polyampholytes
by YUN WANG
A thesis submitted to the Graduate Faculty of North Carolina State University
in partial fulfillment of the requirements for the Degree of
Master of Science
PULP AND PAPER SCIENCE Raleigh
2006 APPROVED BY:
________________________ _________________________
BIOGRAPHY
ACKNOWLEDGMENTS
Yun Wang would like to express her appreciation for her thesis chair, Dr. Martin A. Hubbe for advising her research.
She would like to also to acknowledge her committee members, Dr. Dimitris S.
Argyropoulos and Dr. Orlando J. Rojas for supporting the research project by giving valuable advice and scientific ideas.
TABLE OF CONTENTS
LIST OF TABLES... v
LIST OF FIGURES ... vi
1. INTRODUCTION ... 1
2. LITERATURE REVIEW ... 2
2.1 Potentiometric behavior of amphoteric polymers... 2
2.2 Electrokinetic properties of amphoteric polymers... 7
2.3 Adsorption of amphoteric polymers on charged surfaces 23-25... 13
3. OBJECTIVES ... 27
4. PAPERS (EXPERIMENTAL, RESULTS, DISCUSSION)... 29
4.1 Papers-Part 1 ... 29
4.2 Papers-Part 2 ... 51
4.3 Papers-Part 3 ... 68
DISCUSSION ... 87
GENERAL CONCLUSIONS FROM THE THESIS PROJECT ... 93
LIST OF TABLES
PAPERS-Part 1 The role of polyampholyte charge density on its interactions with cellulose Table 1. Synthesis of acrylamide-based polyampholytes and copolymers……….34 Table 2 Composition according to preparation and by NMR analysis………..37 PAPERS-Part 2 Charge and the Dry-strength performance of polyampholytes. Part 1. Handsheets and Bulk Viscosity
Table 1. Synthesis of acrylamide-based polyampholytes and simple copolymers………...54 PAPERS-Part 3 Charge and the dry strength performance of polyampholytes. Part 2. Streaming Potential Analysis
LIST OF FIGURES
LITURATURE REVIEW
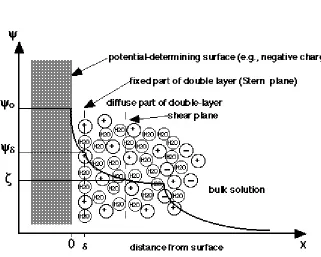
Fig. 1 Schematic diagram of the electric double layer model of a non-conducting surface,
including colloidal particles, in contact with an electrolyte solution………...8
Fig. 2 Electrophoretic mobility mechanism………...9
Fig. 3 Streaming potential mechanism……….10
Fig. 4 The streaming potential device mechanism………...11
Fig. 5 Streaming current equipment……….12
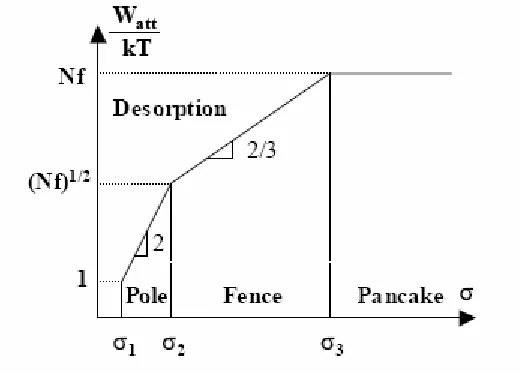
Fig. 6 Dependence of the absolute value of the adsorption energy W on the surface charge density, Logarithmic scales………....13
Fig. 7 Conformation of a polyampholyte chain near an adsorbing surface………...16
Fig. 8 Adsorption diagram of a polyampholyte chain as function of the surface charge density and the chain charge asymmetry………...18
Fig. 9 Adsorption diagram of a polyampholyte chain in a salt solution as function of surface charge density and inverse Debye screening length ………....19
Fig. 10 Schematic sketch of the configurations of polyampholyte chains in the adsorbed layers………...21
Fig. 11 Adsorption diagram of polyampholyte chains as a function as a function of the surface charge density and the chain charge asymmetry………...21
Fig. 12 Adsorption diagram of polyampholyte chains in a salt solution as a function of surface charge density and salt concentration………....22
Fig. 13 Nonmonotonic dependence of the thickness D of the adsorbed polyampholyte chain on the surface charge density………...23 PAPERS-Part 1 The role of polyampholyte charge density on its interactions with cellulose Fig. 1 1H NMR spectra and quantitative 13C NMR spectra of the six copolymer samples.36
Fig. 3 (a) Streaming current titration endpoints, using poly-DADMAC and PVSK standard titrants to evaluate apparent charge of polyampholytes……….39 (b)Streaming current titrations, as in 3a, but with polyampholyte “B” compared to simple polyelectrolytes of the same change density (samples F and G)………39 Fig. 4 Streaming potential vs. addition level of polymer “A”, having 2.5% cationic
substitution and 2% anionic substitution...41 Fig. 5 (a) Polyampholyte charge density and pH effects on streaming potential of MCC compared at 0.08% polymer on cellulose dry mass………...42 (b) Polyampholyte effects on streaming potential of MCC compared with
polyelectroytes having matched charge density at 0.08% addition………...42 Fig. 6 (a) Polyampholyte charge density and pH effects on streaming potential of bleached hardwood kraft fibers………...43 (b) Polyampholyte effects on streaming potential of bleached hardwood kraft fibers compared with polyelectrolytes having matched charge density………...43 Fig. 7 (a) Adsorption of polyampholytes onto cellulose fibers as a function of pH and
charge density………45
(b) Adsorption of polyampholyte B compared to two simple polyelectrolytes having the same densities of acidic or basic groups (samples F and G)………...45
PAPERS-Part 2 Charge and the Dry-strength performance of polyampholytes. Part 1. Handsheets and Bulk Viscosity
Fig. 1 Tensile test resulting from treatment of a slurry (pH 5) of bleached hardwood kraft at the levels of PAC as shown following treatment with polymer samples at the 1% level………...56
Fig. 2 (a) Tensile test resulting from treatment of a slurry (pH 4) of bleached hardwood kraft at the levels of PAC as shown following treatment with polymer samples at the 1% level……….57
(b) Tensile test resulting from treatment of a slurry (pH 8.5) of bleached hardwood kraft at the levels of PAC as shown following treatment with polymer samples at the
PAPERS-Part 3 Charge and the dry strength performance of polyampholytes. Part 2. Streaming Potential Analysis
Fig. 1 Schematic representation of expected conformational change following adsorption of a high-mass, linear polyampholyte in which the distribution of charged groups is segregated………...71 Fig. 2 Effect polyampholyte B dosage, as percent by mass on solids, on the streaming potential of glass fibers………...75 Fig. 3 Effect of pH on streaming potential for glass fiber suspensions treated with different levels of polyampholyte B………..75 Fig. 4 (a) Effect of the density of ionic groups in polyampholytes on the streaming potential of glass microfibers at 1000µs/cm conductivity……….77 (b) Contrast between the effects of polyampholyte B versus poly-base F and poly- acid G having the same molar content of either positive or negative groups……….77 Fig. 5 (a) Effect of PAC addition at increasing levels to salt-free glass fiber suspensions treated at the 0.02% level with ionic polymers at pH=5………78
(b) Effect of PAC addition at increasing levels of salt containing glass fiber
suspensions treated at the 0.02% level with ionic polymers at pH=5………78 Fig. 6 (a) Effect of time on the streaming potential of glass fibers freshly treated with ionic polymers at pH=5 in the absence of sodium sulfate………..79 (b) Effect of time on the streaming potential of glass fibers freshly treated with ionic polymers at pH=5 in the presence of sodium sulfate ………79 Fig. 7 Streaming potentials vs. pH for glass fibers treated with polyampholytes having different ratios of monomeric groups: polyampholytes H-1 and H-2 with a ratio of amine groups to carboxyl groups of 5:8 and 3.8:9, respectively………...80 Fig. 8 (a) Streaming potential – pH behavior of glass fibers treated with a polyampholyte having equal amounts of cationic and anionic groups………...81 (b) Streaming potential – pH behavior of glass fibers treated with polyampholytes in which the anionic groups were doubled by use of a di-functional carboxylic
1. INTRODUCTION
Synthetic polyampholytes began to be used in the papermaking and sludge dewatering industries just several years ago1-3. In the paper industry, the copolymer-type amphoteric poly(acrylamide) co-AMP-PAM, which is a type of amphoteric PAM, was found to be more effective than poly(acrylamide)(PAM)1. In sludge treatment, a combination of a metal coagulant and an amphoteric polymer was found to produce large and mechanically strong floc.2
Synthetic polyampholytes have acidic and basic monomers along the chain, which makes them have unique properties, including electrochemical, hydrodynamic and conformational properties. The understanding of this kind of polymers is not well advanced, and they are not as widely used, compared to traditional additives. However, knowledge of these properties is important for understanding the function of polyampholytes. The methods developed and used in the present research were intended to add to the needed understanding. For example, theoretical equations related to pH titrations have been found to predict the electrokinetic properties. The conformations of polyampholytes can be simulated by computer, using Monte Carlo theory.
2. LITERATURE REVIEW
2.1 Potentiometric behavior of amphoteric polymers
Amphoteric copolymers and terpolymers have both acidic and basic groups on their chain. In general, the acidic and basic degrees of ionization are expected to depend on pH. That means that under different pH values, the net charge densities, due to dissociation of acidic and basic groups, will be different. Under a certain pH, which is called the isoelectric point of the system, the amounts of dissociated acidic and basic groups will be the same, and the net electrokinetic charge will be zero. This isoelectric pH value can be calculated for every amphoteric polymer, if certain coefficients are known and if simplifying assumptions are made.
To calculate the isoelectric pH value of a polyampholyte, it is first necessary to consider the equilibration of an individual dissociable group. The potentiometric behavior of
polyampholytes may be expressed as3,
pH = pKa+ + n log(α/(1-α)) (1-1)
pH = pKb+ + n log((1-β)/ β) (1-2)
where pKa+ and pKb+ are the apparent acidic dissociation constants of acid and basic groups,
respectively, and α and β are the degree of ionization of acid and basic groups of the polyampholytes.
following concept has been found to be useful; that is 4, to picture the charges on the molecule as being replaced by a smeared-out potential along the chain. This idea has been successfully applied to protein, which is the basis of the net charge model used in the
analysis of protein titrations. Logically, the same idea also should be applicable for synthetic polyampholytes, which share many essential similarities with proteins. In general, the interactions in a polyampholyte solution can be expected to be very complex. But in these interactions, some specific interactions between the chain and the components of the solution, or between the segments of the chain among themselves, or even between close neighbors on the chain, may be neglected, because these interactions such as H-bonding are believed not likely to influence the common run of polyampholyte titrations for common polyampholytes
4. Finally, this model only takes into account the electrostatic interactions between different
chain segments as well as between ionic groups and low molecular weight electrolytes. This type of theoretical calculation has been found to be in good agreement with experimental results obtained for 2-vinylpyridine-acrylic acid (2VP-AA) 5. However, from the
experimental results, it is also found that the pK value changes with increasing cationic or anionic charge density. Thus, there is a big deficiency in the original Katchalsky and Gillis model5. This model missed the effect of neighbor interactions. But not all neighbor
interactions need to be considered. Only those nearest neighbor interactions between oppositely charged groups are of general significance.
polymers where ionizable groups of polyampholytes are not close together 4, 7. So, besides the electrostatic interaction, nearest-neighbor effects cannot be neglected.
According to all of the information shown above, the apparent pK’ of the acidic and basic groups can be expressed as the sum of the intrinsic pK, the nearest neighbor interaction (Ed), and the long range electrostatic interaction (Er),
pKa’ = pKa + 0.434/kT (δEd/ δv) ξ + 0.434/kT (δEr/δ v) ξ (1-3)
pKb’ = pKb + 0.434/kT (δEd/ δξ) v + 0.434/kT (δEr/ δξ) v (1-4)
where v and ξ are respectively the mean number of negative and positive charges on the macromolecule, k is Boltzmann’s constant, and T is absolute temperature 3.
The long range electrostatic energy Er of the molecule, i.e., the energy due to the randomly distributed (smeared-out) charges, can be known based on the average shape of the molecule and the corresponding distribution of the small ions (counterions and neutral salt). At high ionic strength, Er equals 0. At low ionic strength this random interaction effect cannot be neglected. In many cases the titration curve with no added salt is the best we can obtain experimentally, because one can, in principle, try to correct the titration curve for the
0.434/kT (δEr/δ v) ξ or 0.434/kT (δEr/ δξ) v term, using one of several theoretical approaches.
The value of 0.434/kT (δEd/ δv) ξ or 0.434/kT (δEd/ δξ) v is determined by the structure and
chemistry of the chain. For the chemical composition factor, increasing the acidic group density enhances ionization of basic group, while increasing the basic group density
decreases the ionization of basic group. For the structure factor, the arrangement is important. In a diblock copolymer, there is no nearest-neighbor interaction, and the apparent pK equals the intrinsic pK 8.
If in isoelectric pH with high salt, the equation can be written as follows 3:
pHIEP = pKa0’ + log (αIEP/(1-αIEP)) (1-5)
pHIEP = pKb0’ + log ((1-βIEP)/βIEP) (1-6)
If pKb0’ - pKa0’ > 2, then pHIEP of a polyampholyte which contains an excess of acid
monomer (a>0.5) is calculated from:
pHIEP = pKa0’ + log ((1 - a) / (2a - 1)) (1-7)
And at an excess of base monomer (a<0.5) from:
pHIEP = pKb0’ + log ((1 - 2a) / a) (1-8)
The equation connecting the IEP of polyampholytes with the acid-to-base molar ratio and with the acid-base dissociation constants was solved by Patrickios, and it can be expressed as follows. For acid-rich (R>1) polyampholytes,
pHIEP = pKa - log{R/2[- (1-R)/R + (1-R/R)2 + (4/R)10(pKa - pKb))1/2]} (1-9)
while for base-rich polyampholyte (R<1)
pHIEP = pKb - log{1/2[(1-R)/R + (1-R/R)2 + (4/R)10(pKa - pKb))1/2]} (1-10)
But generally from the literature, all of these equations and theory are intended to be used for polyampholytes that contain only one kind of acidic and basic group by pH titration 7, 8. If there are more than one kind of acidic or basic group, then the interaction forces will be more complex between ionic groups. So whether this kind of method is still suitable is in doubt.
Another thing worth mentioning here is the iso-electric pH (IEP) value. At the IEP, the behavior of polyampholytes is very different, and it also may depend on specific
characteristics of polyampholytes 3, 9-11. At this point, the amounts of oppositely charged bound ions are almost the same, so the electrostatic attraction forces between oppositely charged groups are very high. This situation makes the polymers condense into a compact globule, squeezing out the solvent. Any low- or high-molecular-weight substances associated with polyampholytes can potentially be released at the IEP. Such release can be used as evidence that materials are behaving as polyampholytes at the IEP. The reason for this phenomenon is that there is a competition between inter- and intramolecular interactions. If the intrachain interactions of acidic and basic groups within a single macromolecule
predominate over those interactions between different chains, then the IEP effect phenomenon can be realized. This phenomenon can affect other properties of
polyampholytes, such as viscosity and adsorbed amount. In addition, Keotz et al. studied the titration curves of polyampholytes12. They found that if the positive and negative groups were titrated separately by sodium poly (styrenesulfonate) (SPSS) and poly (N,
2.2 Electrokinetic properties of amphoteric polymers
Electrokinetic analysis can be used to estimate the charge on solid surfaces, macroscopic particles, colloidal species, and macromolecular aggregates. Charges on surfaces are
important for understanding the behavior of many materials such as colloids, coatings films, films, and fibers 13. Four principal electrokinetic processes of interest are electrophoresis, sedimentation potential, electro-osmosis, and streaming potential.
Fig. 1. Schematic diagram of the electric double layer model of a non-conducting surface, including colloidal particles, in contact with an electrolyte solution (the surface is assumed to have net negative charge in this schematic). 13
Electrophoresis is by far the most common method for determining the zeta potential 14. In this method, mobility is recorded. Electrophoretic mobility is defined as the velocity per unit field
µe = v / E (2-1)
Then the zeta potential can be calculated from µe by the following equation, because µe is
directly proportional to the zeta potential.
Charged particles
Fig. 2 Electrophoretic mobility mechanism
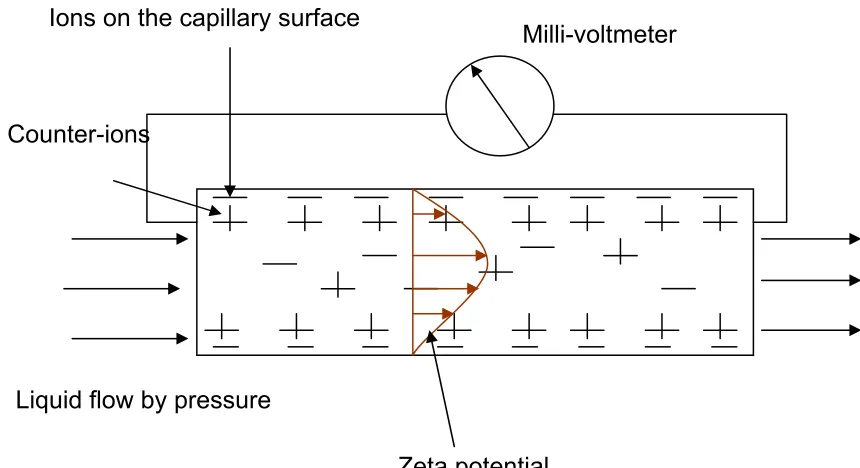
Another way to determine the zeta potential is by the streaming potential method. Compared to the electrophoresis method, streaming potential has one key advantage; it can be used for undiluted slurries sampled directly from the papermaking process 15. Because of this, the method seems more suitable for the papermaking industry. In streaming potential
measurements, the solution is made to flow by applying a pressure, and a potential is obtained in units of mV. Under the neglect of conductivity associated with the solids, the relationship between the streaming potential and the zeta potential can be estimated by the following equation:
ζ = Es ηL / ARεε0∆P (2-3)
where Es = streaming potential, η = viscosity, L = length of capillary, A = cross-sectional
Ions on the capillary surface
Milli-voltmeter
Fig 3. Streaming Potential mechanism 13
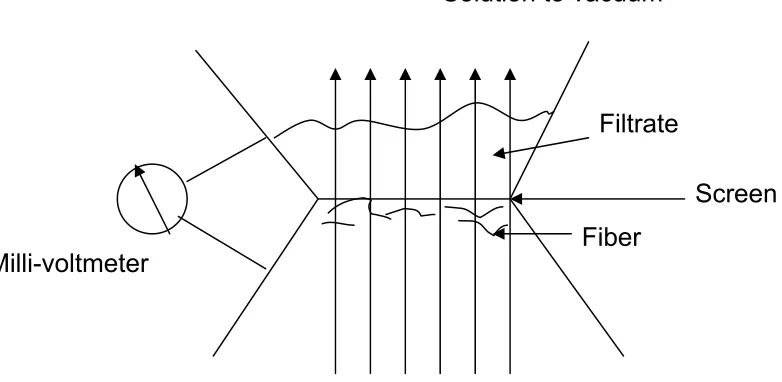
Based on the principle of streaming potential, different experimental equipment can be used. Unlike electrophoresis, which has the standard equipment for researchers to use, many researchers prefer to setting up their own streaming potential equipment depending on their research purpose 16, 17. The present work employs a streaming potential device that was designed for repeated tests and high-sensitivity with papermaking fibers. As shown by the work of Wang and Hubbe, the method is efficient and simple, especially in the case of hard wood fiber 18. In this device, there is no capillary, the fiber slurry flow through the screen to form a fiber pad. Theorists usually consider a fiber pad as being equivalent to a series of interconnecting capillaries. This difference can be seen from the figure 4.
Counter-ions
Liquid flow by pressure
Solution to vacuum
Filtrate
Screen Fiber
Milli-voltmeter
Fig. 4 The streaming potential device mechanism
One important factor for electrokinetic analysis is salt, which affects the thickness of the double-layer κ-1. Besides the salt, van de Ven 19 found that fiber conductance strongly
influences the electrophoretic mobility, streaming potential, and streaming current. Fibers can conduct a significant amount of current, except at very low pH condition or high ionic strength. So the effect of conductivity cannot be neglected in most cases.
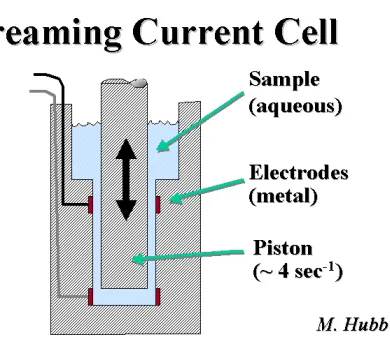
Fig 5. Streaming current equipment20
The procedures involved in measurement of streaming current are very simple. A titrant, which has the opposite charge relative to the materials in the sample, is added until the streaming current detector displays zero. The amount of polymer added indicates the charge demand of the sample. But it is not possible to interpret the absolute value of the charge density on the surface, because one important assumption for interpretation of titrations is that the interaction is stoichiometric 21. There are many unknown factors that may influence the stoichiometry of interaction. For example, increases of the salt concentration can increase the deviations from 1:1 stoichiometry 22. For some particulate materials or inflexible
2.3 Adsorption of amphoteric polymers on charged surfaces 23-25
Though the adsorption of polymers at surfaces and interfaces has been the subject of extensive theoretical and experimental studies during the last four decades, the theory of polyampholyte adsorption has been developed only within the last decade. Compared to the theory of adsorption of other polymers, the theoretical studies of polyampholyte adsorption revealed a new mechanism that is due to the polarization of chains in the external electric field created by charged objects.
Adsorption models
1. Single chain adsorption model
(1) Adsorption of a symmetric polyampholyte chain without salt
The model is as follows: a weakly charged polyampholyte chain (N < u-2f -2) with N degree of polymerization adsorbs onto an infinite plane from the dilute solution. This chain has equal numbers of positively and negatively charged groups (f+ = f-), and the plane has σ
charges per unit area. Because the concentration of counter-ions decays with increasing distance from the surface, a significant fraction of counter-ions should be localized within the Gouy-Chapman length λ. λ=(2πLBσ)-1, and LB means the Bjerrum length, in which the
electrostatic interactions dominate thermal motions for two charges.
Four regimes can be seen from the figure.
i. σ<σ1
Under these conditions there is no adsorption because the small polarization energy gain (smaller than thermal energy kT) does not justify the entropy loss.
ii. σ1<σ<σ2
This regime is called as “pole” regime. In this regime, the chain in the direction of the field is elongated by the electric field of the charged surface, while the chain in the perpendicular direction preserves its Gaussian conformation.
iii. σ2<σ<σ3
Under these conditions the system is in the “fence” regime.
In this regime the size of the chains becomes on the same order of magnitudes as the Gouy-Chapman length λ. The chain is confined within the Gouy-Chapman length and is divided into subsections of size λ. These subsections are strongly stretched, and the polymer is
strongly attracted to the surface.
Under these conditions the system is in the “pancake” regime. The thickness of a chain in the
pancake regime is on the same order of magnitude as the root-mean-square distance between
charged monomers and is almost independent on the surface charge density. In this regime, the monomers the charge of which is opposite to surface charge are within distance λ, while monomers, which has the same as surface charge are in the loops dangling in solution at
distances large than λ.
This model (“pancacke”, “fence” and “pole”) has been confirmed experimentally by
comparison of the thickness of adsorbed layer L with the gyration radius for betaine type
(2) Adsorption of a Charged Polyampholyte Chain on a Similarly Charged Surface 24
In this situation, the adsorption depends on the Coulombic interaction between the net charge
on the chain ∆fNe = N(f+ - f-)e > 0 and the charged surface. The balance of three forces
determines the adsorption results. If the net interaction energy W is negative (attractive) and
stronger than the thermal energy kT, adsorption would occur. The net interaction is given as
follows,
W = Watt + Wrep + Wimag < -kT (3-1)
where Watt + Wrep is the total energy of the polyampholyte chain W near the surface, which
consists of the attractive part Watt due to the polarization of the chain by the electric field and
the repulsive energy Wrep between the net charge on the chain and the field E. Wimag is caused
by the presence of the dielectric constant (for example, water is dielectric media with ε1, and
Fig. 8 Adsorption diagram of a polyampholyte chain as function of the surface charge density and the chain charge asymmetry, Logarithmic scales 24
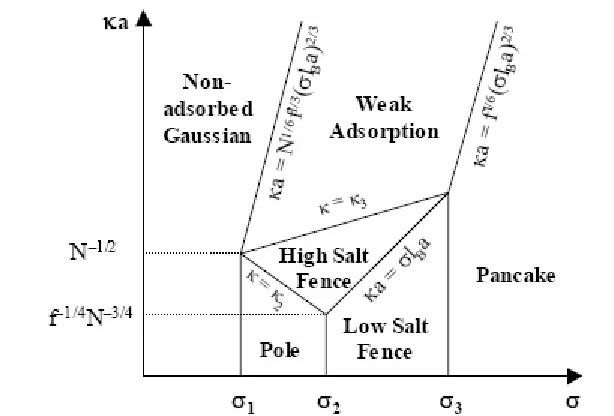
(3) Effect of added salt 24.
At very low salt concentrations (very small κa), the inverse screening length κ is larger than the Gouy-Chapman length (κ-1>λ), so the screening due to added salt is unimportant, and the
adsorption behavior of a polyampholyte chain is almost identical to that in the absence of salt. As the salt concentration increases, the model becomes complex in comparison to the
layer of thickness κ-1. In weak adsorption regime, the chain adsorbs on the surface only if the
thickness Rz is smaller than the Gaussian chain size aN1/2. In the pancake regime, the
adsorbed pancake starts to swell when the screening length becomes smaller than the size of the loop.
Fig. 9 Adsorption diagram of a polyampholyte chain in a salt solution as function of surface charge density and inverse Debye screening length, Logarithmic scales24
2. Multichain adsorption model 23, 26-28
As in the case of the single chain adsorption, the multichain adsorption model is divided into
different conditions.
(1) Adsorption of a Symmetric Polyampholyte Chain without salt
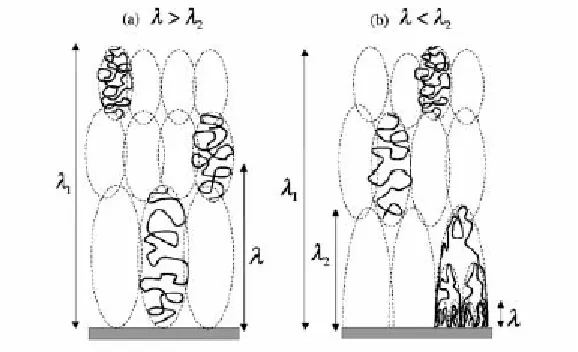
1) Multilayer of stretched chains (σ1>σ>σ2). In this regime, polyampholyte chains
are polarized and stretched by the external electric filed of the surface. At
distances λ<z<λ1, the polymer density decays as c=z-1 in a θ-solvent and as c=z-4/3
the external electric field created by surface becomes too weak to polarize the chains. So λ1 can be considered as the thickness of the adsorbed layer.
2) Self-similar stretched pseudobrush (σ2>σ>σ3 ). In this regime, the electric field
created by the charged surface is almost constant close to the surface at distances z<λ. The sections of the chains are uniformly stretched up to length scales on the order of λ. On length scales z<λ, the polymer density decays as z-1/3 in θ-solvent
and as z-1/2 in a good solvent. At length scales larger than λ
2, the polymer density
has the same profile as in the multiplayer of stretched chains.
3) Saturated self-similar stretched pseudobrush (σ>σ3). In this regime, inside a layer
thickness, which is near the wall, the strands of a chain are almost unperturbed by the external electric field and the monomer density is uniform. The surface
coverage reaches its maximum value a-2(fN)1/2ln(fN) in a θ-solvent and as a -2f3/5N2/5in a good solvent and becomes independent of the surface charge density.
On length scales between λ2 and λ3 adsorbed polyampholytes form a self-similar
pseudobrush.
Fig. 10 Schematic sketch of the configurations of polyampholyte chains in the adsorbed layers. a) Multilayer of stretched chains. b) Self-similar stretched pseudo-brush at distances from the surface z < λ2 and multilayer of stretched chains at λ2 < z < λ1.28
(2) Adsorption of a Charged Polyampholyte Chain on a Similarly Charged Surface
The different adsorption regimes depend on the charge density on the surface and the chain charge asymmetry. The graph is showed as follows.
Fig. 11 Adsorption diagram of polyampholyte chains as a function of the surface charge density and the chain charge asymmetry . 28
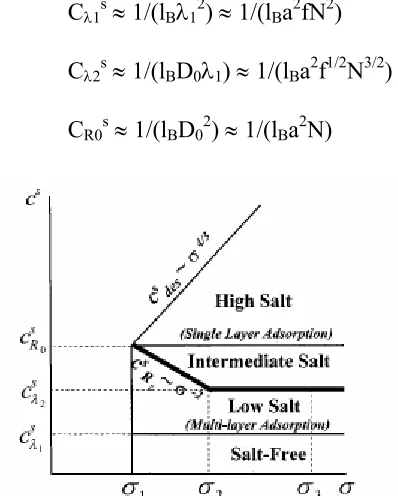
Salt also affects multiplayer adsorption, as shown in the following figure. Compared to adsorption of a single chain, multilayer adsorption is more complex in the presence of salt. Sometimes, only single layer adsorption takes place.
Cλ1s ≈ 1/(lBλ12) ≈ 1/(lBa2fN2) (3-2)
Cλ2s ≈ 1/(lBD0λ1) ≈ 1/(lBa2f1/2N3/2) (3-3)
CR0s ≈ 1/(lBD02) ≈ 1/(lBa2N) (3-4)
Fig. 12 Adsorption diagram of polyampholyte chains in a salt solution as a function of surface charge density and salt concentration28.
Figure 13. Nonmonotonic dependence of the thickness D of the adsorbed polyampholyte chain on the surface charge density σ (logarithmicscales). 23
But theory remains just theory until it can be applied. Though the models can be calculated by computer, it is still difficult to apply them to real situations, because sometimes there is no way to know all of the parameters in the equation. Also the experimental situations are invariably more complex during the real adsorption experiments. In the real experiments, kinetics and adsorption results are two main topics for research.
concentrations can definitely affect the desorption rate. Because the fiber is porous material, so the polymer can sometimes penetrate into fibers, depending the molecular weight of polymer. Wågberg and Hagglund have already used experimental data to show that the low molecular weight polymer can reach all the charges in the fiber wall, while high and medium molecular weight polymers are restricted to the external surfaces of the fibers. The same was shown by Winter and Wågberg. 31. Also their data shows that the kinetics theory of
adsorption is more complex for high molecular weight polymer than for low molecular weight polymer 32. Salt effects also have been researched 33.
With respect to the adsorbed amount, the charge density of polyampholytes and the charged surface are the two main factors, based on the adsorption models. But many parameters can influence the charge density both on polymer and substrates, such as pH, the substrate properties, and the charge ratio of the polyampholytes. Besides charge density, other factors can also influence the adsorption amount because of the adsorption process kinetics. For example, the molecular weight can affect the accessible area for polymers on the fiber surface because of the pores in the fibers. The structure of polyampholytes can influence the conformation of adsorbed polymers 34. The salt condition can also affect the conformation.
Because a little change of conditions can result a large differences of experimental results, many experiments have been done with different kinds of polyampholytes or different substrates in different conditions. For example, Mishael and Dubin researched the effect of pore size and ionic strength for adsorbing polyelectrolyte on CPG 35. Mueller researched the pH effect on protein adsorption 36. Li and Balastre studied the different effects of substrates
concerning the adsorption of PMAA-b-PDMAEMA on silicon surface, considering all of these factors.38-40 Sezaki41 researched the effects of pH, salts, and charge ratio on adsorption of DMAPAA-IA to fines-free hardwood fiber. He found that the maximized adsorption amounts appeared around the IEP of the polyampholytes. Maximum adsorption
corresponded to the condition in which the net charge of the polyampholyte was relatively low and opposite in sign to that of the substrate surface. The adsorbed amount increased with increasing conductivity under same pH condition. But more research is needed with respect to the effect of charge density.
To achieve a better understanding of adsorption phenomena, different methods have been used. Ellipsometry can be used to measure directly the adsorbed layer and layer thickness on a flat surface. Surface force apparatus (SFA) can be used to research the interaction. Small-angle neutron scattering (SANS) can be used to determine the adsorbed layer structure 42. But the problem of these methods is that only very little solution volume can be studied and the experimental situation is not representative of conditions during adsorption in an actual paper mill. So other experimental approaches should be considered. Sezaki found a new procedure for streaming current titration 41. With this method the adsorbed amount can be calculated
easily.
3. OBJECTIVES
As polyampholytes have received increasing interest in paper manufacture, as well as sludge dewatering and detergency, the properties of polyampholytes used in these industries as additives have received more and more consideration. Because many factors affect the structures of polyampholytes, which leads to the different behavior, these factors should all be researched for any kind of amphoteric samples.
Sezaki studied the effects of the pH, salt and charge ratio of amphoteric samples as strength agent in paper manufacture.41 So here our purpose is to find the relation between the colloidal behavior of polyampholytes and their charge density with same charge ratio. Also pH, as a main factor responsible for the behavior of polyampholytes, as well as charge density, are key topics of the present investigation.
Through the different experiments, it was our hope to be able to evaluate the following tentative hypotheses:
(1) It is proposed that the behavior of polyampholytes should be pH-dependent, because the charge nature on the polyampholyte chain is expected to be changed with pH. (2) It is proposed that the iso-electric point (IEPs) of polyampholytes effect also may
polyampholyte chain prefers to interact with itself, which is tentatively proposed to cause the interaction between the chains of different polyampholyte macromolecules to be very low. Based on this hypothesis it would be expected that in the vicinity of the IEP the polyampholytes should have relatively little interaction with
polyelectrolyte titrants (high charge density strong polyacids or polybases); the adsorption amount should reach a maximum; and the solution viscosity should be lowest around IEP.
(3) The behavior of polyampholytes as dry strength agents should be affected by the charge density.
(4) Polyaluminum chloride (PAC) can be used to interact with the anionic
4. PAPERS (EXPERIMENTAL, RESULTS, DISCUSSION)
4.1 Papers-Part 1
The role of polyampholyte charge density on its interactions with cellulose
Yun Wang, Martin A. Hubbe, Takao Sezaki,* Xingwu Wang, Orlando J. Rojas, and Dimitris S. Argyropoulos, Department of Wood and Paper Science, North Carolina State University, Raleigh, NC, USA, and (*) Harima Chemicals, Inc., Osaka, Japan
Keywords: Polyampholytes, dry strength, streaming potential, adsorption, pH titrations, amphoteric polymers
SUMMARY: Polyampholytes offer considerable promise as dry-strength additives, but the molecular mechanism involved in their adsorption needs to be better understood.
Amphoteric terpolymers of acrylamide, itaconic acid, and
N-[3-(NN’,N’-dimethylamine)propyl]acrylamide (DMAPAA) with a constant ratio of basic to acidic groups (5:4) were prepared by random polymerization. The basic groups ranged from 2.5 to 20 mole percent. Analysis by 1H and 13C nuclear magnetic resonance revealed near-quantitative
agreement with the make up stoichiometry.
streaming potential at low pH values and more negative streaming potentials at high pH values, compared to polyampholytes of lower charge density. At the extremes of pH, e.g. pH=3 and pH=11, the effects of a polyampholyte on streaming potential were similar to those of polyelectrolytes having a matched degree of substitution of charged monomeric groups. Except for the sample having the lowest density of charges, all of the polyampholyte samples showed a broad maximum in adsorbed amount vs. pH within the range of about pH=5 to pH=9, which is intermediate between the pKa values of the respective charged groups.
ADDRESSES OF THE AUTHORS: Yun Wang ([email protected]) Martin A. Hubbe ([email protected]), Xingwu Wang ([email protected]), Orlando J. Rojas
([email protected]) and Dimitris S. Argyropoulos ([email protected]): North Carolina State Univ., Department of Wood and Paper Science, Box 8005, Raleigh, NC 27695-8005, USA; Takao Sezaki ([email protected]): Harima Chemicals, Inc., Osaka, Japan.
Corresponding author: Martin A. Hubbe
Introduction
dry-strength capability in certain papermaking applications (Ye et al. 1990; Yoshizawa et al. 1998; Fukunaga 1999; Yoshimoto et al. 2004). Synthetic polyampholytes (Ye et al. 1990), as well as amphoteric starch products (McQueary 1990) also have shown promise for more rapid dewatering of some papermaking furnish types. A further advantage of amphoteric additives is that they are less likely to disturb the over-all balance of ionic charges in a paper machine system (McQueary 1990; Kimura, Hamada 1992), and that the adsorption efficiency onto cellulosic surfaces is observed to be high under a wide variety of conditions (Glittenberg 1993; Yoshizawa et al. 1998; Yoshimoto et al. 2004).
One of the most critical requirements that a chemical additive must satisfy to function effectively in the paper machine wet end as a dry-strength additive is efficient adsorption onto fibers and other solid surfaces (Reynolds, Wasser 1980; Howard, Jowsey 1989). In the case of ordinary polyelectrolytes, those having ionic groups with only a single sign of charge, it has been found that the adsorption efficiency can be explained based on the
pH-dependencies of the ionizable groups on the polymer and on the substrate (Wågberg 2000). Other factors affecting adsorption include the ionic strength of the solution (van de Steeg et al, 1992), the molecular mass (Pelton et al. 2003), and the charge densities of the materials (Park, Tanaka 1998; Zhang et al. 2000). An optimum charge density of cationic
polyelectrolyte has been observed in some cases, relative to maximizing the adsorbed amount on a negatively charged substrate (Lindström, Wågberg 1983; Rojas et al. 2002). Tests carried out over a range of salt concentrations have revealed a “subtle balance of forces” that determine adsorption of cationic starch and other cationic dry-strength additives onto
Though it is reasonable to expect that the dry-strengthening effect of polyampholyte additives also should be highly dependent on their interactions with cellulosic substrates, the charge relationships are expected to be more complex (Bekturov et al. 1990; Higgs, Joanny 1991; Dobrynin et al. 1997; Kudaibergenov 2002). As a working hypothesis, it is tempting to suggest that polyampholyte adsorption can be adequately explained by the net ionic charge of the macromolecule at a given pH and monomeric composition. However, such a
hypothesis fails to offer insight into the observed superior performance of this class of dry-strength chemicals. Possible mechanisms that have been considered by others to account for unique capabilities of polyampholyte molecules have included their tendency to
self-associate (Kudaibergenov 2002), their tendency to become less soluble in certain pH regions corresponding to self-neutralization (Neyret et al. 1995; Dobrynin et al. 1997; Everaers et al. 1997), and their ability to rearrange their macromolecular conformations, a process that affects their interaction with substrates of either positive or negative charge (Neyret et al. 1995).
In addition to interest in the mechanistic questions cited above, the present work was carried out to shed light on the effect of polyampholyte charge density. That is, if one holds the ratio of basic to acidic monomeric groups constant, is there an advantage, in terms of interactions with cellulose, of having a lower or higher net content of ionic groups in the polyampholyte? Also, we wanted to find out whether the streaming potentials and adsorption behavior resulting from treatment of cellulosic materials with polyampholytes and suitably matched polyacid and polybase samples could be explained in terms of their charge
Materials and Methods
Experiments were conducted in deionized water prepared with an ion-exchange system from Pureflow, Inc. Inorganic chemicals all were of reagent grade. Polyampholyte and simple polyelectrolyte samples were prepared by free-radical polymerization, following the molar recipes of charged monomers indicated in Table 1. The cationic monomer was N-[3-(N’,N’-dimethylamino)propyl]acrylamide (DMAPAA), a tertiary amine. The anionic monomer was a dicarboxylic acid, itaconic acid (IA). In each case a sufficient amount of neutral
acrylamide monomer was added to comprise 100% on a molar basis.
A typical procedure of synthesis (see G in Table) was as follows: 174 g of 40% acrylamide aqueous solution were added to a reaction vessel, 3.25 g of 80% itaconic acid and 300 g of ion exchange water were placed into a four neck flack provided with a reflux
condenser and the mixture was heated to 60 oC in a nitrogen atmosphere. Then 10 g of 1% ammonium persulfate aqueous solution were added to the reaction solution and allowed to react at 85 oC for one hour. After cooling, an anionic polyacrylamide solution (sample G)
Table 1. Synthesis of acrylamide-based polyampholytes and copolymers Sample Ionic
nature
DMAPAA (mol %)
IA (mol %)
Viscosity*
(mPa⋅s) Mw
** (106 Daltons)
A 2.5 1 5300 2.95
B 5 2 4900 2.85
C 10 4 4000 2.90
D
Ampho-teric
20 8 2400 2.93
F Cationic 5 0 3600 2.98
G Anionic 0 2 5300 3.23
* Evaluated at 25 oC; ** Mass-average molecular mass evaluated by SEC-LALLS-VIS (TDA-302, Viscotek). Note that IA is a dicarboxylic acid and
therefore the effective content of anionic (carboxylic) groups is twice the value of the respective IA mol %.
The polymer solution samples described above were first purified by two cycles of dissolution in water and precipitation in methanol; then the pure samples were collected by freeze-drying. Samples for NMR analysis were prepared by making 2-3% polymer solution in D2O. Crystals of CrK(SO4)2 were added at a concentration of 1.5 mM in order to reduce
the spin-lattice relaxation times (T1). The NMR experiments were performed in a Bruker
300MHz spectrometer equipped with a Quad dedicated probe at room temperature. The quantitative 13C spectra were acquired using an inverse gated proton decoupling sequence with a 90o pulse and a relaxation delays of 4.5 s, that was ~5 times of the longest T1
measured for the samples. The 1H spectra were measured with 60o pulse and a pulse delay of 3 s.
Potentiometric titrations were carried out with 0.1% and 1% solids solutions of the polymers in deionized water, adjustment of the pH to 3.00 with 0.1N HCl, and then
To obtain information related to the effective ionic charge of polyampholytes, titrations were carried out with a Mütek PCD-05pH streaming current detector from BTG. The cationic titrant was 1x10⁻⁴ N poly-diallyldimethylammonium chloride (poly-DADMAC), Cat. No. AS1C0019 from Nalco Chemical Co. The anionic titrant was 1x10⁻⁴ N potassium salt of poly-vinylsulfate, Cat. No. AS9S0049 from the same source. Tests were carried out in the presence of NaCl solution having an ionic strength of 1x10⁻⁴ M.
Fines-free suspensions of bleached kraft fibers were prepared from a master batch that was first refined in a laboratory Hollander beater to a Canadian Standard Freeness value of 606 ml. The refined pulp was placed in the final chamber of a Bauer-McNett fractionator, and the “retained” fraction of a 200-mesh screen was used for further testing. The freeness of the fines-free refined hardwood pulp was 708 ml.
Streaming potential tests, to determine the electrokinetic nature of the cellulosic surfaces, were carried out with the SPJ device described elsewhere (Wang, Hubbe 2001). Briefly stated, 7.5g fines-free pulp (oven dry) and a certain amount of 0.1% polyampholyte solution were added to 750ml supporting electrolyte. The pH was adjusted with dilute solutions of HCl or NaOH. The default supporting electrolyte, except where noted otherwise, contained 1x10⁻⁴ M sodium bicarbonate (to stabilize the pH near to the neutral point) and sufficient sodium sulfate to achieve an electrical conductivity of 1000 µS/cm at about 23 oC (laboratory temperature). Streaming potential measurements were conducted with a pressure differential of 207 kPa across the fiber pad.
of fines-free bleached hardwood kraft fibers at 0.5% consistency were prepared. To each aliquot, 10 ml of polymer solution was added, with continuous stirring for 5 minutes. The slurry was then filtered through a 400-mesh screen. The filtrate was adjusted to pH=3 and a conductivity of 2000 µS/cm, then titrated by 1x10⁻⁴ N PVSK. This value was then compared with a blank to calculate the adsorbed amount.
Results
Figure 1 shows the 1H NMR and 13C NMR spectra of the six samples (see Table 1). The peak assignments indicated in Fig. 1 were made with the help from our previous DEPT and 2-D NMR results (Sezaki et al. 2006).
4.0 3.5 3.0 2.5 2.0 1.5 1.0 0.5 ppm A B C D F G a b,d c NH f 2.6 ppm HN N H2N
HO OH
O O O
O a b c d f g e c
1 8 0 1 6 0 1 4 0 1 2 0 1 0 0 8 0 6 0 4 0 2 0 p p m
b c
a , d g A B C D F G
Fig. 1. 1H NMR spectra (left) and quantitative 13C NMR spectra (right) of the six
copolymer samples. The monomer compositions are summarized in Table 1.
Table 2. Composition according to preparation and by NMR analysis. AA – acrylic acid; DMAPAA – N-[3-(N’,N’-dimethylamino)propyl]acrylaminde; IA – itaconic acid
Sample DMAPAA in Feed (%)
DMAPAA by NMR (%)
IA in Feed (%)
IA by NMR (%)
A 2.5 2.6 1 1.2 B 5 5 2 2.2 C 10 9.5 4 4.8 D 20 18 8 8.4
F 5 5 0 (0.6)
G 0 0.5 2 1.8
Ionic Nature of the Polymers
Results of potentiometric titrations are given in Fig. 2a. The plotted lines were calculated based on the known content of monomeric groups in the samples and by fitting the values of the dissociation constants for the two carboxyl groups and the tertiary amine group. The values of the two pKa and the pKb constants giving the best overall fit to the data were,
respectively, 4.10, 6.82, and 9.82. As shown, the assumed values of dissociation constants yielded good agreement with the observed consumption of base as a function of pH. The agreement not only helps to confirm the values given in Table 1 for the composition of the polyampholytes, but also it is clear that the acidic and basic groups remained accessible to interaction with base throughout the pH range studied.
Because samples A through D have increasing charge densities, it makes sense to consider the expected effects of nearest-neighbor interactions (Mazur et al. 1959).
statistical probability that oppositely charge groups become neighbors. However, the results in Fig. 2a suggest no such trend, an observation that may be due to the relatively low overall ionic group content of the polymers, compared to the cited work.
Potentiometric titration results corresponding to polyampholyte sample B and two polyelectrolytes having the same density of either cationic or anionic monomer units are shown in Fig. 2b. Excellent agreement with the calculated values was obtained under acidic conditions and up to a pH of 8, based on the same assumed dissociation constants.
Deviations at yet higher pH in the case of samples B and G are tentatively attributed to the presence of residual ammonia, a byproduct of the initiator used in the free-radical
polymerization. In addition, NMR analysis of sample G showed the presence of 0.5% of the cationic monomeric groups.
Increasing charge 0 0.5 1 1.5 2 2.5 3 3.5 4
3 4 5 6 7 8 9 10 11
pH NaOH Consumed (meq/g)
A, 2.5% cat, 2% an
B, 5% cat, 4% an C, 10% cat, 8% an D, 20% cat, 16% an Lines = best fit to theory
Po lyam
pho lyte
Poly-base
Fig. 2. Results of potentiometric titrations of salt-free 0.001% polymer solutions with 1 mM NaOH. (a) Polyampholyte samples of increasing charge density, but constant ratio of acidic to basic groups. (b) Polyampholyte sample “B” compared to two simple polyelectrolyte samples having the same density of either acidic or basic groups (samples F and G).
Poly -aci d -0.2 0 0.2 0.4 0.6 0.8 1 1.2 1.4 1.6
3 4 5 6 7 8 9 10 11
pH NaOH Consumed (meq/g)
F, 5% cationic
Polyelectrolyte Titrations
Another approach to characterizing the ionic nature of a soluble polymer involves evaluation of its interactions with a known polyelectrolyte. Figure 3 shows the results of experiments in which the subject polymer solutions were titrated to a streaming current endpoint of zero, using the standard titrants poly-DADMAC and PVSK (see experimental). The plotted lines were calculated in the same way as those in Fig. 2.
-40 -30 -20 -10 0 10 20 30 40
3 4 5 6 7 8 9 10 11
pH
Streaming Current Titration Endpoint (µeq/g)
A, 2.5% cat, 2% an B, 5% cat, 4% an C, 10% cat, 8% an D, 20% cat, 16% an
Increasing charge
Increasing charge
Fig. 3a. Streaming current titration endpoints, using poly-DADMAC and PVSK standard titrants to evaluate apparent charge of polyampholytes
-40 -30 -20 -10 0 10 20 30 40
3 4 5 6 7 8 9 10 11
pH
Streaming Current Titration Endpoint (µeq/g)
F, 5% cationic B, 5% cat, 4% an G, 4% anionic
Poly-base
Fig. 3b. Streaming current titrations, as in 3a, but with polyampholyte “B” compared to simple polyelectrolytes of the same charge density (samples F and G)
Poly-ampholyte
Poly-acid
As shown in Fig. 3a, the amounts of the standard titrants required to reach a
polyampholytes. This behavior is consistent with the known mis-match in density of the ionic groups (Tse 1979; Tanaka 1983; Laine, Lindström 2000; Chen et al. 2001), noting that each of the standard titrants is fully charged throughout the range of pH studied, with one ionic group per monomeric unit.
A further conclusion can be drawn from Fig. 3a with respect to the middle values of pH. Within a pH “window” between pH values corresponding to the pKa and that pKb
constants determined by potentiometric titration, the absolute values of the titration endpoints did not exceed the predictions based on the potentiometric titrations and the known
compositions. This result might be expected, due to the decreased molecular extension that is predicted for a polyampholyte in solution at a pH value that yields approximately equal amounts of positive and negative charged groups (Bekturov et al. 1990; Higgs, Joanny 1991; Everaers et al. 1997). Thus, within the intermediate window of pH, it is reasonable to expect a reduced interaction between the standard titrants and the polyampholytes, and hence the standard titrants no longer appear “inefficient.”
Streaming Potential
Efficient utilization of a strength-enhancing additive requires attention to how the additive affects the electrostatic charge and how much of the additive can be added before the fiber surfaces reach a plateau value of charge. As shown in Fig. 4, addition of increasing amounts of polyampholyte solution to a suspension of decrilled, bleached hardwood kraft fibers resulted in a progressive change in the measured streaming potential obtained at a pressure differential of 207 kPa (30 psi). These tests were carried out in the presence of sufficient sodium sulfate to give a solution conductivity of 1000 µS/cm, with a 10-4 molar
concentration of sodium bicarbonate to stabilize the pH near to the neutral point. The results show a leveling off of the streaming potential at polyampholyte addition levels above about 0.1%, based on solid mass.
-20 -18 -16 -14 -12 -10 -8 -6 -4 -2 0
0 0.5 1 1.5 2.0 2.5
Added Amount (mg/g pulp) Streaming Potential (mV)
Bleached kraft 1000 µS/cm, pH=7 Polymer “A”
Fig. 4. Streaming potential vs. addition level of polymer “A,” having 2.5% cationic
substitution and 2% anionic substitution
streaming potential values relative to untreated MCC. At low pH the polyampholyte
treatments yielded streaming potential values that were less negative than the untreated fibers (labeled as “blank”), whereas the opposite was true at high pH values. Polyampholytes having higher charge density (increasing in the order A through D) tended to show the greatest deviations of streaming potential relative to untreated MCC.
To place the effects of the polyampholytes in context, Fig. 5b compares the streaming potential results for polyampholyte sample “B” (with 5 mole % basic groups and 4 mole % acidic groups) vs. the two simple polyelectrolytes having the same molar levels of either basic or acidic groups. As shown, the polyelectrolyte treatments resulted in much more significant differences in streaming potential relative to the untreated MCC, especially in the pH range of about 5 to 10. These pH values encompass the approximate range expected between the pKa value of carboxylic acid groups and pKb values of tertiary amine groups
present on the polymers. Though results for the polyampholyte “B” were intermediate between those for the respective simple polyelectrolytes, “B” yielded results more similar to the poly-base “F” at pH values below 5 and more similar to the poly-acid “G” at pH=10.
-25 -20 -15 -10 -5 0
3 4 5 6 7 8 9 10 11
pH Streaming Potential (mV)
D B
Blank A
C
MCC, 1000 µS/cm, polyampholyte treatments
Increasing charge
Fig. 5a. Polyampholyte charge density and pH effects on streaming potential of MCC compared at 0.08% polymer on cellulose dry mass
-25 -20 -15 -10 -5 0
3 4 5 6 7 8 9 10 11
pH Streaming Potential (mV)
F G B Blank
MCC, 1000 µS/cm
Poly-acid Poly-base
Poly-ampho lyte
Figure 6 shows results of similar tests carried out in bleached hardwood kraft fibers. The treatment level of polymer on bleached kraft fibers was 0.213%, on a dry basis. Though the same discussion points can be made, as in Fig. 5, the contrasts are yet more distinct, and the differences relative to the untreated fibers tend to be greater. All of the polyampholyte samples shifted the streaming potential to about the same extent when the pH was in the range of about 7 to 9. This range is near to the expected isoelectric point, based on the composition of these polyampholytes (Alfrey, Pinner 1957; Long et al. 1998).
As shown in Fig. 6B, the poly-acid sample “G” had almost no detectable effect relative to the streaming potential of untreated bleached kraft fibers. By contrast, the cationic polyelectrolyte (poly-base) “F” strongly reversed the charge of the fibers up to a pH above 9. The pH-dependency of the streaming potential after treatment with polyampholyte was almost linear with pH, reflecting a progressive change in the ionic nature exposed at the fiber surfaces. Kraft fiber Increasing charge -16 -12 -8 -4 0 4 8 pH Blank A B C D
2 4 6 8 10 12
Streaming Potential (mV)
Increasing charge
Fig. 6a. Polyampholyte charge density and pH effects on streaming potential of bleached hardwood kraft fibers
Kraft fiber Poly-acid Poly-base Poly-ampho lyte -20 -15 -10 -5 0 5 10 pH B F G Blank
2 4 6 8 10 12
Streaming Potential (mV)
Adsorption
Figure 7a shows the results of tests in which fiber suspensions were mixed with solutions of soluble polymer. To determine the adsorbed amount, filtrate from the suspensions was adjusted to a pH of 3 and then titrated with 1x10⁻⁴ N PVSK to a streaming current endpoint of zero. The total amount of polymer added was 1 g per 100 g of pulp, and tests were carried out in the presence of sodium sulfate, giving a conductivity of 1000 µS/cm. As shown, all of the polyampholytes were found to adsorb efficiently, especially at mid-range pH values of about 5 to 9. Somewhat lower adsorption was observed in the case of the lowest-charge polyampholyte, sample “A”, having a molar concentration of 2.5% basic groups and 2% acidic groups.
As shown in Fig. 7b, the cationic polyelectrolyte, sample F, adsorbed less efficiently, compared to polyampholyte “B,” having the same molar proportion of tertiary amine groups. The observed increase in adsorption of the cationic polyelectrolyte with increasing pH is consistent with expected increases in negative surface charge density, an effect that also can cause the fiber to swell and become more accessible (Grignon, Scallan 1980; Lindström 1992). Superior adsorption efficiency of the cationic polymer, relative to the polyampholyte, was observed only near to pH=9. The severe drop-off in adsorption of the cationic polymer above pH=10 is consistent with the dissociation constant of the tertiary amine group
0.0 0.1 0.2 0.3 0.4 0.5 0.6 0.7 0.8 0.9 1.0
3 4 5 6 7 8 9 10 11
pH
Adsorbed Amount (g/100g pulp)
A, 2.5% cat, 2% an B, 5% cat, 4% an C, 10% cat, 8% an D, 20% cat, 16% an
Fig. 7a. Adsorption of polyampholytes onto cellulose fibers as a function of pH and charge density
Poly-base
Po ly-amph olyte 0.0 0.1 0.2 0.3 0.4 0.5 0.6 0.7 0.8 0.9 1.0
3 4 5 6 7 8 9 10 11
pH
Adsorbed Amount (g/100g pulp)
B, 5% cat, 4% an F, 5% cationic
Fig. 7b. Adsorption of polyampholyte B compared to two simple
polyelectrolytes having the same densities of acidic or basic groups (samples F and G).
Discussion
danger that the sign of charge of the system could be strongly reversed, with possible adverse consequences on paper machine operations.
Streaming current titration results in Fig. 3a suggest a possible synergistic effect between polyampholyte dry-strength and other charged polymers, such as retention aids. Strong adsorption onto furnish solids is a prerequisite for high retention aid efficiency (Horn, Linhart 1991; Doiron 1998). For example, anionic acrylamide copolymer retention aids are generally ineffective when added to a net-negative suspension of cellulosic fibers in the absence of cationic agents (Hubbe 2001). Results in Fig. 3a show, however, that the polyampholytes were able to interact strongly with polyelectrolytes of either positive or negative charge. This observation is consistent with a possible role of polyampholytes in serving as anchoring points for retention aid polymers.
With respect to the role of polyampholytes in promoting dry strength, the most interesting aspect of the present results involves the relatively wide maxima in the curves of adsorbed amount vs. pH. As mentioned in the introduction, efficient adsorption can be considered as a prerequisite for efficient use as a strength additive for the wet end. As shown in Fig. 7a, efficient adsorption was observed between the pH values of about 5 and 9.
According to Fig. 3a, the isoelectric points of the polyampholyte samples were
associate with like macromolecules and to precipitate readily from solution under conditions in which charges of both sign are present at comparable levels (Everaers et al. 1997).
Conclusions
1. The composition of a series of polyampholyte and polyelectrolyte samples synthesized for this study showed excellent agreement between the synthesis recipes, NMR analyses, and potentiometric titration results.
2. Potentiometric titration data were fitted reasonably well based on a single set of dissociation constants for the acidic and basic groups of the polymer samples. The pKa
values of the two kinds of carboxyl groups in the samples were determined to be 4.1 and 6.8. The pKb value of the tertiary amine group was 9.8.
3. Though the polyampholyte samples showed a strong ability to undergo complexation interactions with high-charge-density, strong polyacid or polybase titrants at the extremes of pH, streaming current titrations indicated that the samples had less apparent charge within a “window” of intermediate pH between about 6 and 9, a range in which charged groups of both sign are present on the macromolecules.
4. Streaming potential tests, by contrast, showed an almost linear response to pH, when either microcrystalline cellulose (MCC) or bleached kraft fibers had been treated with polyampholyte solution. This behavior was in contrast to that of polyelectrolytes, for which the streaming potential of the treated cellulosic surfaces remained almost independent of pH in the range between about 6 and 9.
a range where ionic groups of each sign are present at comparable levels. Polybase adsorption, under matched conditions of molecular mass, charge density, and suspension characteristic, was generally lower, compared to the corresponding polyampholyte. A polyacid having the same content of carboxyl groups as one of the polyampholytes failed to show significant adsorption.
Acknowledgments
The authors wish to acknowledge the support of the National Research Initiativeof the USDA Cooperative State Research, Education and Extension Service, grant number 2004-35504-14655. In-kind support provided by Harima Chemicals, Inc. is also gratefully acknowledged.
Literature
Alfrey, T. and Pinner, H. (1957): Preparation and titration of amphoteric polyelectrolytes, J. Poly. Sci. 23(104), 533.
Bekturov, E.A., Kudaibergenov, S.E. and Rafikov, S.R. (1990): Synthetic polymeric ampholytes in solution, Rev. Macromol. Chem. Phys. C30(2), 233.
Chen. J., Hubbe, M.A. and Heitmann, J.A. (2001): Measurement of colloidal charge in the paper mill by streaming current, Proc. TAPPI Papermakers Conf.
Claesson, P.M., Dedinaite, A. and Rojas, O.J. (2003): Polyelectrolytes as adhesion modifiers, Adv. Colloid Interface Sci. 104(1-3), 53.
Dobrynin, A.V., Rubinstein, M. and Joanny, J.-F. (1997): Adsorption of a polyampholyte chain on a charged surface, Macromolecules 30, 4332.
Doiron, B.E. (1998): Retention aid systems, in “Retention of Fines and Fillers during Papermaking,” Edited J.M. Gess, TAPPI Press, Atlanta, pp. 159-176.
Everaers, R., Johner, A. and Joanny, J.-F. (1997): Polyampholytes: From single chains to solutions, Macromolecules 30(26), 8478.
Fukunaga, Y. (1999): New application method of dry strength agents by effective utilization of amphoteric polyacrylamide and aluminum sulfate, Proc. Japan TAPPI Ann. Mtg., 349. Glittenberg, D. (1993): Starch alternatives for improved strength, retention, and sizing, Tappi J. 76(11), 215.
Grignon, J. and Scallan, A.M. (1980): Effect of pH and neutral salts upon the swelling of cellulose gels, J. Appl. Poly. Sci. 25(12), 2829.
Horn, D. and Linhart, F. (1991): Retention aids, in “Paper Chemistry,” Edited J.C. Roberts, Blackie, Glasgow, pp. 44-62.
Horn, D. and Melzer, J. (1975): Effect of high molecular mass cationic dewatering aids on the electrokinetic properties of cellulosic fibers, Wochenbl. Papierfabr. 29(12), 534.
Howard, R.C. and Jowsey, C.J. (1989): The effect of cationic starch on the tensile strength of paper, J. Pulp Paper Sci. 15 (6), J225.
Hubbe, M.A. (2001): Reversibility of polymer-induced fiber flocculation by shear. 2. Multi-component chemical treatments, Nord. Pulp Paper Res. J. 16(4), 369.
Kimura, Y. and Hamada, M. (1992): Wet-end paper chemicals in secondary fiber system, Proc. 1992 Pan-Pacific Pulp & Paper Tech. Conf., Part B, Japan TAPPI, 83.
Kitaoka, T. and Tanaka, H. (2001): Novel paper strength additive containing cellulose-bonding domain of cellulase, J. Wood Sci. 47(4), 322.
Kudaibergenov, S.E. (2002): “Polyampholytes Synthesis, Characterization and Application,” Kluwer Academic/Plenum Publ., New York.
Laine, J. and Lindström, T. (2000): The colloid/polyelectrolyte titration technique – A review and an appraisal of the technique, ED/COST E14 Workshop: New Measurement Techniques for Monitoring White Water Chemistry In Papermaking, Lisbon.
Lindström, T. (1992): Chemical factors affecting the behavior of fibers during papermaking, Nordic Pulp Paper Res. J. 7(4), 181.
Lindström, T. and Wågberg, L. (1983): Effects of pH and electrolyte concentration on adsorption of cationic polyacrylamides on cellulose, Tappi J. 66(6), 83.
Lindström, T., Wågberg, L. and Larsson, T. (2005): On the nature of joint strength in paper – A review of dry and wet strength resins used in paper manufacturing, 13th Fundamental Res. Symp., Cambridge, UK., pp. 457-562.
Long, D., Dobrynin, A.V., Rubinsteain, M. and Ajdari, A. (1998): Electrophoresis of polyampholytes, J. Chem. Phys. 108(3), 1234.
Lorenćak, P., Stange, A., Neißner, M. and Esser, A. (2000): Polyvinylamine – A new polymer for increasing paper strength, Wochenbl. Papierfabr. 128(1/2), 14.
Mahltig, B., Walter, H., Harrats, C., Müller-Buschbaum, P., Jérôme, R. and Stamm, M. (1999): Adsorption of polyampholyte copolymers at the solid/liquid interface: the influence of pH and salt on the adsorption behavior, Phys. Chem. Chem. Phys. 1, 3853.
Mazur, J., Siberberg, A. and Katchalsky, A. (1959): Potentiometric behavior of polyampholytes, J. Polymer Sci. 35(128), 43.
McKague, J.F., Etter, D.O., Pilgrim, J.O. and Griggs, W.H. (1974): Practical applications of the electrokinetics of papermaking, Tappi 57(12), 101.
McQueary, R.T. (1990): Wet end waxy amphoteric starch impacts drainage, retention, and strength, Proc. TAPPI 1990 Papermakers Conf., pp. 137-142.
Merle, Y. (187): Synthetic polyampholytes. 5. Influence of nearest-neighbor interactions on potentiometric curves, J. Phys. Chem. 91(11), 3092.
Neyret, S., Ouali, L., Candau, F. and Pefferkorn, E. (1995): Adsorption of polyampholytes on polystyrene latex: Effect on colloid stability, J. Colloid Interface Sci. 176(1), 86.
Park, S.-B., Tanaka, H. (1998): Effects of charge densities of cationic polyacrylamides on strength properties of handsheets, Mokusai Gakkaishi 44(3), 199.