HIGHLIGHTED ARTICLE INVESTIGATION
A Major Controversy in Codon-Anticodon
Adaptation Resolved by a New Codon Usage Index
Xuhua Xia1
Department of Biology, University of Ottawa, Ottawa, Ontario, K1N 6N5 Canada ORCID ID: 0000-0002-3092-7566 (X.X.)
ABSTRACT Two alternative hypotheses attribute different benefits to codon-anticodon adaptation. Thefirst assumes that protein production is rate limited by both initiation and elongation and that codon-anticodon adaptation would result in higher elongation efficiency and more efficient and accurate protein production, especially for highly expressed genes. The second claims that protein production is rate limited only by initiation efficiency but that improved codon adaptation and, consequently, increased elongation efficiency have the benefit of increasing ribosomal availability for global translation. To test these hypotheses, a recent study engineered a synthetic library of 154 genes, all encoding the same protein but differing in degrees of codon adaptation, to quantify the effect of differential codon adaptation on protein production inEscherichia coli. The surprising conclusion that“codon bias did not correlate with gene expression”and that“translation initiation, not elongation, is rate-limiting for gene expression”contradicts the conclusion reached by many other empirical studies. In this paper, I resolve the contradiction by reanalyzing the data from the 154 sequences. I demonstrate that translation elongation accounts for about 17% of total variation in protein production and that the previous conclusion is due to the use of a codon adaptation index (CAI) that does not account for the mutation bias in characterizing codon adaptation. The effect of translation elongation becomes undetectable only when translation initiation is unrealistically slow. A new index of translation elongationITEis formulated to facilitate studies on the efficiency and evolution of the translation machinery.
KEYWORDScodon usage bias; codon-anticodon adaptation; translation elongation; translation efficiency; index of translation elongation
F
OLLOWING empirical documentation of the correlation between codon usage and tRNA abundance (Ikemura 1981a,b, 1982, 1992), many studies have demonstrated a strong relationship not only between codon adaptation and gene expression (Coghlan and Wolfe 2000; Comeron and Aguade 1998; Duret and Mouchiroud 1999; Xia 2007) but also between experimentally modified codon usage and protein production (Haaset al.1996; Ngumbelaet al.2008; Robinson et al. 1984; Sorensen et al. 1989). These results have led to the explicit formulation of codon-anticodon co-evolution and adaptation theory (e.g., Akashi 1994; Moriyama and Powell 1997; Ran and Higgs 2012; Xia 1998, 2008), which states that (1) protein production is rate limited byboth translation initiation and elongation efficiency, (2) codon usage and tRNA anticodons coevolve to adapt to each other, resulting in increased production of correctly translated pro-teins, and (3) the increased elongation efficiency and accu-racy represent the driving force for the highly expressed genes to acquire a high degree of codon-anticodon adapta-tion. These studies not only advanced our understanding of the joint effect of mutation and selection on codon usage (Chithambaram et al. 2014a,b; Palidwor et al. 2010) but also resulted in improved computational tools for character-izing codon usage and codon-anticodon adaptation (Sun
et al.2013; Xia 2007).
Whether translation elongation is a rate-limiting process in protein production has been controversial. Early theoret-ical considerations (Andersson and Kurland 1983; Bulmer 1990, 1991; Liljenstrom and von Heijne 1987) tended to favor the argument that translation elongation is not rate limiting in protein production but that translation initiation is. This hypothesis states that codon-anticodon adaptation and increased elongation efficiency are not related to pro-tein production. Instead, the benefit of codon adaptation
Copyright © 2015 by the Genetics Society of America doi: 10.1534/genetics.114.172106
Manuscript received October 24, 2014; accepted for publication December 5, 2014; published Early Online December 5, 2014.
Available freely online through the author-supported open access option.
Supporting information is available online athttp://www.genetics.org/lookup/suppl/ doi:10.1534/genetics.114.172106/-/DC1.
and increased elongation efficiency is to increase ribosomal availability for global translation.
To test these two alternative hypotheses, Kudlaet al.(2009) engineered a synthetic library of 154 genes, all encoding the same greenfluorescent protein inEscherichia colibut differing in synonymous sites [and consequently the degree of codon adaptation, as measured by codon adaptation index (CAI)]. All sequences share an identical 59-UTR that is 144 nt long, so there is no variation in the Shine-Dalgarno sequence. Because the engineered genes all encode the same protein, it is justifi -able to use protein abundance as a proxy for protein pro-duction (assuming that protein molecules sharing the same amino acid sequence have the same degradation rate).
Kudla et al. (2009) interpreted minimum folding energy (MFE), computed from sites 24 to +37 (where ribosomes position themselves at the initiation codon), as a proxy for initiation efficiency. The rationale for using MFE as a measure of translation initiation is that an initiation codon would be inaccessible if it were embedded in a strong secondary struc-ture and that accessibility of the initiation codon is a key de-terminant of translation initiation efficiency (Nakamoto 2006). A stable secondary structure in sequences flanking the start codon has been shown experimentally to inhibit translation initiation (Ostermanet al.2013). MFE can be computed by using DAMBE (Xia 2013), which implements the RNA fold-ing library from the Vienna RNA package (Hofacker 2003). Kudlaet al.(2009) interpreted CAI as a proxy for trans-lation elongation. If both transtrans-lation initiation and transla-tion elongatransla-tion contribute to translatransla-tion efficiency, then protein production is expected to depend on both MFE and CAI. If only translation initiation is important, then pro-tein production will depend only on MFE. These authors found that MFE accounts for 44% of the variation in protein production but that CAI is essentially unrelated to protein production. They concluded, consequently, that“translation initiation, not elongation, is rate-limiting for gene expres-sion”(Kudlaet al.2009, p. 258).
The conclusion by Kudlaet al.(2009), however, is based on two critical assumptions: (1) that MFE and CAI are good proxies of translation initiation and elongation efficiencies, respectively, and (2) that the effect of translation elongation is independent of translation initiation. The problem with the second assumption has been pointed out recently (Supek and Smuc 2010); Tuller et al. (2010) reanalyzed the data in addition to providing an overwhelming amount of additional empirical evidence to demonstrate the joint effect of both translation initiation and translation elonga-tion on protein producelonga-tion. In short, the protein producelonga-tion rate is expected to increase with elongation efficiency only when translation initiation is efficient. If translation initia-tion is slow, then an increasing elongainitia-tion rate is not expected to increase protein production. Kudla et al. (2009) ignored the dependence of elongation effect on translation initiation. However, the results reported by Tulleret al.(2010) are not much different from those of Kudla et al.(2009). The key finding from the reanalysis (Tulleret al. 2010) is that
the effect of codon usage bias on protein production is only marginally significant when translation initiation (with MFE as proxy) is controlled for. The partial correlation between codon usage bias and protein production is only marginally significant (P= 0.04), accounting for less than 3% of the total variation in protein abundance. This finding simply reinforces the original conclusion of Kudlaet al.(2009) that the effect of codon usage and translation elongation on pro-tein production is negligible relative to that of translation initiation (with MFE as proxy), which accounts for 44% of the total variation in protein production.
CAI by Kudlaet al.(2009) and translation adaptation index (tAI) by Tulleret al.(2010) as proxies for translation elonga-tion efficiency are both problematic and can lead to serious bias, as will be illustrated in the next section. In this paper, I develop a new CAI that accommodates the background mu-tation bias. I found that translation elongation accounts for about 17% of total variation in protein production.
Necessity of a New Translation Elongation Index
Many gene-specific codon usage indices have already been formulated and improved, including CAI (Sharp and Li 1987; Xia 2007), tAI (dos Reis et al.2004) and several in-dices that are based on coding sequences only, such as the effective number of codons N^c (Wright 1990) and its
im-proved versions (Novembre 2002; Sun et al. 2013) and the codon deviation coefficient (CDC) (Zhanget al.2012). Thefirst two have been used frequently as proxies for trans-lation elongation efficiency, whereas the others are typically not related to translation rate. For example, in contrast to CAI and tAI, which are at least positively correlated with the protein production data in Kudlaet al.(2009), CDC is neg-atively correlated with protein production, although the cor-relation is not significant (r=20.1254,P= 0.1211).
The problem with tAI is that codon usage bias is not always inferable from tRNA gene copy numbers or experi-mentally measured tRNA abundance because codon and anticodon do not always pair as expected according to the wobble or extended wobble hypothesis (Crick 1966; Grosjean
et al.2007, 2010). For example, inosine is expected to pair best with C and U, less with A (partly because of the bulky I-/A pairing involving two purines), and not with G. How-ever, tRNAVal/IACfrom rabbit liver pairs better with the GUG
codon than with other synonymous codons (Jank et al.
1977; Mitra et al. 1977). Similarly, the Bacillus subtilis ge-nome codes a tRNAAla/GGCfor decoding GCY codons, but the
GCC codon that forms the Watson-Crick base pair with the anticodon is not used as frequently as the GCU codon, which wobble-pairs with the anticodon. One might argue that based on previous studies (Fiers and Grosjean 1979; Grantham
a strong binding at the third codon position is preferred, with weak binding occurring at thefirst two codon positions. Thus, GCU is preferred by anticodon GGC because of the strong binding at the first two codon positions. However, this explanation does not work for Gly, where four
tRNAGly/GCC genes are present for decoding GGY codons,
and GGC is used more frequently than GGU (Sun et al.
2013). Furthermore, codon-anticodon base pairing is known to be context dependent (Lustig et al. 1989), for example, a wobble cmo5U in the anticodon of tRNAPro; tRNAAlaand
tRNAValcan read all four synonymous codons in the
respec-tive codon family, but the same cmo5U in tRNAThr cannot
read C-ending codons (Nasvallet al.2007). For this reason, the optimal codon usage is likely better approximated by the codon usage of highly expressed genes than by what we can infer based on codon-anticodon pairing. Consistent with this proposition, CAI, which is based on the codon usage of highly expressed genes (HEGs), performs better in predict-ing protein production or abundance than other indices based on tRNAs (Coghlan and Wolfe 2000; Comeron and Aguade 1998; Duret and Mouchiroud 1999).
CAI has its own problems, however. Other than those outlined previously (Xia 2007), it often leads to a wrong in-terpretation of tRNA-mediated selection. I illustrate this prob-lem here with the Ala codon subfamily GCR (where R stands for either A or G). The frequencies of GCA and GCG inE. coli
HEGs, as compiled and distributed with EMBOSS (Riceet al.
2000), are 1973 and 2654, respectively, which may lead one to think that the E. coli translation machinery prefers GCG over GCA. However, the codon frequencies of GCA and GCG for E. coli non-HEGs are 25,511 and 43,261, respectively. Thus, GCA is relatively more frequent in E. coli HEGs than inE. coli non-HEGs. This suggests that mutation bias favors GCG but that tRNA-mediated selection favors GCA, which is relatively more preferred byE. coliHEGs. This interpretation is corroborated by theE. coligenome encoding three tRNAArg
genes for GCR codons, all with a UGC anticodon forming a perfect Watson-Crick base pair with codon GCA.
For the NNR or NNY codon family or subfamily, we first definePi.HEGandPi.non-HEGas the proportion of codon i within
its R- or Y-ending family forE. coliHEGs and non-HEGs. For example, take data for codons GCA and GCG in Table 1
PGCA:HEG¼
NGCA:HEG
NGCR:HEG¼
1973
1973þ2654¼0:42641
PGCA:non-HEG¼NGCA:non-HEG
NGCR:non-HEG¼
25;511
25;511þ43;261¼0:37095
SGCA¼
PGCA:HEG
PGCA:non-HEG¼1:1495;
SGCG¼
PGCG:HEG
PGCG:non-HEG¼
0:9118
(1)
whereSGCAandSGCGmay be viewed as relative codon
fre-quencies of HEGs corrected for the“background”non-HEGs.
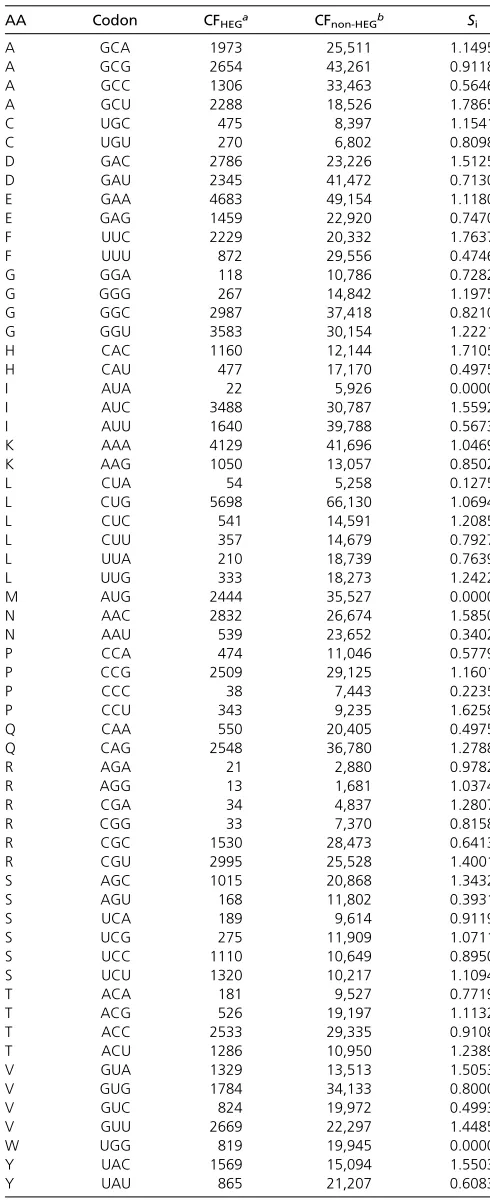
Table 1 Codon frequency (CF) for E. colihighly expressed genes (HEGs) and non-HEGs, as well as the computedSivalues according to Equation 1
AA Codon CFHEGa CFnon-HEGb Si
A GCA 1973 25,511 1.1495
A GCG 2654 43,261 0.9118
A GCC 1306 33,463 0.5646
A GCU 2288 18,526 1.7865
C UGC 475 8,397 1.1541
C UGU 270 6,802 0.8098
D GAC 2786 23,226 1.5125
D GAU 2345 41,472 0.7130
E GAA 4683 49,154 1.1180
E GAG 1459 22,920 0.7470
F UUC 2229 20,332 1.7637
F UUU 872 29,556 0.4746
G GGA 118 10,786 0.7282
G GGG 267 14,842 1.1975
G GGC 2987 37,418 0.8210
G GGU 3583 30,154 1.2221
H CAC 1160 12,144 1.7105
H CAU 477 17,170 0.4975
I AUA 22 5,926 0.0000
I AUC 3488 30,787 1.5592
I AUU 1640 39,788 0.5673
K AAA 4129 41,696 1.0469
K AAG 1050 13,057 0.8502
L CUA 54 5,258 0.1275
L CUG 5698 66,130 1.0694
L CUC 541 14,591 1.2085
L CUU 357 14,679 0.7927
L UUA 210 18,739 0.7639
L UUG 333 18,273 1.2422
M AUG 2444 35,527 0.0000
N AAC 2832 26,674 1.5850
N AAU 539 23,652 0.3402
P CCA 474 11,046 0.5779
P CCG 2509 29,125 1.1601
P CCC 38 7,443 0.2235
P CCU 343 9,235 1.6258
Q CAA 550 20,405 0.4975
Q CAG 2548 36,780 1.2788
R AGA 21 2,880 0.9782
R AGG 13 1,681 1.0374
R CGA 34 4,837 1.2807
R CGG 33 7,370 0.8158
R CGC 1530 28,473 0.6413
R CGU 2995 25,528 1.4001
S AGC 1015 20,868 1.3432
S AGU 168 11,802 0.3931
S UCA 189 9,614 0.9119
S UCG 275 11,909 1.0711
S UCC 1110 10,649 0.8950
S UCU 1320 10,217 1.1094
T ACA 181 9,527 0.7719
T ACG 526 19,197 1.1132
T ACC 2533 29,335 0.9108
T ACU 1286 10,950 1.2389
V GUA 1329 13,513 1.5053
V GUG 1784 34,133 0.8000
V GUC 824 19,972 0.4993
V GUU 2669 22,297 1.4485
W UGG 819 19,945 0.0000
Y UAC 1569 15,094 1.5503
Y UAU 865 21,207 0.6083
aTaken from the Ecoli_high.cutfile distributed with EMBOSS 6.4 (Riceet al.2000)
repre-senting a compilation of codon usage from known highly expressedE. coli K12genes.
bMean codon frequencies from four sequencedE. coli K12genomes (NC_010473,
Codon i is considered selected for if Si .1 and against if
Si,1. Thus, codon GCA is considered selected for because,
according to Equation 1, SGCA .0. This insight would be
obscured if we were to use codon frequency data from only
E. coliHEGs or only non-HEGs, which would have suggested that codon GCA is selected against. The Si values for the
sense codons inE. coliare listed in Table 1.
The index of translation elongationITEis then calculated
in a way similar to CAI except that the computation is ap-plied to NNR and NNY codon subfamilies:
wi¼ Si
MaxðSiÞ;
e:g:; wGCA¼1:1495
1:1495¼1;
wGCG¼
0:9118
1:1495¼0:7932
(2)
ITE¼e PNs
i¼1 Filnwi
PNs
i¼1 Fi
(3) whereFiis the frequency of codon i, andNsis the number of
sense codons (excluding those in single-codon families). For example, AUG for methionine, AUA for isoleucine, and UGG for tryptophan in the standard genetic code are excluded from computingITE. Just like CAI, tAI, andN^c,ITEis a gene-specific
index of codon usage bias.
The main reason for dividing codons into the R- and Y-ending groups is that for genes encoded by the nuclear genome, the R-ending codons are typically decoded by two types of tRNA species (one with a wobble C and the other with a wobble U), whereas the Y-ending codons are decoded typically by a single type of tRNA species with either a wobble G or a wobble A modified to inosine, but never by both (Grosjean et al.2007; Marck and Grosjean 2002). For this reason, the R- and Y-ending codons, even within a single fourfold codon family, are subject to different tRNA-mediated selection and therefore should be treated sepa-rately. However, for comparative purposes, I have chosen to include the other two alternative approaches for comput-ingITE, that is, one with compound six- and eightfold codon
families broken into two- and fourfold codon families and the other lumping all synonymous codons into one codon family. A new version of DAMBE (Xia 2013) has been uploaded with all three approaches included. One may ac-cess the function by clicking on“Seq.Analysis|Codon usage| Index of translation elongation.”
One may note that CAI is a special case ofITEwhen there
is absolutely no codon usage bias in non-HEGs in all codon subfamilies. That is, when NGCA.non-HEG = NGCG.non-HEG,
NGCC.non-HEG=NGCU.non-HEG, and so on. The range ofITE is
the same as CAI, that is, between 0 and 1. The reason for separating synonymous codons into R- and Y-ending codon subfamilies is that they are typically translated by different tRNAs and subject to different mutation bias. I have outlined the problems of lumping synonymous codons together and illustrated the benefit of treating R- and Y-ending codons separately elsewhere (Sunet al.2013; Xia 2007).
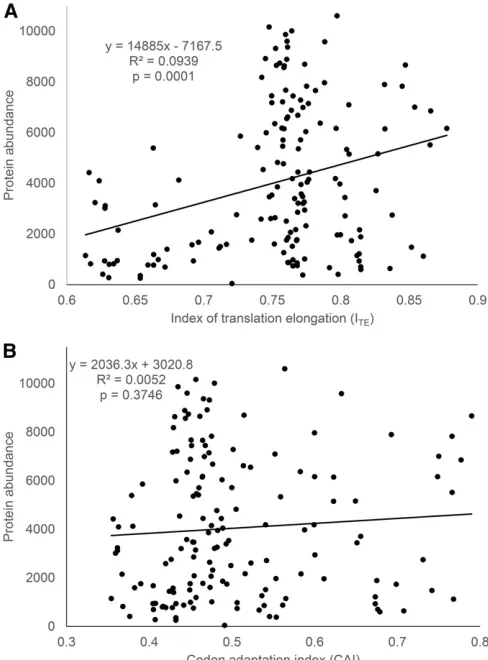
The relationship between protein abundance andITE
(Fig-ure 1a) for the data from Kudla et al.(2009) is contrasted with that between protein abundance and CAI (Figure 1b). There are three points worth highlighting. First, a highly sig-nificant relationship between protein abundance and trans-lation elongation is revealed by the new ITE, accounting for
nearly 10% of the total variation in protein abundance (P= 0.0001) (Figure 1a). In contrast, no relationship exists be-tween protein abundance and CAI (Figure 1b). Second, when
ITEis small (e.g.,ITE,0), protein abundance is generally low,
which suggests that translation elongation is limiting. Third, a large ITE (efficient translation elongation) does not imply
high protein production because translation initiation is also limiting. A largeITEwill lead to increased protein production
only if translation initiation is also efficient.
One may argue thatITEshould be computed without the first 36 bases because these sites have already been used in computing MFE. I have computed codon frequencies andITE
without the first 36 bases (designated ITE_shortCDS) and
added this to Supporting Information,Table S1.ITE_shortCDS
and ITE_full-lengthCDS (the original ITE with full-length CDS)
are almost perfectly correlated (r= 0.9976).
Figure 1 Relationship between protein abundance (measured by GFP normalizedfluorescence; data kindly provided by Dr. Plotkin) and trans-lation elongation efficiencyITE, contrasting with that between protein
Conceptual Framework for Evaluating the Effect of Translation Initiation and Elongation
It is only genes with efficient translation initiation that are expected to increase protein production with improved codon-anticodon adaptation. If we express the protein pro-duction rateProtas a linear function of elongation efficiency
ITE, that is,
Prot¼aþbITE (4)
we would expect the slopebto change with initiation effi -ciency. A low initiation efficiency implies little benefit for highITE, andbshould be close to 0. In contrast, elongation
efficiency would become rate limiting with high translation initiation efficiency, and we would expectbto increase with translation initiation efficiency.
I tested these predictions by using the original data in Kudlaet al.(2009) with the same proxies that they used for Protand translation initiation; that is, Protwas mea-sured by normalized GFP fluorescence level and transla-tion initiatransla-tion efficiency by MFE of the sequencesflanking the initiation codon, from sites24 to +37. I replaced their CAI by ITEas a proxy for translation elongation efficiency.
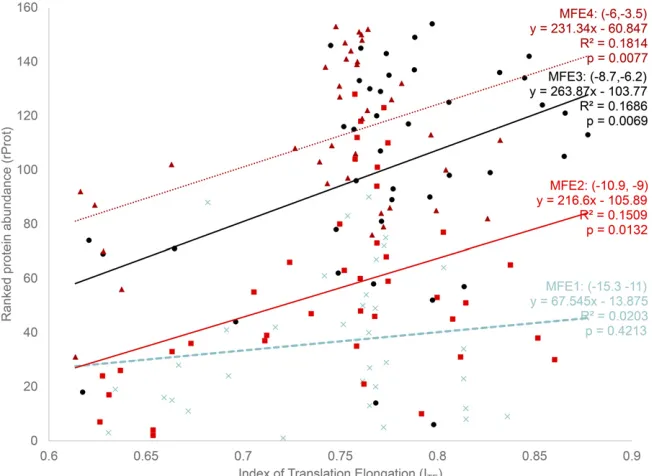
I followed the practice of Tuller et al.(2010) by ranking
Prot(designated asrProtin supporting information,Table S1, which contains all relevant data for the following analysis).
I binned the MFE into four categories, (215.3, 211), (210.9, 29), (28.7, 26.2), and (26,23.5), representing translation initiation from the lowest to the highest and designated as MFE1–MFE4 (Figure 2). The intervals were chosen in such a way that all MFE values fall into four roughly equal-sized groups, with within-group MFE being as small as possible. The benefit of binning is that one can
exclude the MFE variable so that the effect of ITE can be
modeled more explicitly. If MFE is included as an indepen-dent variable, then it becomes difficult to isolate the effect of
ITE because ITE and MFE may interact with each other in
unexpected ways. It is for this same reason that Tuller
et al.(2010) also used binned analysis for this data set. In the MFE1 group, translation initiation is the lowest, and we should expect little increase in protein production with translation elongation efficiency (ITE), that is, a weak
relation-ship betweenITEandrProt. This is consistent with the
empir-ical result (Figure 2), where the relationship betweenITEand
rProt is not statistically significant in the MFE1 group (b = 67.545,P= 0.4213) (Figure 2), withITEaccounting for only
2% of total variation in ranked protein abundance (rProt). In contrast, when translation initiation is more efficient in groups MFE2–MFE4, rProt increases significantly with ITE, with the
simple linear model consistently accounting for about 17% of the total variation in rProt (Figure 2, with b varying from 216.60 to 263.87). Thus, the contribution of translation elon-gation (ITE) to protein production is much greater than
pre-viously documented for this data set, that is, no (Kudla et al.
2009) or less than 3% of the total variation in protein pro-duction (Tulleret al.2010).
Alternatively, one may rank MFE as an index of translation initiation (ITI) so that a more negative MFE (more stable
secondary structure) will have a smaller ITIandfit the data
to the following model:
rProt¼b0þb1ITIþb2ITIITE (5)
The effect ofITEcan be evaluated by testing the hypothesis
that b2 = 0. Because protein abundance is measured by fluorescence levels (Kudla et al. 2009), b0 in Equation 5
represents the backgroundfluorescence. Thefitted model is
Figure 2Ranked protein abundancerProt(protein abundance is measured by GFP normalizedfl uores-cence; data kindly provided by Dr. Plotkin) increases with translation elongation efficiencyITE, except for
rProt¼26:228621:2035ITIþ2:4960ITIITE
¼ 26:2286þ ð2:4960ITE21:2035ÞITI (6)
This model accounts for 56.0% of total variation inrProt. The
P-value associated withb2is 0.00000004. Thefitted model in
Equation 6 suggests that when elongation efficiency is low (e.g.,ITE,0.4822), increasingITIwould either have no effect
or a negative effect on protein production. The negative effect could be generated when ribosomes collide/interfere with each other when initiation is efficient but elongation is not.
Discussion
Many codon optimizing and deoptimizing experiments have used both prokaryotic and eukaryotic translation systems and consistently have suggested an increased translation rate with optimized codon usage and a reduced translation rate with deoptimized codon usage (Haaset al.1996; Ngumbelaet al.
2008; Robinsonet al.1984; Sorensenet al.1989). Kudlaet al.
(2009) are exceptional in claiming that translation efficiency is not limited by elongation rate or codon usage bias. How-ever, as shown in this paper, the claim is false for two reasons. First, the authors ignore the interaction between translation initiation and translation elongation. Second, CAI is an inad-equate proxy for measuring translation elongation.
While theoretical models can fail to capture the essence of reality, experimental models can fail the same way. Tuller
et al.(2010) have pointed out that the average MFE in the sequences of Kudlaet al.(2009) is extraordinarily low. The average MFE is only 28.87, with a range from 215.3 to
23.5. Among the 4320 annotated coding sequences in the
E. coli K12 strain (NC_000913), the MFE for the segment between sites24 and +37 has a mean of25.23, with only 16 sequences with MFE values smaller than215.3 but 1278 sequences with MFE values greater than 23.5. Thus, the MFE1 group in Figure 2 is not representative of the real data and should be excluded in interpreting the effect of elonga-tion on protein producelonga-tion for most genes.
I also wish to point out that the data of Kudla et al.
(2009) also suffer from unrealistically small variation in elon-gation efficiency. The CAIs for the experimental sequences are all smaller than 0.6 according to Figure 2A in Kudla et al.
(2009). More than 1000E. coligenes have CAIs greater than 0.6. This means that the experimental sequences in Kudla
et al. (2009) all have relatively low elongation efficiency, and the data set therefore is inadequate for a fair assessment of the effect of elongation on protein production. The fact that even such a limited variation in translation elongation efficiency can still demonstrate a highly significant effect of elongation rate on protein production represents strong ev-idence that protein production depends heavily on elonga-tion efficiency and codon adaptation.
It is also problematic to attribute the effect of MFE all to translation initiation, as did Kudlaet al.(2009). While a sta-ble secondary structure embedding the initiation codon will surely affect translation initiation, it may well hinder
trans-lation elongation as well. This would suggest that the effect of MFE on protein production could be due to both lation initiation and translation elongation. That is, trans-lation elongation as characterized by ITEmay well account
for more than about the 17% shown in Figure 2.
In summary, the hypothesis that translation efficiency is limited by both translation initiation and translation elon-gation is strongly supported by the empirical evidence, with translation elongation accounting for about 17% of total variation in protein production. The new index of trans-lation elongationITEis far superior to the conventional CAI
or tAI as a proxy for translation elongation efficiency. The original conclusion by Kudla et al. (2009) that translation elongation does not contribute to protein production is based on an inadequate analysis aggravated by as an inad-equate index of codon usage bias.
Acknowledgments
I thank J. Plotkin for sharing the experimental sequence data and Paul Higgs, R. Prabhakaran, S. Chithambaram, M. Gilchrist, and Juan Wang for discussion and comments. This paper was substantially improved by two anonymous reviewers. This study was funded by the Natural Science and Engineering Research Council of Canada.
Literature Cited
Akashi, H., 1994 Synonymous codon usage in Drosophila mela-nogaster: natural selection and translational accuracy. Genetics 136: 927–935.
Andersson, D. I., and C. G. Kurland, 1983 Ram ribosomes are defective proofreaders. Mol. Gen. Genet. 191: 378–381. Bulmer, M., 1990 The effect of context on synonymous codon
usage in genes with low codon usage bias. Nucleic Acids Res. 18: 2869–2873.
Bulmer, M., 1991 The selection-mutation-drift theory of synony-mous codon usage. Genetics 129: 897–907.
Chithambaram, S., R. Prabhakaran, and X. Xia, 2014a Differential codon adaptation between dsDNA and ssDNA phages in Escher-ichia coli. Mol. Biol. Evol. 31: 1606–1617.
Chithambaram, S., R. Prabhakaran, and X. Xia, 2014b The effect of mutation and selection on codon adaptation in Escherichia coli bacteriophage. Genetics 197: 301–315.
Coghlan, A., and K. H. Wolfe, 2000 Relationship of codon bias to mRNA concentration and protein length in Saccharomyces cerevisiae. Yeast 16: 1131–1145.
Comeron, J. M., and M. Aguade, 1998 An evaluation of measures of synonymous codon usage bias. J. Mol. Evol. 47: 268–274. Crick, F. H., 1966 Codon–anticodon pairing: the wobble
hypoth-esis. J. Mol. Biol. 19: 548–555.
dos Reis, M., R. Savva, and L. Wernisch, 2004 Solving the riddle of codon usage preferences: a test for translational selection. Nucleic Acids Res. 32: 5036–5044. Print 2004.
Grosjean, H., V. de Crecy-Lagard, and C. Marck, 2010 Deciphering synonymous codons in the three domains of life: co-evolution with specific tRNA modification enzymes. FEBS Lett. 584: 252– 264.
Grosjean, H., C. Marck, and V. de Crecy-Lagard, 2007 The various strategies of codon decoding in organisms of the three domains of life: evolutionary implications. Nucleic Acids Symp. Ser., No. 51: 15–16.
Grosjean, H., D. Sankoff, W. M. Jou, W. Fiers, and R. J. Cedergren, 1978 Bacteriophage MS2 RNA: a correlation between the sta-bility of the codon:anticodon interaction and the choice of code words. J. Mol. Evol. 12: 113–119.
Haas, J., E.-C. Park, and B. Seed, 1996 Codon usage limitation in the expression of HIV-1 envelope glycoprotein. Curr. Biol. 6: 315–324. Hofacker, I. L., 2003 Vienna RNA secondary structure server.
Nu-cleic Acids Res. 31: 3429–3431.
Ikemura, T., 1981a Correlation between the abundance of Escher-ichia coli transfer RNAs and the occurrence of the respective codons in its protein genes. J. Mol. Biol. 146: 1–21.
Ikemura, T., 1981b Correlation between the abundance of Escher-ichia coli transfer RNAs and the occurrence of the respective codons in its protein genes: a proposal for a synonymous codon choice that is optimal for theE. colitranslational system. J. Mol. Biol. 151: 389–409.
Ikemura, T., 1982 Correlation between the abundance of yeast transfer RNAs and the occurrence of the respective codons in protein genes: differences in synonymous codon choice patterns of yeast andEscherichia coliwith reference to the abundance of isoaccepting transfer RNAs. J. Mol. Biol. 158: 573–597. Ikemura, T., 1992 Correlation between codon usage and tRNA
content in microorganisms, pp. 87–111 inTransfer RNA in pro-tein synthesis, edited by D. L. Hatfield, B. J. Lee, and R. M. Pirtle. CRC Press, Boca Raton, FL.
Jank, P., N. Shindo-Okada, S. Nishimura, and H. J. Gross, 1977 Rabbit liver tRNA1Val. I. Primary structure and unusual codon recognition. Nucleic Acids Res. 4: 1999–2008.
Kudla, G., A. W. Murray, D. Tollervey, and J. B. Plotkin, 2009 Coding-sequence determinants of gene expression in Escherichia coli. Science 324: 255–258.
Liljenstrom, H., and G. von Heijne, 1987 Translation rate modifi -cation by preferential codon usage: intragenic position effects. J. Theor. Biol. 124: 43–55.
Lustig, F., T. Boren, Y. S. Guindy, P. Elias, T. Samuelsson et al., 1989 Codon discrimination and anticodon structural context. Proc. Natl. Acad. Sci. USA 86: 6873–6877.
Marck, C., and H. Grosjean, 2002 tRNomics: analysis of tRNA genes from 50 genomes of Eukarya, Archaea, and Bacteria re-veals anticodon-sparing strategies and domain-specific features. RNA 8: 1189–1232.
Mitra, S. K., F. Lustig, B. Akesson, and U. Lagerkvist, 1977 Codon-acticodon recognition in the valine codon family. J. Biol. Chem. 252: 471–478.
Moriyama, E. N., and J. R. Powell, 1997 Codon usage bias and tRNA abundance in Drosophila. J. Mol. Evol. 45: 514–523. Nakamoto, T., 2006 A unified view of the initiation of protein
synthesis. Biochem. Biophys. Res. Commun. 341: 675–678.
Nasvall, S. J., P. Chen, and G. R. Bjork, 2007 The wobble hypoth-esis revisited: uridine-5-oxyacetic acid is critical for reading of G-ending codons. RNA 13: 2151–2164.
Ngumbela, K. C., K. P. Ryan, R. Sivamurthy, M. A. Brockman, R. T. Gandhi et al., 2008 Quantitative effect of suboptimal codon usage on translational efficiency of mRNA encoding HIV-1gag in intact T cells. PLoS One 3: e2356.
Novembre, J. A., 2002 Accounting for background nucleotide composition when measuring codon usage bias. Mol. Biol. Evol. 19: 1390–1394.
Osterman, I. A., S. A. Evfratov, P. V. Sergiev, and O. A. Dontsova, 2013 Comparison of mRNA features affecting translation ini-tiation and reiniini-tiation. Nucleic Acids Res. 41: 474–486. Palidwor, G. A., T. J. Perkins, and X. Xia, 2010 A general model of
codon bias due to GC mutational bias. PLoS One 5: e13431. Ran, W., and P. G. Higgs, 2012 Contributions of speed and
accu-racy to translational selection in bacteria. PLoS One 7: e51652. Rice, P., I. Longden, and A. Bleasby, 2000 EMBOSS: the European Molecular Biology Open Software Suite. Trends Genet. 16: 276– 277.
Robinson, M., R. Lilley, S. Little, J. S. Emtage, G. Yarrantonet al., 1984 Codon usage can affect efficiency of translation of genes in Escherichia coli. Nucleic Acids Res. 12: 6663–6671. Sharp, P. M., and W. H. Li, 1987 The codon adaptation index—
a measure of directional synonymous codon usage bias, and its potential applications. Nucleic Acids Res. 15: 1281–1295. Sorensen, M. A., C. G. Kurland, and S. Pedersen, 1989 Codon
usage determines translation rate inEscherichia coli. J. Mol. Biol. 207: 365–377.
Sun, X. Y., Q. Yang, and X. Xia, 2013 An improved implementa-tion of effective number of codons (nc). Mol. Biol. Evol. 30: 191–196.
Supek, F., and T. Smuc, 2010 On relevance of codon usage to expression of synthetic and natural genes in Escherichia coli. Genetics 185: 1129–1134.
Tuller, T., Y. Y. Waldman, M. Kupiec, and E. Ruppin, 2010 Translation efficiency is determined by both codon bias and folding energy. Proc. Natl. Acad. Sci. USA 107: 3645–3650. Wright, F., 1990 The“effective number of codons”used in a gene.
Gene 87: 23–29.
Xia, X., 1998 How optimized is the translational machinery in Escherichia coli, Salmonella typhimurium, and Saccharomyces cerevisiae? Genetics 149: 37–44.
Xia, X., 2007 An improved implementation of codon adaptation index. Evol. Bioinform. 3: 53–58.
Xia, X., 2008 The cost of wobble translation in fungal mitochon-drial genomes: integration of two traditional hypotheses. BMC Evol. Biol. 8: 211.
Xia, X., 2013 DAMBE5: A comprehensive software package for data analysis in molecular biology and evolution. Mol. Biol. Evol. 30: 1720–1728.
Zhang, Z., J. Li, P. Cui, F. Ding, A. Liet al., 2012 Codon deviation coefficient: a novel measure for estimating codon usage bias and its statistical significance. BMC Bioinformatics 13: 43.
GENETICS
Supporting Information
http://www.genetics.org/lookup/suppl/doi:10.1534/genetics.114.172106/-/DC1
A Major Controversy in Codon-Anticodon
Adaptation Resolved by a New Codon Usage Index
Xuhua Xia
Table S1 Codon frequencies of E. coli highly expressed genes (HEGs) and non‐HEGs, and other associated statistics for
computing the index of translation elongation (labelled I_TE). Also included are gene expression data provided by Dr. Plotkin for each gene, as well as CAI and I_TE computed for each gene. Data for Figs. 1‐2 are in Sheets "CAI vs I_TE" and
"BinnedAnalysis".