The Spatially Differentiated Trends Between Forest Pest
Control Efficiency and Pest-induced Losses in China
Qi Cai 1, Yushi Cai 2, Yali Wen 1*
1Beijing Forestry University, Beijing 100083, China.
2State Forest Pest Control Administration, Shenyang 110000, China.
* Corresponding author. E-mail: [email protected]
Abstract
China historically exhibits spatial differentiation from population distribution to ecological or economic development, and the forest pest control work is an epitome of this tendency. In recent times, global warming, man-made monoculture tree plantations, increasing human population density and intensified international trade aggravate forest pest outbreaks. Although Chinese government has complied with the internationally recommended practices, few stones remain unturned due to existing differential regional imbalance of forest pest distribution and control abilities. Evidence shows that the high-income provinces in the south have taken advantage of economic and technological superiority, resulting in the adoption of more efficient pest-control measures. To the contrary, in economically underdeveloped provinces of the northwest, a paucity of financial support has led to serious threats of pest damage that almost mirrored the demarcations of the Hu Huanyong Line. In this paper, we propose introducing public-private partnership (PPP) model into forest pest control and combining the national strategies to enact regional prevention measures in order to break the current spatially differentiated trends in China.
Key words: forest pest; control effeciency; pest-induced losses; spatially
differentiated
1.Introduction
Chinese culture originated from traditional Yellow River civilization and enlarged to recent
Yangtze River and the Pearl River deltas as they render rich suitable environment for human to aggregate and develop, generating regional economic imbalances1. In 1935, an accomplished geographer Hu Huanyong discovered the famous Chinese population density distribution line, internationally referred to as the Hu Line. It extends from Heilongjiang in the China’s northeast to Yunnan in the south, dividing the country into southeastern and the northwestern halves. The southeastern half accounts for 36% of the country’s territorial area but 96% of the population, while the northwestern half occupies the remaining 64% land area with only 4% of the country’s populace2. Especially, after the reform and opening-up policy in 1978, the eastern coastal region developed rapidly that deepened the wealth gap, emblematic of the socioeconomic divide of historical China3. It turns out that the Hu Line reveals an important characteristic that is also reflective of the country’s ecological conditions, economic development potentials, and other aspects4. In 2014, Premier Li Keqiang pointed to the Hu Line on the map and stated that China, as the multi-ethnic country with a vast territory, needs to look into methods to break the traditional demographic pattern in order to make people from underprivileged areas such as the central and western regions benefit from modernization5.
To this end, the government put forward several policies such as poverty reduction, ecological construction and other supports to releasing the existing imbalance situation6. Previous analyses have revealed that distribution of forest pest provides a stereoscopic view of these spatial trends. While the outbreak was affected by the ecological characteristic and meteorological conditions, its control measures were mainly influenced by socio-economic factors and management policies7-9. In 2001, China State Council (CSC) approved the Six Key Forestry Programs (SKFPs). Most of the approved programs related to enrichment planting of trees, such as Natural Forest Conservation Program, the Grain for Green Program, and Fast-growing with High-yield Timber Plantation
threatening ecological safety of the entire region14-17. Forest pests are responsible for the destruction
of more than 350 million ha of global forestland annually18, damaging USD 70 billion worth of
global goods and services19. It was estimated that the USA and Brazil alone are expected to lose more than USD 14 billion and USD 17.7 billion annually due to forest pest induced damages20-21. China is projected to face a similarly alarming situation, wherein, it might sustain ecological and economic losses to the tune of USD 16.94 billion that exceeds 10% of the country’s total forestry output anually22. These findings have attracted global attention and called for an adoption of efficient measures for controlling pest outbreaks from destroying forests.
The strategies adopted for forest pest management has progressed through four stages from reliance on natural defense, chemical control, integrated management, to ecological prevention23. The available literature on pest control dating from around the early twentieth century to the 1940s focused on biological measures of pest control combined with advances in agriculture technology
and artificial capture24. Around the 1970s, chemical control measures emerged and exhibited remarkable effectiveness25, however, at the cost of severe environmental degradation26 that urged FAO (1967) to submit its first integrated pest control report in an effort to lessen pesticide pollution and improve pest control measures27. By the mid-1990s, USA first established integrated pest management (IPM) funds for the experts to verify the effectiveness of IPM systems signaling the formal entry into the IPM direction 28. At present, ecological prevention measures such as sustainable pest management, and forest health monitoring which include assessment of the pest-control system dynamics or pest impulse responses, have been introduced into IPM to boost the effectiveness in regulating pest population density during outbreaks29-32. This strategy also encourage farmers’ cooperation and predictions from software-based models to implement effective
forest pest management33-35.
System) technology to complete automatic diagnostic monitoring systems, meanwhile using an economic approach to calculate the losses incurred from pest damage on a five-year cycle for monitoring the effectiveness of forest pest control22,38-41. All of these measures demanded an investment in the excess of USD 561.2 million annually and steadily increasing17. Based on these, the SFPCA has approved a proposal aimed at improving pest-damage prediction accuracy by 90%, the rate of quarantining the quality of seeds in place of origin by 100%, and reducing the forest pest damage rate below 4 per thousand by 202042. The administration is now under pressure to meet these targets, as regional economic-ecological imbalances affect forest pest distribution and control abilities.
There are more than 8,000 forest pest species, including 5,020 species of forest insects, 2,918 species of microbial pathogens, 160 species of rodents and lagomorphs, 145 hazardous plant species. and 300 species are considered the most serious threat to the Chinese forests19, 43.Varied climatic and spatial conditions with characteristic vegetation types in different regions of China lead to variations in the resident pest species among different provinces. Specifically, Hyphantria cunea,
Apriona cinerea, and leafinsectsdestroy temperate broadleaf forests; Bursaphelenchus xylophilus
(Scolytidae), capricorn beetles, and weevil pests are hazardous for the coniferous forests;
Holcocerus hippophaecolus and Orgyia ericae Germar infest the extremely vulnerable western desert vegetation; and plateau pikas cause extensive damage to regenerated or young stands44,45, resulting in each province facing different degrees of pest-induced forest loss and drawing our attention to study the pest outbreak situation, the resultant losses, and their control efficiency. A study as such could form a basis to understanding the current forest pest management situation in China.
pressure seems more optimistic in the northwest than the southeast, however, greater attention needs to be paid during management and investment planning and decision making since forest pest control average efficiency in the northwest is almost 10% lower than in southeast. This, combining with ecological and economic construction, would help break the existing spatial differential trends in forest pest control.
2.Materials and Methods
2.1.Literature Review.
We performed literature review on the economic aspects associated with pest management, starting from an international perspective, leading to China, using the Web of ScienceTM database and a special string of keywords about pest control efficiency to identify the relevant papers. Next, we used the Web of Science’s ‘refine’ function to restrict the search results to the relevant field, and it yielded 1,630 sources from 1997 to 2017. We analyzed each source manually to reject the irrelevant papers, and retained only those containing information regarding pest control. Finally, a total of 136 papers were selected. Then, we used the same method to identify literature from the Chinese National Knowledge Infrastructure (CNKI) for determining the pest control situation in China and obtained 163 papers. Furthermore, we explored reports, chapters, and related books that provided the initial estimates of forest pest control situation in China and elsewhere, and visited the website of SFPCA or consulted with the staff for detailed knowledge on pest control. We extended our quest beyond forest pests to include instances of “natural disasters,” “Hu Line,” and “pest outbreak affecting factors” to ensure a more thorough analysis.
2.2.Losses Incurred from Forest Damage by Pests.
These losses consist of economic loss (EL) and ecological service loss (ESL). EL was calculated as: EL =Ld+La+Lq+Lo +Lp, where, Ld represents loss from stumpage death, La represents stumpage volume growth losses, Lq represents loss from stumpage quality reduction, Lo represents non-timber forest product losses, and Lp represents the costs incurred from prevention of pest-induced disasters. Details of the different components of the equation are provided below:
price.
The stumpage volume growth loss (La) was calculated as La = S × Ad × Ta, , where S is pest damaged forest area (ha), , Ad is the reduction in timber increment per ha and year, and Tais the stumpage price.
The loss from stumpage quality reduction(Lq) was calculated as Lq = S × Rq × Tv, where S is the pest affected area (ha), Rq is the reduction in stumpage price due to pest damage, and Tv is the stumpage volume in the damaged forest.]
Non-timber forest product losses (Lo) were calculated as Lo = (P0Y0− P1Y1) × S, where Y0 is the normal annual yield (kg/ha), Y1is the average yield (kg/ha) in damaged forests,Sis the pest affected area (ha), and P0 and P1are the price of non-timber products (per kg) produced in undamaged and damaged forests, respectively.
Ecological service loss (ESL) was derived by means of the biomass estimation method to evaluate the reductions in ecological services, and was calculated following the formula Lu = kv × V1, where Lu is the forest ecological service loss value, kv is the estimatedecological service value of per unite(per m-3), and V1 is the volume loss (m3). Based on these formulae, the SFCA have estimated the forest pest losses from 2006 to 2010 of each provinces, and then we showed the final result in figures 3-5 for further comparing, and the total loss is the sum of economic losses and the ecological losses22,56.
2.3.Forest Pest Control Efficiency
The Least Square Dummy Variable (LSDV) and Entropy Weight Method (EWM) were used with the feasible factors Pest Area (PA), Control Area (CA), and Investment Funds (IF) extracted from the Forestry Statistical Yearbook for the period 2003-2016 of 31 provinces; the details of the factors are explained in Table 2 and we hypothesis the efficiency is the higher the better.
lnCA𝑗= Y4jlnIF𝑗+ 𝜇4 , L. lnPA𝑗= Y5jlnIF𝑗+ 𝜇5 , and L. lnPA𝑗 = Y6jlnCA𝑗+ 𝜇6 . We utilized the software of Stata13.0 to obtain the Yij, where i refers to the six new indicators and j represents the 31 provinces of China. They were interpreted as when forest pest outbreak or control measures increased 1%, the corresponding changes of investment funds to analysis whether its timeliness and effective, and then, when pest outbreak and funds increased 1%, the control measures following floating degree, specifically, the control measure or financial payment might not easy make work immediately that we added the lag period factor expressed as L. lnPA𝑗 to examine whether the control strategies could make the pest outbreak situation trend to decrease.
The EWMwas used to evaluate the weight of Yij 67,68. For the first four indicators (Y1j to Y4j), we hypothesized positive to pest control efficiency that the value would be the larger the better and
standard expression is 𝑌𝑖𝑗′ = 𝑌𝑖𝑗−min(𝑌𝑖𝑗)
max(𝑌𝑖𝑗)−min(𝑌𝑖𝑗)+ 1 , whereas for Y5j , Y6j are negative with the smaller the better value expressed as 𝑌𝑖𝑗′ =
max(𝑌𝑖𝑗)−𝑌𝑖𝑗
max(𝑌𝑖𝑗)−min(𝑌𝑖𝑗)+ 1.
After we got the standardized 𝑌𝑖𝑗′
to the calculate the weight as 𝑝𝑖𝑗 = 𝑌𝑖𝑗′
∑31𝑌𝑖𝑗′ 1
and entropy as 𝑒𝑖= − 1
ln31× ∑ 𝑝𝑖𝑗 31
1 . 𝑙𝑛𝑝𝑖𝑗 , then, we obtained the entropy weight as 𝑊𝑖 =
1−𝑒𝑖 ∑ (1−𝑒311 𝑖)
; finally the weight figures are 𝑊𝑖=
{0.16911,0.16948,0.166922,0.165147,0.164668,0.164669 ,, and the forest pest control efficiency expressed as Y = 0.169114𝑌1𝑗∗+ 0.16948𝑌2𝑗∗+ 0.166922𝑌3𝑗∗+ 0.165147𝑌4𝑗∗− 0.164668𝑌5𝑗∗− 0.164669𝑌6𝑗∗, we displayed the final efficiency of each province in figure 6.
2.4.Efficiency Affecting Factors.
We selected one cross-section data in 2016 of each province as an example to verify the significant effects of the affecting factors and calculated by the Simultaneous Equation Model, which is one three-stage least squares (3sls) combined two-stage least square method with the seemingly unrelated regression68. Detailed explanations of the formula and determinants are displayed as follows, all the data were also logarithmic for each province.
{
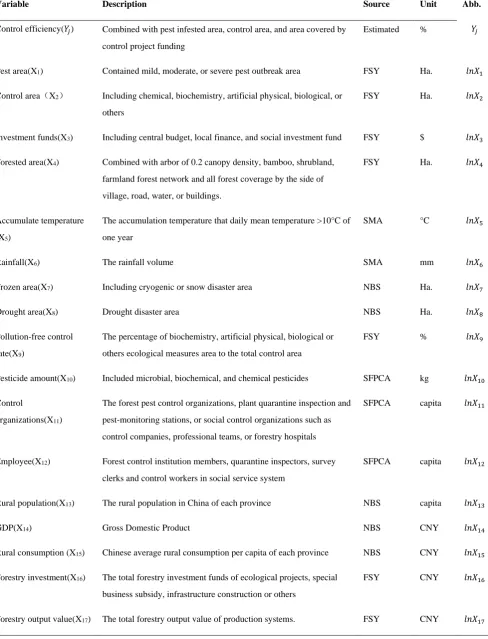
Table 1. The affecting factors of forest pest control efficiency and its explanation
Variable Description Source Unit Abb.
Control efficiency(𝑌𝑗) Combined with pest infested area, control area, and area covered by
control project funding
Estimated % 𝑌𝑗
Pest area(X1) Contained mild, moderate, or severe pest outbreak area FSY Ha. 𝑙𝑛𝑋1
Control area(X2) Including chemical, biochemistry, artificial physical, biological, or
others
FSY Ha. 𝑙𝑛𝑋2
Investment funds(X3) Including central budget, local finance, and social investment fund FSY $ 𝑙𝑛𝑋3
Forested area(X4) Combined with arbor of 0.2 canopy density, bamboo, shrubland,
farmland forest network and all forest coverage by the side of
village, road, water, or buildings.
FSY Ha. 𝑙𝑛𝑋4
Accumulate temperature
(X5)
The accumulation temperature that daily mean temperature >10°C of
one year
SMA °C 𝑙𝑛𝑋5
Rainfall(X6) The rainfall volume SMA mm 𝑙𝑛𝑋6
Frozen area(X7) Including cryogenic or snow disaster area NBS Ha. 𝑙𝑛𝑋7
Drought area(X8) Drought disaster area NBS Ha. 𝑙𝑛𝑋8
Pollution-free control
rate(X9)
The percentage of biochemistry, artificial physical, biological or
others ecological measures area to the total control area
FSY % 𝑙𝑛𝑋9
Pesticide amount(X10) Included microbial, biochemical, and chemical pesticides SFPCA kg 𝑙𝑛𝑋10
Control
organizations(X11)
The forest pest control organizations, plant quarantine inspection and
pest-monitoring stations, or social control organizations such as
control companies, professional teams, or forestry hospitals
SFPCA capita 𝑙𝑛𝑋11
Employee(X12) Forest control institution members, quarantine inspectors, survey
clerks and control workers in social service system
SFPCA capita 𝑙𝑛𝑋12
Rural population(X13) The rural population in China of each province NBS capita 𝑙𝑛𝑋13
GDP(X14) Gross Domestic Product NBS CNY 𝑙𝑛𝑋14
Rural consumption (X15) Chinese average rural consumption per capita of each province NBS CNY 𝑙𝑛𝑋15
Forestry investment(X16) The total forestry investment funds of ecological projects, special
business subsidy, infrastructure construction or others
FSY CNY 𝑙𝑛𝑋16
All the data were logged to represent elastic shown in the formulas and among the abbreviation (Abb.), FSY is Forestry Statistical
Yearbook; SMA is State Meteorological Administration; NBS is National Bureau of Statistics.
All data were log transformed to represent elasticity and the CNY was converted to US $ using the exchange rate of 6.5 (1 US$ = 6.5 CNY).
3.Results and Discusiions
3.1.Forest pest damage and management situation between southwest and northeast.
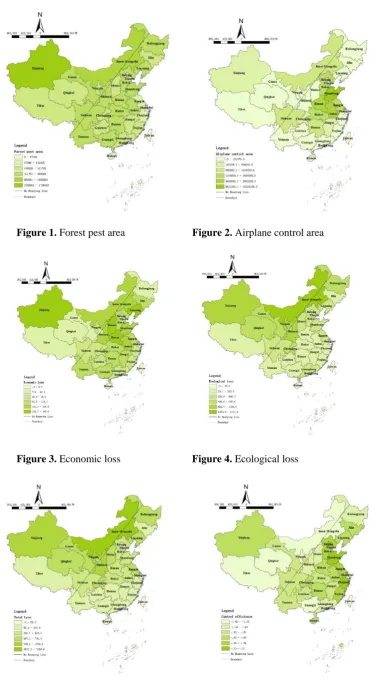
Figure 1. Forest pest area Figure 2. Airplane control area
Figure 3. Economic loss Figure 4. Ecological loss
The shades in the map from dark to light, represent the degrees from severe to gentle, the line in each map is our
mentioned Hu Huanyong line. The northwestern part contains Xinjiang, Gansu, Tibet, Qinghai, Ningxia, Inner
Mongolia and half of Sichuan, 10% of Yunnan provinces. And the southeastern part contains of Heilongjiang, Jilin,
Liaoning, Hebei, Beijing, Tianjin, Shanxi, Shaanxi, Shandong, Henan, Hunan, Hubei, Chongqing, Jiangsu, Shanghai,
Anhui, Zhejiang, Jiangxi, Guizhou , Guangdong, Fijian, Guangxi, Hainan, half of Sichuan and 90% of Yunnan
provinces. The map in these figures were generated by GIS. Among of them, the unit of figure 1-2 is hectare, figure
3-5 is USA million dollar and the figure 6 is from -1.42% to 0.21% calculated by LDSV model, means when the
control measures increase 1%, generating the following effect, as we could observed that the forest pest control
efficiency was not really high of the whole country.
3.2.Factors affecting forest pest control efficiency.
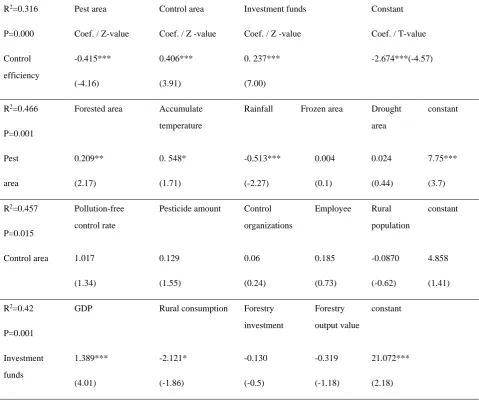
We utilized the Simultaneous Equation Model (SEM) to analyze the affecting factors andtheir significant effects. The endogenous variables were Pest Area (PA) representing the natural characteristics of forest pests, Control Area (CA) representing the forest pest prevention and treatment effectsand Investment Funds (IF) representing the forest control management processes, all of which were affected by exogenous variables such as forest characteristics, meteorological conditions, or socioeconomic well-being46-50. To be more precise, PA is impacted by forested area, accumulated temperatures, rainfall, frozen area, and drought area. For example, global warming is believed to reduce the frequency of cold spells and increase drought condition, both of which would trigger a forest pest outbreak51. We selected pollution-free control rate, the percentage of bio-control area to the total control area, pesticide amount, forest pest control organizations, relative employees, and rural population amount to evaluate the CA. Meanwhile, considering that the unbalanced labor force or financial conditions might influence the forest pest control efficiency via management decisions52, we chose GDP, rural consumption, forest investment, and forestry output values to estimate IF. Finally, we regarded the impacted factors PA, CA, and IF as explanatory variables to regress the explained variable, forest pest control efficiency that we have calculated employing LSDV model shown in the Figure 6, details of which are explained in the methods section. Table 1 displays the regression results of forest pest control efficiency affecting factors.
decreases the efficiency by 0.415%. As for the exogenous variables, first with respect to PA, forested area, temperature, and rainfall all passed the significance test. Table 1 reveals that an increase of 1% in each of forest area and temperature would increase PA outbreak by 0.209% and 0.558%, respectively, whereas, 1% increase in rainfall would help reduce it by 0.513%. As for the CA factor, although none of the variables passed the significance test, the pollution-free control measures could play an important role under this condition, while the rural population is a negative variable that potentially burden the current protection strategies. Finally, in the IF regression results, the factors of GDP and rural consumption passed the significance test, and when they increased by 1%, IF increased by 1.389% and decreased by 2.121%, respectively.
Table 2. Factors affecting forest pest control efficiency
R2=0.316
P=0.000
Pest area
Coef. / Z-value
Control area
Coef. / Z -value
Investment funds
Coef. / Z -value
Constant
Coef. / T-value
Control efficiency -0.415*** (-4.16) 0.406*** (3.91) 0. 237*** (7.00) -2.674***(-4.57)
R2=0.466
P=0.001
Forested area Accumulate
temperature
Rainfall Frozen area Drought
area constant Pest area 0.209** (2.17) 0. 548* (1.71) -0.513*** (-2.27) 0.004 (0.1) 0.024 (0.44) 7.75*** (3.7)
R2=0.457
P=0.015
Pollution-free
control rate
Pesticide amount Control
organizations
Employee Rural
population
constant
Control area 1.017
(1.34) 0.129 (1.55) 0.06 (0.24) 0.185 (0.73) -0.0870 (-0.62) 4.858 (1.41)
R2=0.42
P=0.001
GDP Rural consumption Forestry
*All the values of the variables were logged except control efficiency to represent elastic, and the results were
expressed as percentage. *, ** and *** are Significant at 10%,5% and 1% level, respectively.
3.3.Realistic significance of the affecting factors to forest pest outbreak.
We highlighted the typical pest Bursaphelenchus xylophilus as an example to verify the pest
location regulation under the affecting factors. B. xylophilus is an invasive insect carried by
Monochamus alternatus Hope (MAH) that has been highlighted as one of the most dangerous species by SFPCA and even a menaced to the world53. When MAH wounds the tree for nutrition, B.
xylophilus drills into the resin and destroys the xylem54. Available literature suggest that it destroys over 0.33 million ha of pinewood causing economic losses in excess of USD 276.92 million annually55. As shown in Figure 7, the first appearance of B. xylophilus in the city of Nanjing overlaps with its intensification of international trade in 1982, and then rapidly expanded to the Yangtze River delta which supports a flourishing economy in China56. The rapid spread was aided by global warming and developing transportation that supplied a spawning environment for B. xylophilus,
causing damage to spread consistently along the Hu Line expanding from the southeast to northwest between 1998 and 201557. Although SFPCA has taken several measures to reduce the damage by constantly improving technology, there are historical spatial differences in natural and social-economic aspects leading to an expansion of original forest pest damage area elsewhere owing to the invasion by other more serious species that intensify the control difficulty. This remind us a need for further discussing the divisional strategies to improve the control efficiency, especially in determinants aspect.
Endogenous variables: Pest area, Control area, Investment funds
Exogenous variables: Forestland area, Accumulate temperature, Rainfall, Frozen area, Drought area, Pollution-free control rate,
Pesticide amount, Control institutions, Employee, Rural population
Figure 7. Bursaphelenchus xylophilus expansion tendency from 1998 to 2015 (Unit: county). This source has already
been published in the website by SFA http://www.forestry.gov.cn/main/3600/content-941990.html and SFPCA
http://www.forestpest.org/index.html.
4.Conclusions
Based on our findings, we concluded that the forests pests incurred great losses and their control efficiency appeared to differ geographically, showing distinct patterns in the northwest and southeast that almost resembles the demarcation of the Hu Line with higher losses in northwest with a corresponding lower control efficiency. The forest pest spread area, as a significant factor, restricted the control efficiency in the northwest as more SKFPs led to an increase of the forest coverage for ecological services and limited rainfall that enlarged the pest damage degree especially in forest pest ecological loss. However, as current control measures fall short of satisfying the province-specific protection demands with deficient economic development ability to acquire enough funding support, actual investment in the control measures is needed for the northwest. Furthermore, the forest pest control measures as the public goods executed by the government, the actions of rural population are generally counterproductive both to preventive measures and fund simulation which remind us a need for introducing Public-Private-Partnership (PPP) model into the control work by encouraging the community co-management integrated with market mechanism and specialized regional management strategies58.
SKFPs would help achieve the ecological construction with more mixed plantation, and eliminate absolute poverty and lower the wealth gap by 202059. In northwestern part, following the Great Western Development Project and the Belt and Road Initiative development process to improve the economic development60,61 while improving the new collective forestry property tenure reforms and the Tripartite Rural Land Entitlement System as separating rural land ownership rights , contract rights and management rights to enhance the farmers’ willingness to participate in the forest management by planting diverse and economically significant tree species should be a top priority in order to improve the livelihoods of people in the region, which could be further extended throughout the country62,63. Therefore, SFPCA exerted the synthetic adjustment responsibility to consider the spatial differential control degree, that could also match the ongoing poverty alleviation initiatives to encourage farmers participate in forest pest control activities by supplying the forest ranger posts, or purchasing forest insurance through eco-compensation64,65. Meanwhile, mobilizing the social forces in technology and investment funds can be a possible way to guide the forest pest control companies to becoming more professional by hiring competent pest control team, and through diversified investment channels to impel existing forest insurance schemes get more complete with both the risk aversion and financial profit increment functions. This would not not only lessen the burden upon SFPCA and improve its control efficiency, but also, to an extent, break the spatial differential trends of forest pest control innovation reform progress.
Data availability. The authors declare that all data supporting the analyses and findings of this study are available within the article and its Supplementary Information files.
Acknowledgements:We thank Sen Wang for providing comments and suggestions for
improvement, and Chunping Mei, Pradeep Baral for checking the paper. We also discussed with Hongjun Su about the forest pest losses. This work was supported in part by the Chinese Forest Pest Cost Responsibility Investigation System (2017-R04).
Cai Y. S. provided the data and modified the paper.
References and Notes
1.Yajuan L I, Chen T, Wang J, et al. Temporal-spatial distribution and formation of historic and cultural villages in
China. Geogr. Res.32, 1477-1485 (In Chinese, 2013).
2. Hu, H. Y. The distribution of population in China, with statistics and maps. Acta. Geogr. Sin2, 33–74 (In Chinese,
1935).
3. Gao Y, Zheng J, Bu M. Rural-urban income gap and agricultural growth in China. China: Agric. Econ. Rev., 6,
92-107 (2014 ).
4. Hu, Z., Wang, Y., Liu Y., Long, H., & Peng J. Spatio-temporal patterns of urban-rural development and
transformation in East of the “Hu Huanyong Line,” China. ISPRS Int J Geoinf.5, 24 (2016).
5. Chen, M. X., Gong, Y. H., Li Y., et al. Population distribution and urbanization on both sides of the Hu Huanyong
Line: Answering the Premier's question. J. Geogr. Sci.26, 1593-1610 (2016).
6. Hansen J, Hellin J, Rosenstock T, et al. Climate risk management and rural poverty reduction. Agric. Syst.1, 1-19
(2018).
7. Arvind, K. & Akhilesh, K. Effect of abiotic and biotic factors on incidence of pests and predator in cowpea.
Legume Res. 38, 121–125 (2015).
8. Ge, X., Chao J., Chen L., et al. Predicting the potential distribution in China of Euwallacea fornicates (Eichhoff)
under current and future climate conditions. Sci. Rep.7, (2017).
9. Blake, G., Sandler, H. A., & Coli, W. An assessment of grower perceptions and factors influencing adoption of
IPM in commercial cranberry production. Renewable Agric Food Syst. 22, 134–144 (2007).
10. Liu J, Li S, Ouyang Z, et al. Ecological and socioeconomic effects of China's policies for ecosystem services.
Proc. Natl. Acad. Sci. U. S. A.105, 9477 (2008).
11. Delang C O. China's key forestry programs: economic, social and ecological rationales. Int. J. Global Environ.
Issues, 15, 81-299 (2016).
12. Ji L, Zhen W, Wang X, et al. Forest Insect Pest Management and Forest Management in China: An Overview.
Environ. Manage. 48, 1107-1121 ( 2011).
13. Häggman H, Raybould A, Borem A, et al. Genetically engineered trees for plantation forests: key considerations
for environmental risk assessment. Plant Biotechnol. J.11, 785 (2013).
Nat.519, 407-409 (2015).
15. Zidon, R. Tsueda, H., Morin, E., & Morin, S. Projecting pest population dynamics under global warming: the
combined effect of inter‐and intra‐annual variations. Ecol Appl26, 1198-1210 (2016).
16. Dainese, M. Schneider, G., Krauss, J., & Steffan-Dewenter, I.. Complementarity among natural enemies
enhances pest suppression. Sci Rep. 7, 8172 (2017).
17. SFA. Forestry statistics yearbook. China Forestry Publishing House. (In Chinese,2016).
18. FAO, Global Forest Resources Assessment 2010―Main report. (Available in Arabic Chinese English French
Russian Spanish) (2010)
19. Bradshaw, C. J. et al. Massive yet grossly underestimated global costs of invasive insects. Nat Commun.7, 12986
(2016).
20. Dainese, M. Schneider, G., Krauss, J., & Steffan-Dewenter, I.. Complementarity among natural enemies
enhances pest suppression. Sci Rep. 7, 8172 (2017).
21. Oliveira, C. M., Auad, A. M., & Mendes, S. M. Crop losses and the economic impact of insect pests on
Brazilian agriculture. Crop Prot56, 50–54 (2014).
22. Song, Y. S., Su, H. J., & Yu, H. Y. The loss assessment of Chinese forest pest disasters. China Forest Pests6, 1–
4 (In Chinese, 2011).
23. Stallman, H. R. & James, H. S. Jr. Determinants affecting farmers' willingness to cooperate to control pests. Ecol
Econom117, 182-192 (2015).
24. Forbes S A. The ecological foundation of applied entomology. Ann Entomol Soc Am 8, 1-19 (1915).
25. Hoskins, W. M., Borden, A. D. & Michelbacher, A. E. Recommendations for a more discriminating use of
insecticides. Proceedings of the 6th Pacific Science Congress. 119-123 (1939).
26. Ullyett, E. C. Insects, man and the environment. J Econ Entomol.44,459-64 (1951).
27. FAO. Report of the First Session of the FAO Panel of Experts on Integrated Pest Control, Rome. 9, 18-22
(1967).
10, 25-29 (1977).
29. Bulmer M S, Bachelet I, Raman R, et al. Targeting an antimicrobial effector function in insect immunity as a
pest control strategy. Proc. Natl. Acad. Sci. U. S. A.106, 12652-7 (2009).
30. Potter K, Conkling B. Forest Health Monitoring: National Status, Trends and Analysis, 2015. U. S. Department
of Agric. 198, 1-213 (2017).
31. Tang, S., Xiao, Y., Chen, L., & Cheke, R. A. Integrated pest management models and their dynamical behavior.
Bull Math Biol67, 115-135 (2005).
32. Ordano, M., Gullen, L., Rull, J., Lasa, R., & Aluja, M. Temporal dynamics of diversity in a tropical fruit fly
ensemble and their implications on pest management and biodiversity conservation. Biodiversity Conserv.22,
1557-1575 (2013).
33. Puente, M., Darnall, N. & Forkner, R. E. Assessing integrated pest management adoption: measurement
problems and policy implications. Environ. Manage. 48, 1013-1023 (2011).
34. Wyckhuys, K. A. G. & O’Neil, R. J. Local agro-ecological knowledge and its relationship to farmers’ pest
management decision making in rural Honduras. Agric Human Values24, 307-321 (2007).
35. Damos, P. Modular structure of web-based decision support systems for integrated pest management: a review.
Agron Sustain Dev35, 1347-1372 (2015).
36. State council of the people's republic of china. Forestry Pest Control
Regulations.http://www.forestry.gov.cn/main/3950/content-459886.html/ (In Chinese, 1989).
37. State Forestry Administration(SFA). Major Exotic Forestry Pest Emergency Measures
http://www.forestry.gov.cn/portal/main/s/150/content-204816.html/ (in Chinese, 2005).
38. Dong, Z. H., Xu Y., Cui D. Y. et. al. Development and application of forecast function in the information
management system of forest. China Forest Pests36, 9–12 (In Chinese,2017).
39. Qin J, Yang X, Yang Z, et al. New Technology of Using Meteorological Information in Forest Insect Pest
Forecast and Warning Systems[J]. Pest Manage. Sci.73, 2509-2518 (2017).
40. Liu P., Liang Q. L., Chen M., et, al.Construction on Index System of Forest pest Disaster Loss Assessment.
41. Cai Q., Zhang D. H., Li Y., et. al. Empirical study of forest pest control efficiency in China. Forest Pest & Disease
3,34-37 (In Chinese, 2016).
42. SFPCA, The notice of the forest pest control “Forth Rate” target during the 13th five years by SFA.
http://www.forestpest.org/statutefile/lawunion.html (In Chinese, 2016).
43. Ji, L., Wang, Z., Wang, X., & An, L. Forest insect pest management and forest management in China: An
overview. Environ Manage. 48, 1107–1121 (In Chinese, 2011).
44. Liu, D. Shen, W. S., Zhu, S. X., et, al.Spatial patterns of agricultural and forest pests in China and the impact
factors. Chinese J. Ecol. 33, 3322-3331 (In Chinese, 2014).
45. Zhao, Y. X., Wu, J., Luo Y. Q.Tao, J. Forest invasion insect identification and control measures of China. Plant
Quarantine, 29, 42-47 (In Chinese, 2015).
46. Seidl, R., et al. Forest disturbances under climate change. Nat. Clim. Change7, 395 (2017).
47. Crowder D W, Northfield T D, Strand M R, et al. Organic agriculture promotes evenness and natural pest control.
Nat, 466,109-112 (2010).
48. Arvind, K. & Akhilesh, K. Effect of abiotic and biotic factors on incidence of pests and predator in cowpea.
Legume Res. 38, 121–125 (2015).
49. Ge, X., et al. Predicting the potential distribution in China of Euwallacea fornicates (Eichhoff) under current and
future climate conditions. Sci Rep7, 1-13 (2017).
50. Blake, G., Sandler, H. A., & Coli, W. An assessment of grower perceptions and factors influencing adoption of
IPM in commercial cranberry production. Renewable Agric Food Syst 22, 134–144 (2007).
51. Savary, S., Castilla, N.P., & Elazegui, F.A. Multiple effects of two drivers of agricultural chancre: labor shortage
and water scarcity, on rice pest profiles in tropical Asia. Field Crops Res. 91, 263–271 (2005).
52. Early R, Bradley B A, Dukes J S, et al. Global threats from invasive alien species in the twenty-first century
and national response capacities. Nat Commun7, 12485 (2016).
53. Buckley, S., et al. Review of research on the control of pine wood nematode (Bursaphelenchus xylophilus) using
54.Mamiya, Y. Pathology of the Pine Wilt Disease Caused by Bursaphelenchusxylophilus. Annu. Rev. Phytopathol
21, 201-220 (1983).
55. SFPCA. The calendar of forest pest control. China Forestry Publishing House: Beijing. (2010).
56. Yan, J. The economic analysis and measures study of Chinese forestry pest disaster management. Beijing
Forestry University. 264 (In Chinese, 2008).
57. Han, Y., Wang, Y., Xiang, Y., Jianren, Y.E.. Prediction of potential distribution of Bursaphelenchus xylophilus
in China based on Maxent ecological niche model. J.Nanjing Forestry University. 39, 6-10 (In Chinese, 2015).
58.Jindal R M, Patel T G, Waller S G. Public-Private Partnership Model to Provide Humanitarian Services in
Developing Countries. J. Am. College of Surgeons, 224, 988-993 (2017).
59. Zhang K, Dearing J A, Dawson T P, et al. Poverty alleviation strategies in eastern China lead to critical ecological
dynamics. Sci. Total Environ.506-507, 164-181 (2015).
60. Li W, Liu Y J, Yang Z. Preliminary Strategic Environmental Assessment of the Great Western Development
Strategy: Safeguarding Ecological Security for a New Western China. Environ. Manage. 49, 483-501 (2012).
61. Seele P,Helbing, D . Boost sustainability through social justice in China's Belt and Road Initiative. Nat.555,
311 (2018).
62. Liu C, Liu H, Wang S. Has China’s new round of collective forest reforms caused an increase in the use of
productive forest inputs? Land Use Policy.64:492-510 (2017).
63. TAO Zhong T. L., Yang H. Discussion on the Essence of Tripartite Rural Land Entitlement System of Farmland
Property Rights:Seeking the Appropriate Expression of Policy on Law, China Land Sci. 31, 64-72 (In Chinese, 2017).
64. Qin T, Gu X, Tian Z, et al. An empirical analysis of the factors influencing farmer demand for forest insurance:
Based on surveys from Lin’an County in Zhejiang Province of China. J. Forest Econo.24, 37-51(2016).
65. Shang W, Gong Y, Wang Z, et al. Eco-compensation in China: Theory, practices and suggestions for the future.
J. Environ. Manage.210, 162-170 (2018).
66. Saputra, Darman. Analysis of Factors Affecting Economic Growth in Bangka Belitung Province, Indonesia
With LSDV and FGLS Methods. Mpra Paper. 84676, 24-31 (2018).
67. Liu Y, Wang J, Liu G Z, et al. The Generalized Product Quality's Comprehensive Evaluation Method Based on
Entropy Weight Method. Adv. Mater. Res. 569, 662-665 (2012).