Mammogram Segmentation Using Neuro-fuzzy for Breast
Cancer Auto-detection
Z.Azimi
Technical And Vocational University
Abstract
A CAD system for the purpose of detecting and identifying cancerous tumors in mammograms is
introduced in this study. Using this modern computer system segmentation is set to work based
upon the combination of two issues_ fuzzy logic and neuro fuzzy to detect cancerous tumors. To
train this segmenter, 70 mammograms containing tumors have been utilized. To, further,
evaluate the efficiency of the system 30 more mammograms, not used in the training period,
were added later. By applying this method the specificity index is raised to %95 and the
sensitivity index to %98. Considering these measures the true algorithm capability is ensured.
Keywords: mammography, neural networks, fuzzy-logic, neuro fuzzy systems, breast cancer,
segmentation.
1.
Introduction
Of the most common cancers breast cancer is %32 among females and results in %18 of
the deaths caused by cancers (1). To reduce this, one of the most efficient ways is
diagnose it within its embryonic stages. Mammography is one of the most reliable
methods of diagnosis because statistically it is capable of decreasing death due to cancer
from %20 to %35 (1). However, it certainly has some drawbacks like being dependable
on the environment and the radiologist’s experience, and also it is difficult to interpret
(2). Luckily, CAD systems can aid radiologist‘s performance here in (3). Although
scientists have introduced different algorithms in segmentation, extraction, and
classification of tumors for pathologic purposes in mammographies, more research is
needed in this regard. This study, then, is aimed at introducing a new method to detect
tumors in mammograms with the focus on segmentation. In so doing, fuzzy neural
network is applied.
2.
Earlier works
Using multi-scaling wavelet and curvelet transform, Mohamed & et. al. (2012) turned
mammograms into a quotients line. Then, quotients matrix of the images were formed
representing its row as the image number and its column as the relevant quotients.
Afterwards, using t-test the columns were statistically analyzed and to do so they were
sorted out based on their capability in classifying. Finally, using support vector machine
they classified or distinguished benign tissues from metastatic ones. The proposed
algorithm by Dheeba & et. al. (2010) detected cancerous area in two phases from the
mammograms. In phase one, using pre-processing method, the desired area and the
Gabor filters to distinguish non-cancerous tissues from cancerous ones were extracted
from the images. Further in phase two, neural networks and feature extraction methods
were applied for tissues classification.
3.
Database
This study has used 100 mammograms from MIAS Database. These 1024×1024 images
were taken from 161 patients from both left and right breasts. The total 322 images were
classified into Normal, Benign, and Metastatic, which, in turn, we had 208 Normal, 63
Benign and 51 Metastatic cases. In this database any diagnosis is made by medical
doctors through Gold Standard.
4.
Proposed method
The main target of this study is to extract critical tumor areas. In so doing, an algorithm is
suggested based on which input data will be gained in preprocessing image stage through
morphology operator which itself can improve image quality. Then, by using neuro-fuzzy
this data is examined. Attempts have been made to display tumor (if it exists) using active
contour operator.
4.1.
Preprocessing
Since some patterns are not easily detectable on mammograms with naked eyes, some
changes need to be made regarding better resolution and image quality for
highlighting targeted patterns and better extraction at segmentation stage. To do so,
top-hat morphology operator is used on gray scale.
In image processing, top-hat is an operator which extracts details of gray scale once
implemented. There are black and white types of this top-hat operator in which white
type is defined as the difference between input and opened image.
(1)
T,(f)=f-f"b
The output of this image change includes details of the output such as:
1. It is smaller than the structural element.
2. It is brighter than its ambience.
Black type top-hat is defined as the difference between input and closed image.
(2)
T,("f)= f ,b- f
The output of this image change includes details of the output such as:
1. It is smaller than the structural element.
2. It is darker than its ambience.
In this method first white and then black top-hat operators are applied to the original
image. Now we subtract all pixels with white hat operator from those with black
top-hat operator so ttop-hat the final image has less noise and thicker edge for processing. Figure
(1) shows the result of these operations on the mammograms.
Figure (1) top-hat to image operations_ left: original image and right: improved image
Next, to remove calcium particles (benign areas) image masking is used within two-pixel
radius as shown in figure (2).
Figure (2) applying masking to the the image. Left: improved image and right: masked image
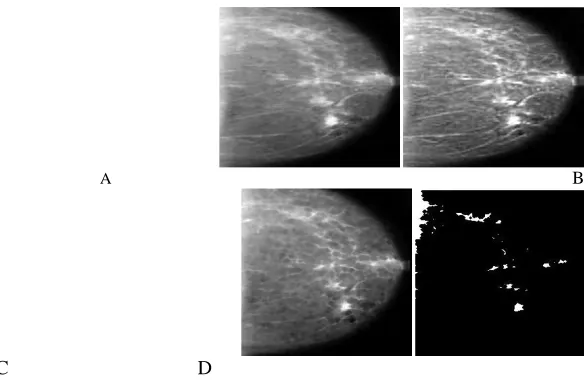
Since tumor areas are seen bright in the masked image, they can be extracted as candidate
areas by simple thresholding which is practically set at 190 in image base (figure 3).
B
A
C D
Figure (3) extracting candidate areas from mammograms. A: original image B: improved image
C: masked image D: extracted candidate areas
4.2.
Labeling candidate areas
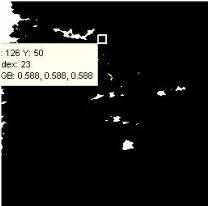
After the extraction of candidate areas, pixels with similar or close features are
labeled the same.
Figure (4): labeling extracted candidate areas
4.3.
Feature extraction
After preprocessing and image segmentation, 9 features are extracted which are
suitable describers of the information about the image, image boundary, and mass
density. These features have been introduced and used in many references. What is
important here is that these features are capable of extracting the information
necessary to the mammoghraph. They are as follows. ● The total amount of pixels around the candidate area (10). ● The average amount of pixels of the candidate area (11).
● The standard deviation of the amount of pixels of the candidate area (11). ● The maximum amount of pixels of the candidate area (13).
● The minimum amount of pixels of the candidate area (13). ● The amount of entropy of pixels of the candidate area (13). ● The total amount of pixels of the candidate area (11). ● The total gradient upon X
● The total gradient upon Y
4.4.
Nuro-fuzzy-based classifications
The nuro-fuzzy system used in this study is Takagi-Sugeno. It includes adaptability
parameters and functions of fuzzy rules, which is optimized during training. Training
period needs supervision and despite all parameters of the system are automatically
optimized they can also be manually adjusted. This is one of the best attributes of the
nuro-fuzzy systems. MATLAB version 7 (Nuro-fuzzy toolbox) is used to implement
nuro-fuzzy system and it is optimized and updated through controlling and modifying
variables.
First, the basic structure of the system must be determined. This includes the number
of inputs, outputs, fuzzy rules of conditions and the membership functions. The
number of inputs equals the size of the feature line (since we have 9 features, the
feature line consists of 9 rows). The number of outputs of the system always equals 1,
that is, we consider 1 neuron only in the output layer and train the system to equal the
number of the neuron with the classification. There are two 0 and 1 classifications in
this study. The 0 class indicates normal condition in the image, whilst the 1 class
shows the existence of tumor.
Gaussian exponential functions with normal distribution are selected for the system
because they have consistent behavior, reduce noise and yield better results.
The number of fuzzy rules (If … then) of condition can be varied depending on the
situation; however, in order for the system to distinguish “n” different classes the
number of the rules must be at least n-1. In this study it equals n = 2 so the system
will have 3 output classifications the third of which belongs to new and/or unknown
classes. It means that any feature that does not fit into the other known classes, will
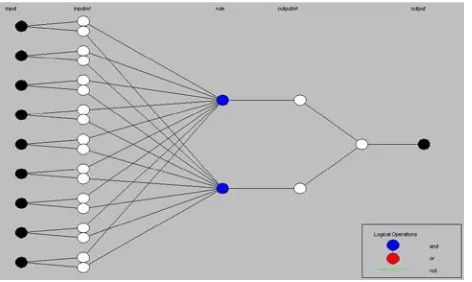
automatically fit into the third one. The block structure of the system is shown in
figures (5) and (6).
Figure (5): the proposed structure of the nuro-fuzzy system
Figure (6): the implemented (ANFIS) nuro-fuzzy system
Since training the system needs supervision, a target vector is determined which
coordinates with the number of training classes. One neuron is supposed to be in the
output and the target vector is as follows: T:{1, 2, 3 … n+1}. We add one extra class
to the real number of classes so that we can ascribe unidentified classes to it. It is not
of practical use in the images under study, though because all classes are
pre-identified to the system and the system is already trained with them. Now it’s time to
begin training the system. It is designed to ask for 2 input parameters from the user at
the beginning, 1- training samples and 2- the number of times to reach the target. In
order to compare the findings, 70 samples are used for the proposed system and MLP
network and the remaining 30 are used for training. The number of times to reach the
target indicates the number of attempts system make in each training stage to achieve
it. In other words this parameter shows the number of optimizing cycles and value
adjustments in the backpropagation system mechanism. This value needs to be
adjusted in such a way that the root-mean-square deviation is minimized. As the
number of attempts increases, the time allocation for training increases, as well so it
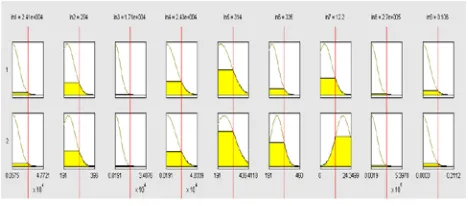
can not be a lot because it will necessitate a lot of time for training. Membership
functions after training is shown in figure (7).
Figure (7): membership functions after training
Two rules are used in Takagi-sugeno which are as follows:
Rule 1: if(in1 is in1cluster1) and (in2 is in2cluster1) and (in3 is in3cluster1) and (in4 is in4cluster1) and (in5 is in5cluster1) and (in6 is in6cluster1) and (in7 is in7cluster1) and (in8 is in8cluster1) and (in9 is in9cluster1) then (out1 is out1cluster1)
Rule2: if(in1 is in1cluster2) and (in2 is in2cluster2) and (in3 is in3cluster2) and (in4 is in4cluster2) and (in5 is in5cluster2) and (in6 is in6cluster2) and (in7 is in7cluster2) and (in8 is in8cluster2) and (in9 is in9cluster2)then (out1 is out1cluster2)
4.5.
Detecting the tumor area using active contour and Levelset
method
In nonparametric active contour models Levelset method is used for enhancement of the model. This theory was first introduced by Sethian and Oshar (2003). (5) it is assumed that the curve C is a Levelset of Φ. Curve C conforms to a number of points whose φfunction is fixed and usually zero. Geometric models are divided into two groups, namely edge-based and area-based. In edge-based models the conduction of the curve is done based on the image gradient information. However, in images with weak gradient information or if the information is not sufficient for conduction of the curve area-based models are used. The tumor area is extracted through geometric model, Levelset method and primary active contour. (Figure (8)).
c
b
a
D e f
Figure (8): Tumor extraction via Levelset method A. original image B. improved image C. masked image D. candidate area E. applying primary contour and F. tumor extraction area.
4.6.
Findings
The result of the algorithm is based upon two criteria namely, sensitivity and specificity as follows:
● Sensitivity: the ratio of the number of detected pixels as tumor to the whole number of tumor pixels in the image.
● Specificity: the ratio of the number of detected pixels as clean to the whole number of clean pixels in the image.
The higher these criteria are, the better the function of the methods. They are computable according to the following formulas:
Sensitivity = 𝑇𝑝
𝑇𝑝+𝐹𝑛 (3)
Specificity = 𝑇𝑛
𝑇𝑛+𝐹𝑝 (4)
Tp = the number of abnormal pixels which are detected as abnormal Tn = the number of normal pixels which are detected as normal Fp = the number of normal pixels which are detected as abnormal Fn = the number of abnormal pixels which are detected as normal
Table (1) illustrates the findings of the applied, proposed algorithm on five mammograms in brief.
.9999 .9059
11 4 191901 106
Forth
.9998 .9898
8 23 191201 780
Fifth
Table (1)
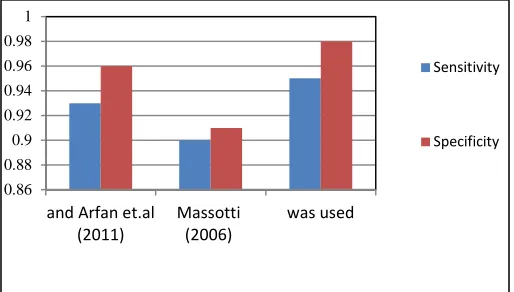
After computing Sensitivity and Specificity of the 30 images in MIAS Database, the findings are compared to the previous algorithm findings to see if any improvement has taken place. In so doing, the proposed algorithm is compared to the Massotti (2006) and Arfan et.al (2011) algorithms in which SVM was used.
Figure (9): the comparison made between the proposed and other algorithms
5.
Conclusion
Using neuro-fuzzy system has caused mammograms features to be reduced. By reducing these matrix feature values, algorithm complication and the number of system training will be reduced. Since the number of system training is fewer than the neuro-fuzzy system and the neural network, the time for detection is also reduced in this study.
0.86 0.88 0.9 0.92 0.94 0.96 0.98 1
and Arfan et.al
(2011) Massotti(2006) was used
Sensitivity
Specificity
6.
References
[1] McGill Faculty of Medicine,interactive mammography analysis web
tutorial,http://sprojects.mmi.mcgill.ca/dir/mammography.html,McGill University, 2005.
[2] National Breast Cancer Foundation, Inc., Breast Cancer Symptoms
signs,http://www.nationalbreastcancer.org/signs_and_symptoms, 2006.
[3] A. Author 1 and B. Author 2, “Title of the journal paper” IEEE Trans. Antennas and Propagation, Vol. 55, No. 1, pp. 12-23, 2007.
[4] Mamdani E. H. and Assilian S. "An experiment in linguistic synthesis with a fuzzy logic controller", International Journal of
Man-Machine Studies, Vol. 7, No.1, pp. 1-13, 1975.
[5] Mencattini A., Salmeri M., " Mammographic Images Enhancement and Denoising for Breast Cancer Detection Using Dyadic Wavelet
Processing",IEEE transactions on instrumentation and measurement, VOL. 57, NO. 7, 2008.
[6] Takagi T. and Sugeno M., "Fuzzy identification of systems and its applications to modeling and control", IEEE Trans, on Systems, Man
and Cybernetics, 15, pp. 116-132, 1985.
[7] Webster, J. Encyclopledia of Medical Devices and Instrumentation , 2nd ed., Vol. 4. U.S.: Wiley Insterscience, 2006.
[8] Zadeh L. A. “The role of fuzzy logic in modeling, identification, and control.” Modeling, Identification, and Control, Vol. 15, No. 3, pp
191-203, 1994.
[9] Kim J.K, Park H.W,”Statistical textural features for detection of microcalcifications in digitized mammograms”, IEEE Trans. Med.
Image., Vol. 18, No.3, pp. 231-238, 1999.
[10] Kuo W.J,Chang R.F, Moon W.K, Lee C.C,and Chen D.R, ”Computer-aided diagnosis of breast tumors with different US system, “
Academic Radiology, Vol. 9,No.7, pp. 793-799,2002.
[11] Halkiotis S,Mantas J, and Botsis T, “Computer-aided detection of clustered microcalcifications in digital mammograms.” Elsevier
North-Holland, Inc. Signal Processing, Vol.87, No. 7,pp. 1559-1568, 2007
[12] Arfan Jaffar M. , Naveed N., Zia S., Ahmed B., Tae-Sun Choi(2011) “DCT features based malignancy and abnormality type
detection method for mammograms” International Journal of Innovative Computing, Information and Control, Volume 7, Number 9
[13] Sheng- Chin Yang, Chuin-Mu Wang, Yi-Nung Chung, Giu-Cheng Hsu, San-Kan Lee, Pau-Choo Chung, Chein-I Chang, “A
Computer-Aided System for Mass Detection and Classification in Digitized Mammograms”, Biomedical Engineering Applications, Basis, and
Communications, Vol. 17, No.. 5,pp. 215-228, 2005.
[14] Massotti, M. (2006). A ranklet-based image representation for mass classification in digital mammograms. Medical Physics, 33(10),
3951–3961.
[15] Mohamed M.E. ,Ibrahima F., Brahim B. S. “A statistical based feature extraction method for breast cancer diagnosis in digital
[16] mammogram using multi resolution representation” Computers in Biology and Medicine 42 ,pp. 123–128, 2012.
[17] Dheeba.J, Wiselin Jiji.G. “Detection of Micro calcification Clusters in Mammograms using Neural Network” International Journal
International Journal of Advanced Science and Technology Vol. 19, 2010.