How top consumers structure
food webs with multiple pathways
of energy flow
Sabine Wollrab
Dissertation
der Fakultät für Biologie
der Ludwig-Maximilians-Universität München
zur Erlangung des Doktorgrades
der Naturwissenschaften
Dr. rer. nat.
Erstgutachter: Prof. Dr. Sebastian Diehl Zweitgutachter: Prof. Dr. Wilfried Gabriel
Eingereicht am: 08.01.2013
Contents
Summary... 1
General Introduction... 3
Scope of this Thesis... 13
Chapter 1: Simple rules describe bottom-up and top-down control in food webs with alternative energy pathways... 15
Chapter 2: Ontogenetic diet shifts promote predator-mediated coexistence... 55
Chapter 3: Consumer functional response type mediates bottom-up responses of the ‘pentagon module’ in the lower oceanic food web... 78
General Discussion and Research Outlook... 105
References... 110
Acknowledgements... 127
Summary
Natural food webs are highly complex systems, however, this complexity arises from simple consumer-resource interactions. Feeding interactions not only determine food web structure but constitute the building blocks of the pathways of energy flow to higher trophic levels. Our understanding of how topological web properties determine these flows and the resulting community dynamics is still very fragmentary and limited to simple structures such as linear food chains and a few basic food web modules consisting of only 3-4 species. Nevertheless, forecasting community effects of external forcing through, for example, human induced stressors or climatic change, requires good knowledge of how bottom-up and top-down forcing will propagate through a given web. Empirical evidence suggests that apex predators take on a central role in this context.
In chapter 1 of my thesis I take the approach of reducing the complexity of real food webs by assuming that its constituent species can be lumped into functional groups belonging to one of two alternative pathways of energy flow. The resulting webs consist of two food chains emerging from a shared limiting resource (e.g. a mineral nutrient) which may or may not be reconnected at the top through a generalist apex predator. Exploring dynamical models of a suite of 12 increasingly complex webs, I find that their equilibrium responses to nutrient enrichment and harvesting of apex predators are determined by only two easily measurable topological properties: the lengths of the component food chains (odd-odd, odd-even, or even-even) and presence vs. absence of a generalist apex consumer reconnecting the two pathways (yielding looped vs. branched webs). Many results generalize to other looped or branched web structures and the model can be easily adapted to include a detrital pathway. I therefore propose that models with alternative energy pathways may serve both ecosystem and community ecologists as a useful conceptual framework for the future.
population can create an ‘emergent’ competition-predation trade-off between prey, where food limitation in the predator stage feeding on the superior competitor creates a bottleneck in that stage, which enhances predation on the superior competitor and relaxes predation on the inferior competitor. Compared to a situation where juveniles and adults have identical diets, pronounced diet shifts therefore greatly enlarge the range of prey coexistence along a gradient of resource enrichment. With diet shifts, however, coexistence usually occurs as one of two alternative states and, once lost, may not be easily restored. Importantly, only a rather minor ontogenetic diet shift is necessary to produce the described patterns. My results are therefore an important generalization of existing theory on predator-mediated coexistence - which has so far ignored ontogenetic diet shifts.
General Introduction
Food web – a definition
The process of energy gain and loss is vital for all organisms. Energy is gained through
consumption or resource acquisition (through primary production) and transformed into own
biomass, and it is lost through respiration or by being consumed. Hence feeding interactions
are the major structuring force in communities. A food web reflects this structure “as a
network of consumer–resource interactions among a group of organisms, populations or
aggregate trophic units” (Winemiller & Polis 1996). Food webs may differ in resolution by
displaying feeding interactions for species, entire trophic levels, or in terms of functional
groups (species that share the same resources and consumers).
While the structure of a food web is determined by the interactions among its constituent
populations (May 1973, Rooney et al. 2008), population dynamics are in turn influenced by
the structure of the food web (DeAngelis 1992). This implies that the community response
cannot only be predicted by the properties of its constituent parts, but has to be investigated
dynamically.
Conceptual background
The origins of food web theory date back to the beginning of the 20th century and is
strongly based on insights from Elton (1927) and Lindeman (1942). Elton who introduced the
community perspective to ecology, drew attention to the interrelation of abundance patterns
between different trophic levels. The observation that high numbers of (small) prey are
needed to sustain a single (larger) consumer is expressed in the ‘Eltonian pyramid’, where the
total number of individuals decreases with increasing trophic level. Lindeman explained this
observation on an energetic basis, i.e. in terms of biomass being a measure of energy content.
Lindeman argued that, following the second law of thermodynamics, energy is lost at every
transition to the next higher trophic level, which leads to a decrease in available energy
towards higher trophic levels.
The energetic approach led to the prevalent view that communities are strongly bottom-up
controlled, with the abundance of higher trophic levels being ultimately determined by
available plant tissue and hence primary production. This view was contested by Hairston,
Smith and Slobodkin (1960) in their seminal paper. These authors argued that, given the
food, but are rather under strong top-down control by their consumers, which releases plants
from grazing pressure. While the so called ‘green world hypothesis’ was strongly debated in
the following decades (Murdoch 1966, Polis & Strong 1996), it gave rise to a more
conceptual thinking in terms of trophic dynamics and introduced the idea of trophic cascades.
Food chain theory
Based on the modelling approach by Lotka (1925) and Volterra (1926), who were the first
to study population dynamics with the help of differential equations, Rosenzweig and
MacArthur (1963) related the “green world hypothesis” to mathematical reasoning.
Rosenzweig and MacArthur investigated general properties of predator-prey relationships and
developed a theoretical basis for concepts such as predator control and primary productivity
(Rosenzweig & MacArthur 1963, Rosenzweig 1971, reviewed in Fretwell 1987). It took
another 15 years until Fretwell (1977) and Oksanen et al. (1981) developed a general
framework for bottom-up and top-down control in food chains with more than three trophic
levels.
Food chain theory predicts an alternating pattern of bottom-up versus top-down control
from the top trophic level to the bottom (Fretwell 1977). Top consumers are assumed to be
only limited by food supply and thereby control their prey (the sub-terminal species along the
food chain), which in turn releases the prey of the sub-terminal species from predation
pressure. This pattern then repeats itself alternatingly down the food chain. Concordantly, in
each food chain the top trophic level and all levels in even distance from the top are
bottom-up controlled (i.e. their equilibrium abundance/biomass increases with enrichment of the
primary producers), whereas all trophic levels in odd distance to the top are top-down
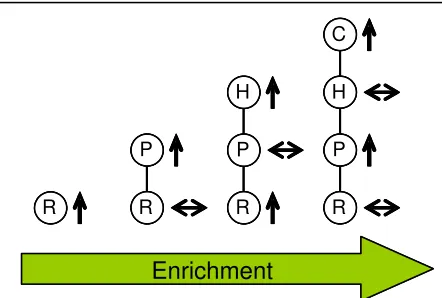
controlled (i.e. are kept at a constant level unaffected by enrichment) (Fig. 1). Furthermore,
Oksanen et al. (1981) predicted a lengthening of the food chain with increasing enrichment,
i.e. successful establishment of a next higher trophic level requires sufficient productivity at
the base of the food chain (Fig. 1).
Fig. 1 Assembly sequence of successive trophic
levels along an enrichment gradient with
R-Resource, P-Primary producer, H-Herbivore,
C-Carnivore. Arrows next to circles indicate the
equilibrium response of the corresponding
trophic level to enrichment, indicating either
increase (upward arrows) or no change
(horizontal arrows). R
P H C
R R
P H
R P
Enrichment
R P H C
R R
P H
R P
Food web theory
While food chain theory has given much insight into the consequences of trophic linkages,
the study of many other central trophic interactions requires the incorporation of parallel
pathways of energy flow. Food web modules consisting of only a few interacting species have
been extensively used to explore the dynamical consequences of central ecological
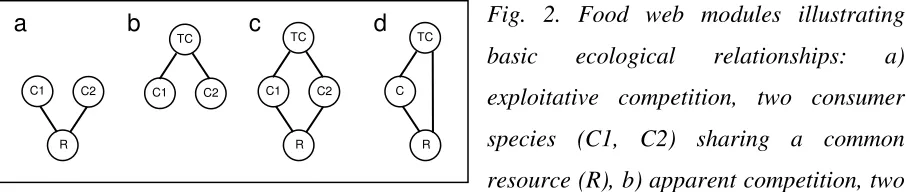
interactions (defined in Fig. 2) such as resource competition, shared (‘apparent’) predation,
intraguild predation, and their interplay.
In the context of food webs with purely exploitative interactions, competition is always an
indirect effect mediated through at least one intermediate compartment (sensu Abrams et al.
1996). Therefore, competition can be either mediated through a basal resource, referred to as
‘exploitative competition’ (Fig. 2a), or through a shared predator, referred to as ‘apparent
competition’ (Fig. 2b).
Fig. 2. Food web modules illustrating
basic ecological relationships: a)
exploitative competition, two consumer
species (C1, C2) sharing a common
resource (R), b) apparent competition, two
consumer species sharing a common predator (TC) c) diamond module, a combination of
modules a and b, d) intraguild-predation, a top consumer (TC) competing with its prey (C)
for a shared resource (R).
With pure exploitative competition for a single limiting resource stable coexistence
between competitors is not possible. The superior resource competitor, being able to persist at
the lowest resource levels (R*), will always exclude the inferior one by suppressing resource
levels below the minimum requirements of its competitor (‘R*-rule’, Tilman 1980). Similarly,
with pure apparent competition the species, which can sustain the highest predator levels P*,
and thus the highest predation pressure (‘P*-rule’, Holt et al. 1994), will exclude all more
vulnerable prey (Holt et al. 1994). In contrast, if the resource and apparent competition
modules are combined, two prey species sharing a common predator and a common limiting
resource, the interaction of both processes can enable coexistence (Fig. 2c). Due to its shape,
the corresponding food web module is referred to as ‘diamond’ web. A necessary condition
for coexistence in the diamond web is that both competitors face an intrinsic
competition-predation trade-off, i.e. the superior resource competitor is also more vulnerable to competition-predation.
TC
C1 C2
TC
R C
R
C1 C2
TC
R
C1 C2
Through a gradual shift in competitive advantage from the superior resource competitor at
low resource enrichment levels towards the less vulnerable competitor at high enrichment
levels, coexistence becomes possible over a range of intermediate enrichment levels (Holt et
al. 1994, Leibold 1996). Insights from the ‘diamond’ module have been very influential on
both empirical and theoretical studies of predator mediated coexistence (reviewed in Chase et
al. 2002).
Another important and ubiquitous trophic interaction is omnivory, i.e. the feeding on
resources/prey from more than one trophic level (Polis & Strong 1996, McCann & Hastings
1997). Omnivory introduces links between non-adjacent trophic levels, resulting in a
reticulate food web structure (Polis & Strong 1996). The smallest reticulate food web with
omnivory is the intraguild predation module (IGP) consisting of an intraguild predator being
involved in competition for a shared resource with its intraguild prey. A necessary condition
for coexistence in the IGP module is that the intraguild prey is the superior resource
competitor, which implies that it can persist with the resource alone at low levels of resource
enrichment; stable coexistence of intraguild predator and prey may then be possible at
intermediate levels of enrichment, whereas the intraguild prey is often excluded at high levels
of enrichment (Holt & Polis 1997, Diehl & Feißel 2000). Within the range of stable
coexistence the dominant interaction shifts from resource competition between intraguild prey
and predator to apparent competition between resource and intraguild prey along an
enrichment gradient. This shift is accompanied by a decrease in the intraguild prey and an
increase in the intraguild predator, which leads to the exclusion of the intraguild prey at
higher enrichment levels.
The intraguild predation web does not allow a clear comparison with trophic cascade
theory, because the trophic level of the intraguild predator is at a non-integer trophic level
above the trophic level of the intraguild prey. This holds true for omnivores in general and
was one major criticism concerning the applicability of trophic cascade theory to real
ecosystems (Polis & Strong 1996).
The above examples already highlight the potential for indirect effects mediated through
multiple, parallel energy pathways to shape community dynamics and suggest a complex
interplay with external forcing such as the availability of production limiting nutrients.
Several extensions of the above food web modules including more trophic levels and more
links between them, have been explored (e.g. Leibold 1996, Grover 1997, Abrams 1993,
Hulot et al. 2000, Hulot & Loreau 2006). Still, a comprehensive framework for the prediction
to the one established for simple, linear food chains (Fretwell 1977, Oksanen et al. 1981), is
so far missing. Such a framework will be developed in chapter 1.
Ontogenetic diet shifts
Ontogenetic development is a fundamental life history process describing the
development of an individual from birth to maturation. There are major differences between
the pre- and post-maturation phase concerning energy allocation in individuals. While
individuals will invest all their net biomass production into somatic growth before maturation,
after maturity they will invest a large fraction of (and, in some species, all) net biomass
production into new offspring. This implies that maturation as well as reproduction are
food-dependent processes. Most species undergo a significant increase in body size from size at
birth to size at maturation, which will often be accompanied by a shift in optimal prey size
(Werner 1988, Hairston & Hairston 1993, Warren 1990, Warren & Lawton 1987, Rudolf &
Lafferty 2011).
In the context of food webs ontogeny splits a population node into at least two
stage-specific nodes (juveniles and adults), which are linked through maturation and reproduction.
These stage-specific nodes may differ in their feeding links to both potential prey and
potential predators. In spite of its prevalence in nature, ontogeny has been largely ignored by
food web theory in general. Only recently the importance of ontogenetic development and
corresponding feedbacks on community patterns have started to become increasingly
recognized (see review by Miller & Rudolf 2011 and references therein).
Recent dynamical models of stage-structured populations with food dependent maturation
and reproduction rates predict that population biomass accumulates in the most food-limited
stage through unbalanced recruitment between the two stages (either high maturation and low
reproduction rate or vice versa, dependent on which stage is more strongly food limited),
forming a developmental bottleneck (De Roos et al. 2007). A population characterized by
dominance of juveniles, and correspondingly high reproduction but low maturation rates, is
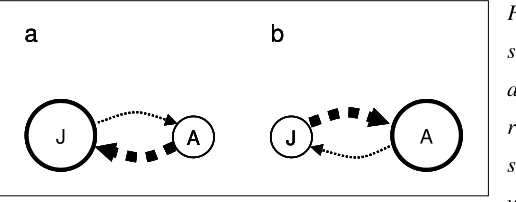
called maturation-regulated (Fig. 3a), while in the opposite case it is reproduction-regulated
(Fig. 3b) (De Roos et al. 2007). Irrespective of the type of regulation, the occurrence of a
bottleneck stage may lead to counterintuitive responses like the increase of biomass in the
alternative stage with increasing stage-specific or unspecific mortality. This
overcompensation, i.e. an increase in biomass in response to increased mortality, results from
relaxed resource competition within the bottleneck stage (De Roos et al. 2007). This feedback
like predators or competitors, where the interplay of internal (population) and external
(community) feedbacks increases the range of possible indirect effects.
Fig. 3. Panel a and b show a stage
structured population with a juvenile (J) and
an adult (A) stage being either
maturation-regulated with dominance of the juvenile
stage (panel a), or reproduction regulated
with dominance of the adult stage (panel b).
Arrows from adults to juveniles represent reproduction, whereas arrows from juveniles to adults
represent maturation, respectively. In panel a and b, the thickness of the arrows corresponds to the
relative dominance of the corresponding rates.
For example, stage-specific predators may facilitate themselves by shifting the population
structure of their prey towards a higher abundance of the stage they are feeding on. In doing
so they take advantage of an overcompensatory response of their prey to increased mortality
(i.e. harvesting by predators), which has been termed an emergent Allee effect (De Roos &
Persson 2002). In contrast, if the stage-specific predator is absent, prey population structure
may in fact inhibit its invasion, when strong density-dependent competition in the bottleneck
stage of the prey strongly limits recruitment to the stage that is consumed by the predator (De
Roos & Persson 2002).
Concerning exploitative competition for two limiting resources, stage-structure with food
dependent maturation and reproduction has the potential to create niche partitioning between
two otherwise identical consumer populations (Schellekens et al. 2010). This contrasts with
predictions for unstructured populations, where coexistence of two species on two limiting
resources needs a trade-off in resource use efficiency for the two resources (Tilman 1982).
Stage-structure also sheds new light on omnivory. Many species assigned to be omnivores
at the population level are in fact life-history omnivores (Pimm & Rice 1987) that feed on
different resources during different life stages. In the intraguild predation module this can be
expressed by assuming a stage-structured predator where the juvenile stage is involved in
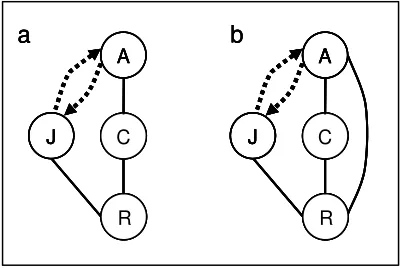
resource competition with the prey of the adult stage (Fig. 4a). Investigations of this module
showed that coexistence of the intraguild predator with the intraguild prey may be enhanced if
one predator stage depends exclusively on the intraguild prey (Fig. 4a; Abrams 2011, Hin et
al. 2011). In contrast, if the structured population can be sustained on the resource alone (Fig.
a b
J A J A
a b
J A J A
a b
J A
4b), coexistence may in fact be inhibited compared to the unstructured case (Van de
Wolfshaar et al. 2006).
Fig. 4. Panel a and b show a life-history omnivore with
juveniles competing with an unstructured consumer
species (C) for a shared resource (R) and adults either
feeding exclusively on C (panel a) or additionally on R
(panel b). Bold dotted arrows indicate maturation and
reproduction between juvenile and adult stages,
respectively. Other connections represent feeding links.
Finally, while diet shifts may be beneficial to an individual consumer in a diverse
community, it may also impose a higher risk of population extinction due to loss of
stage-specific prey species compared to an unstructured generalist (Rudolf & Lafferty 2011).
Communities with stage-structured populations are notoriously prone to exhibiting
alternative states, which are characterized by contrasting dominance patterns within the
structured population (Schreiber & Rudolf 2008, Guill 2009). Once reached, these alternative
states may be irreversible in the absence of severe disturbances due to positive feedbacks such
as the one leading to the emergent Allee effect. A proposed, prominent real-world example
for the relevance of the described feedback mechanisms is the lack of recovery of
commercially overexploited cod populations after their collapses in the North West Atlantic
and the Baltic Sea in spite of fishing moratoria (see references in Van Leeuwen et al. 2008).
Theoretical investigations of this specific system propose that cod, if present, shifts the
size-distribution of its prey in a favourable way, while the collapse of cod has led to a shift in the
size-structure of its prey that inhibits cod recruitment (De Roos & Persson 2002, Van
Leeuwen et al. 2008).
Due to the prevalence of ontogenetic diet shifts in nature, it is important to gain general
insight into its potential effects on community dynamics and how they may arise through the
interplay of stage-specific and community feedbacks. But the development of a synthetic
theory of the influence of stage-structure on community dynamics is still in its infancy. For
example, while predator-mediated coexistence of resource competitors is a conceptual
cornerstone of ecology, the potential impact of stage-specific predation by an ontogenetic diet
shifter on this phenomenon has not been investigated. Consequently, a variant of the diamond
web with a stage-structured top consumer will be investigated in chapter 2.
a
A
R C J
A
R C J
b a
A
R C J
A
R C J
b a
A
R C J
A
R C J
A
R C J
A
R C J
A
R C J
Characterisation of feeding relationships – the functional response
While food web structure is determined by the shear abundance of feeding relationships,
food web dynamics are strongly correlated to the dynamic properties of the corresponding
feeding interactions. Consumption by a predator will most generally be dependent on prey
density. The relationship between per capita consumption of a predator and prey density is
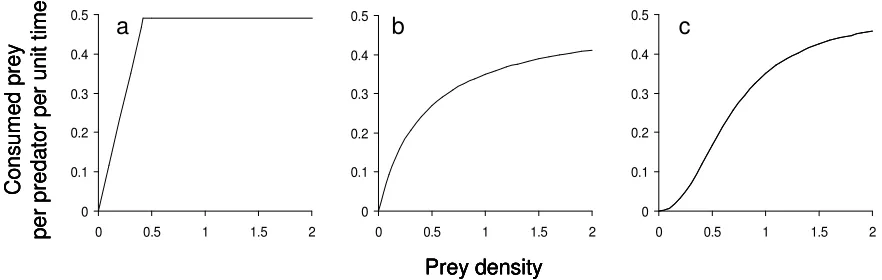
described by the functional response. There are three main types of functional response
curves: linear type 1, downward concave type 2 and sigmoid type 3 (Holling 1959, 65, Fig.
4a-c). In the following I focus on the characteristics of a type 2 versus type 3 functional
response, since they are most relevant to a broad class of consumer species (Jeschke et al.
2004). Moreover, empirical data often do not allow for a clear distinction between these two
types, because the shape of the functional response is often very sensitive to feeding rates at
very low prey densities, where data are rarely collected.
0 0.1 0.2 0.3 0.4 0.5
0 0.5 1 1.5 2 0 0.1 0.2 0.3 0.4 0.5
0 0.5 1 1.5 2 0 0.1 0.2 0.3 0.4 0.5
0 0.5 1 1.5 2
Prey density C o n s u m e d p re y p e r p re d a to r p e r u n it t im e
a b c
0 0.1 0.2 0.3 0.4 0.5
0 0.5 1 1.5 2 0 0.1 0.2 0.3 0.4 0.5
0 0.5 1 1.5 2 0 0.1 0.2 0.3 0.4 0.5
0 0.5 1 1.5 2
Prey density C o n s u m e d p re y p e r p re d a to r p e r u n it t im e 0 0.1 0.2 0.3 0.4 0.5
0 0.5 1 1.5 2 0 0.1 0.2 0.3 0.4 0.5
0 0.5 1 1.5 2 0 0.1 0.2 0.3 0.4 0.5
0 0.5 1 1.5 2
Prey density 0 0.1 0.2 0.3 0.4 0.5
0 0.5 1 1.5 2 0 0.1 0.2 0.3 0.4 0.5
0 0.5 1 1.5 2 0 0.1 0.2 0.3 0.4 0.5
0 0.5 1 1.5 2
0 0.1 0.2 0.3 0.4 0.5
0 0.5 1 1.5 2 0 0.1 0.2 0.3 0.4 0.5
0 0.5 1 1.5 2 0 0.1 0.2 0.3 0.4 0.5
0 0.5 1 1.5 2
Prey density C o n s u m e d p re y p e r p re d a to r p e r u n it t im e
a b c
Fig. 4. Relationship between consumed prey by a single predator per unit time and prey density for (a)
type 1, (b) type 2, (c) type 3 functional responses.
Both response types can be characterized by an attack rate/ searching efficiency (an area
or volume that can be searched for and cleared of prey per unit time in the absence of
handling) and a handling time (the time a predator needs to ‘handle’ its prey before searching
for new prey) (Holling 1959, Murdoch & Oaten 1975). The handling time sets an upper limit
to maximum ingestion rate at high prey densities. While a type 2 functional response assumes
a constant attack rate, for a type 3 functional response the attack rate increases with prey
density (Hassell et al. 1977, Real 1979). The latter is assumed to be typical for predators that
are capable of some kind of learning process, which increases either their motivation to search
and/or their searching efficiency/ attack rate through various behavioural mechanisms
difference between both functional response types has important implications for the stability
properties of consumer-resource dynamics.
A predator with a type 2 functional response has a strongly destabilizing influence on
predator-prey dynamics, because per capita mortality of prey decreases with prey density,
which allows prey to periodically escape predator control and favours the expression of
transient or sustained predator-prey oscillations (Murdoch et al. 2003). In contrast, a type 3
functional response initially leads to a steep increase of per capita prey mortality with
increasing prey density, which has a strong stabilizing influence (Oaten & Murdoch 1975).
Furthermore, in the presence of multiple prey a predator with a type 2 functional response will
feed on different prey species in proportion to their relative frequencies (Gentleman et al.
2003), whereas a predator with a type 3 functional response will feed disproportionately more
on the more abundant prey, a response that has been termed switching (Murdoch 1969). A
switching predator may therefore enhance coexistence by enabling prey to recover when rare,
while exerting strong predation control on the more abundant prey (Van Baalen et al. 2010).
The latter implies that the functional response type not only affects system dynamics, but also
community patterns such as the relative and absolute abundances of alternative prey species.
However, the vast majority of theoretical research on the functional response has focussed
on its consequences for system stability. This was very much triggered by theoretical studies
of May (1973), based on randomly assembled food webs and stability analysis of
corresponding linear interaction matrices, indicating that complexity tends to lower stability
in complex food webs. Many subsequent studies were concerned with resolving the apparent
mismatch between this theoretical result and the observation of abundant, seemingly stable
but complex, natural communities, and attempted so by introducing more realistic food web
properties concerning both network topology and the character of feeding relationships
(McCann & Hastings 1997, Post et al. 2000, Fussmann & Heber 2002, Kondoh 2003, 2006,
Williams & Martinez 2004, Brose et al. 2006, Kartascheff et al. 2009). Within this larger
research agenda it was also shown that even simple 3-level food chains can exhibit complex
dynamic behaviour including chaos (Hastings & Powell 1991), highlighting that not
complexity itself counteracts stability but a critical interplay of structural and functional
properties (Pahl-Wostl 1997, Fussmann & Heber 2002, Post et al. 2000).
Much less effort has been spent on the implications of the functional response for
community composition and community response to environmental forcing. Knowledge on
this issue is still very much restricted to simple predator-prey relationships (Murdoch & Oaten
Sikder 1999, Abrams & Matsuda 2004, Krivan & Eisner 2006) and intraguild predation
(Krivan 2000, Krivan & Diehl 2005). Theoretical studies of multiple interacting species rarely
consider alternative assumptions about the shapes of functional responses. The few existing
examples suggest, however, that community patterns may differ strikingly dependent on these
assumptions (Gismervik & Andersen 1997, Anderson et al. 2010). This is of considerable
concern given that data often do not allow a clear empirical distinction between type 2 and
type 3 functional responses, and that a modeller’s choice of functional response is therefore
frequently arbitrary. Furthermore, the shape of the functional response may be critically
altered by the presence of alternative prey (Murdoch & Oaten 1975, Abrams 1990), making
the interpretation of empirical data more difficult (Smout et al. 2010). The interplay of
structural web properties and the functional response type of a multispecies predator will
The Scope of this Thesis
The central scientific question of my thesis is how structural food web properties determine
bottom-up and top-down response patterns. My studies are all based on analytical and
numerical analysis of dynamic equation systems. As indicated in the previous sections,
knowledge about how food web topology determines community patterns is merely based on
food chains or simple ecological interactions in webs with up to 4 interacting species. In
chapter 1 of my thesis I therefore systematically study the bottom-up and top-down response
patterns of a suite of 12 increasingly complex webs consisting of a shared resource (limiting
nutrient) at the base of each web from which two alternative food chains emerge, which may
or may not be reconnected on top by a shared consumer. The constituent chains can be of the
same or different length and include up to five trophic levels (counted from the resource to the
top species). I investigate the equilibrium response of each web to bottom-up forcing through
an increase of nutrient availability and top-down forcing through increased top consumer
mortality by analyzing the equilibrium solution of the corresponding differential equation
system. For the simplest case with linear food uptake terms, I directly investigate the analytic
equilibrium solution for its dependency on relevant system parameters, i.e. total amount of
nutrients in the system and top-consumer mortality. For the case of saturating functional
responses (= a type 2 functional response), investigations are based on a combination of
analytical and numerical investigations.
In chapter 2 I relax the assumption of homogenous populations and consider ontogenetic
development at the top consumer level of the ‘diamond’ web (one consumer with two
alternative prey species competing for a shared resource). I investigate the role of an
ontogenetic diet shift between a juvenile and an adult consumer stage for coexistence between
competing prey (P1 and P2). The degree of diet shift is defined by the parameter qC, assuming
an ontogenetic trade-off in relative foraging efficiencies of juvenile vs. adult consumers for
the two prey species. Dependent on qC I can investigate the whole range from no diet shift in
the absence of differences in resource use between both stages, to a complete diet shift where
each consumer stage is specialized on a different prey. Numerical investigations are based on
a stage-structured biomass model with food-dependent maturation and reproduction rates for
juvenile and adult consumer stage, respectively. I investigate the influence of the degree of
states by systematically varying the degree of diet shift for various levels of resource
enrichment.
In chapter 3 I investigate the consequences of flexible (= type 3 response, ‘switching’) vs.
non-flexible (= type 2 response) feeding behaviour of a generalist top consumer for system
dynamics of the lower oceanic plankton food web. The food web consists of two differently
sized classes of primary producers (nano- and micro-phytoplankton), which compete for a
limiting nutrient and give rise to alternative energy pathways through size-selective feeding
by ciliates and copepods. One pathway originates from nano-phytoplankton over ciliates to
copepods, and the other from micro-phytoplankton directly to copepods. I numerically
investigate the equilibrium dynamics of the corresponding differential equation system under
various combinations of nutrient enrichment and top consumer (copepod) mortality under
Chapter 1
Simple rules describe bottom-up and top-down control
Abstract
Many human influences on the world’s ecosystems have their largest direct impacts at either
the top or the bottom of the food web. To predict their ecosystem-wide consequences we must
understand how these impacts propagate. A long-standing, but so far elusive, problem in this
endeavour is how to reduce food web complexity to a mathematically tractable, but
empirically relevant system. Simplification to main energy channels linking primary
producers to top consumers has been recently advocated. Following this approach, I propose a
general framework for the analysis of bottom-up and top-down forcing of ecosystems by
reducing food webs to two energy pathways originating from a limiting resource shared by
competing guilds of primary producers (e.g. edible vs. defended plants). Exploring dynamical
models of such webs I find that their equilibrium responses to nutrient enrichment and top
consumer harvesting are determined by only two easily measurable topological properties: the
lengths of the component food chains (odd-odd, odd-even, or even-even) and presence vs.
absence of a generalist top consumer reconnecting the two pathways (yielding looped vs.
branched webs). Many results generalize to other looped or branched web structures and the
Introduction
Many human influences on the world’s ecosystems have their largest direct impacts at
either the top or the bottom of the food web. For example, hunting, fishing, habitat loss, and
bioaccumulation of toxicants typically most strongly affect larger-bodied carnivores and apex
predators (Connell 1990, Laliberte & Ripple 2004, Schipper et al. 2008, Lotze & Worm
2009), whereas land use changes, fertilization, and climate change most immediately impact
primary producers (Asner et al. 1997, Behrenfeldt et al. 2006, Haberl et al. 2007). These
direct impacts frequently cascade up and down the food chain (Chavez et al. 2003, Baum &
Worm 2009, Beschta & Ripple 2009), the community-wide consequences sometimes being so
pervasive that they result in regime shifts (Cury & Shannon 2004, Estes et al. 2011). Clearly,
to predict the ecosystem-wide consequences of human impacts we must understand how their
direct effects propagate through entire food webs. Consequently, better conceptual integration
of the interplay of bottom-up and top-down forces within ecosystems has been called for in
several areas of applied ecology, e.g. in fisheries, oceanography, and climate impact research
(Frank et al. 2007, Cury et al. 2008, Walther 2010).
While substantial progress has been made in the description and theoretical exploration
of complex food webs (Pascual & Dunne 2006, Bascompte 2010), food web theory has
historically focussed on network properties such as intervality, connectance, and interaction
strength, but has made few tangible contributions to questions concerning human impacts on
ecosystem function (e.g. standing stocks and fluxes of biomass) (Memmott 2009). A critical
issue in the exploration of the effects of bottom-up and top-down forces on ecosystems is how
to reduce food web complexity to a mathematically tractable, but empirically relevant system
(Yodzis 1998, Cury et al. 2008). The most simplifying approach lumps species into trophic
levels, resulting in a single food chain describing the whole ecosystem (Hairston et al. 1960,
Oksanen et al. 1981). While food chain theory has had some success in describing empirical
patterns (e.g. Persson et al. 1992, Crete 1999, Aunapuu et al. 2008), it has long been criticized
for its oversimplification of trophic complexity (Polis and Strong 1996, Leibold et al. 1997).
A pervasive issue in the critique of community-wide food chain theory has been the
recognition that primary producers differ vastly in size, defendedness and nutritional quality
for herbivores (Murdoch 1966). These differences frequently lead to compensatory biomass
responses within the primary producer level when productivity or herbivore pressure changes
(Leibold 1989, Grover 1994, Hillebrand et al. 2007). Primary producers differing in size,
defendedness and nutritional quality do, in turn, often have their own, distinct suites of
observed, the body mass of herbivores typically increasing with increasing producer size and
defendedness and with decreasing producer quality (Armstrong 1994, Hillebrand et al. 2009,
Olff et al. 2009). The resulting food chains originating from different types of primary
producers represent parallel pathways of energy flow through an ecosystem. These energy
pathways may remain entirely separated, but are frequently connected by consumers at higher
trophic levels (Rooney et al. 2006, Pringle & Fox-Dobbs 2008, Olff et al. 2009).
Simplification of food webs to main energy channels linking producers to top
consumers is a recently advocated approach in the analysis of ecosystem dynamics which, in
the marine realm, has been termed end-to-end models (Fulton 2010, Shin et al. 2010).
Contrary to food chain theory this approach can describe differential responses to bottom-up
and top-down forcing along alternative food chains (Stibor et al. 2004), but keeps ecosystem
models much more tractable than complex, full-scale food web descriptions. While a number
of food web modules with multiple food chains have been explored with dynamic models
(Abrams 1993, Grover 1997, Hulot & Loreau 2006), a comprehensive theoretical treatment of
the effects of bottom-up and top-down forcing on food webs with alternative energy pathways
is lacking.
In this paper I propose a general theoretical framework for such an analysis by reducing
food web structure to two main energy pathways originating from distinct types of primary
producers (e.g. edible vs. defended plants or plants in two different microhabitats). The
primary producers are assumed to compete for limiting resources and to support separate food
chains of varying length (up to the secondary carnivore level), which may or may not include
a generalist top consumer reconnecting the chains. To explore the effects of bottom-up and
top-down forcing on these food webs I analyze their equilibrium responses to changes in
supply with a limiting plant resource and in mortality of a top consumer. I find that the
response patterns depend on only two structural properties: the number of trophic levels in
each food chain and the presence vs. absence of a generalist top consumer. Within my
modelling framework, food web responses to bottom-up and top-down forcing can therefore
be described by a surprisingly small set of rules. Many of the results extend to food webs
where multiple pathways originate and reconnect elsewhere than at the producer and top
consumer levels, and the model can be easily modified to describe food webs including a
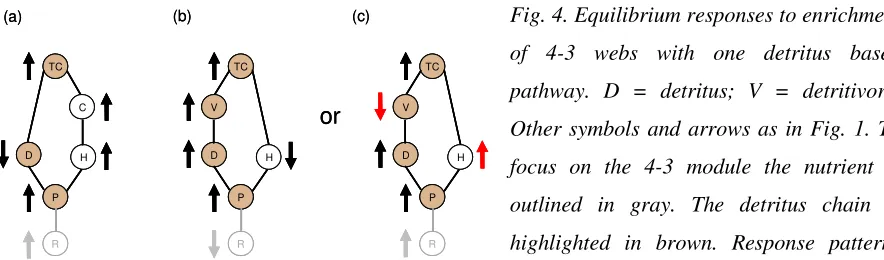
Model structure
I explored patterns of biomass and energy flow in model food webs consisting of two
distinct chains that are linked at the bottom through a shared limiting nutrient. Webs where
the two chains are additionally linked at the top through a shared (= generalist) top consumer
are referred to as ‘looped’ webs, webs lacking a shared top consumer are termed ‘branched’
webs (Fig. 1). Within each web food chains are labeled chain 1 and chain 2, respectively.
Each chain i can contain up to five trophic levels: the shared limiting nutrient (R), a primary
producer (Pi), a herbivore (Hi), a primary carnivore (Ci), and a secondary carnivore (Fig. 1).
The top consumer in a chain is labeled TCi in branched webs and TC in looped webs,
regardless of its trophic level.
Each food web is modeled with differential equations describing the rates of change of
its constituent populations. The rate of change of the biomass density Yi of each intermediate
species (a species that is both a consumer and a prey/resource) in chain i is described by
(
XY XY i Y YZ i)
ii Y e A X m A Z
dt dY
i i i i
i i
i − −
= (1a)
where Xi is the density of the prey/resource of species Yi and Zi is the density of the predator
of Yi. Depending on food web topology Pi, Hi, and Ci take on the roles of prey (Xi),
intermediate consumer (Yi) or predator (Zi) in different equations, whereas R and secondary
carnivores only take on the roles of resource (Xi) and predator (Zi), respectively. The term
i Y X Y
X A X
e
i i i
i describes the specific growth rate of species Yi and AYiZiZi its specific loss rate due to consumption by Zi. The rate of change of a top consumer is described by
(
XiTCi XiTCi i TCi)
ii
m X A e TC dt
dTC
−
= (1b)
in the case of a specialist top consumer feeding on a single prey/resource in chain i, and by
(
eXTCAXTCX eXTCAX TCX mTC)
TCdt dTC
− +
= 1 2
2 2 1
1 (1c)
in the case of a generalist predator feeding on prey/resources from both chains.
In all equations above, AJK describes a type 2 functional response of consumer K
feeding on prey/resource J. When consumer K feeds on a single prey/resource, AJK takes the
form
J h a
a A
JK JK
JK JK
+ =
1 (2a)
2
1 2 2
1 1
1 a h J a h J
a A
K J K J K J K J
K J K
J
i
i = + + , (2b)
where Ji stands for the prey/resource in chain i. Note that intermediate species take on the
respective roles of consumer (Yi = K) and prey (Yi = Ji) in the left-most and right-most terms
in the parenthesis of equation 1a.
In equations 1a-c eJK is the conversion efficiency of consumed prey/resources J into
consumers K (biomass per biomass), and m is the density-independent specific mortality rate (per time). In equations 2a and 2b hJK is handling time of consumer K for prey/resources J
(time*consumer biomass/prey biomass), and aJK is attack rate (area searched per biomass of
consumer K per time). Note that functional responses are linear when handling times are zero. The nutrient shared by the two chains in a web is assumed to limit primary production.
For simplicity, the biomasses of all other food web components are expressed in units of the
nutrient. I assume constant nutrient-to-carbon stoichiometries for all species. Consequently,
nutrient and energy (= carbon) flows up a food chain are proportional. In the text I therefore
describe the transfer of carbon and nutrients up a food chain in energetic terms rather than in
terms of the nutrient currency used in the equations. For convenience I assume that the system
is closed for nutrients. All results apply, however, equally to systems with chemostat-like
dynamics (results not shown), and likely for many other open systems provided that inputs
and outputs have approached a long term balance (i.e. dRtot/dt→ 0; Grover 1997). The total
amount of nutrients Rtot in the system remains constant over time and is a measure of nutrient
enrichment. Nutrients not assimilated into living biomass are available for primary production
(assuming instant recycling of excreted and dead biomass). The density of free mineral
nutrients R can therefore be calculated from the mass balance equations 3a (for branched webs) and 3b (for looped webs):
∑
∑
−− =
i i i
i
tot Y TC
R
R (3a)
TC Y R
R
i i
tot − −
=
∑
. (3b)Food web analyses
To investigate bottom-up and top-down influences I created branched and looped webs
with up to five trophic levels and studied the signs of the equilibrium biomass changes of all
web components in response to enrichment (increasing Rtot) and altered top consumer
mortality (increasing mTC or i
TC
insights into the relationships among equilibrium biomasses of its components and their
relationships to enrichment and top consumer mortality based on constraints to the
equilibrium solution (see Appendix A1.1). These constraints fully determine the responses of
all components in a web when functional responses are linear (see Appendix A1.2), but
usually not when functional responses are saturating. I therefore explored the responses of
webs with type 2 functional responses numerically and checked the outcomes for consistency
with analytical constraints (see Appendix A1.1, A1.3). When functional responses are linear it
is also possible to solve for the equilibria and to calculate the derivatives of all equilibrium
densities with respect to Rtot and mTC or mTCi (see Appendix A1.2). These calculations were done in Matlab [Mathworks Inc., Natick, MA, USA]. Numerical calculations assuming
saturating functional responses were performed in Matcont 2.4 (Dhooge et al. 2003, as a
package for Matlab).
When functional responses are saturating, equilibria are frequently unstable. It is well
known that equilibrium and time-averaged population sizes may show opposite responses to
enrichment when systems undergo sustained oscillations (Abrams & Roth 1994, Abrams &
Fung 2010). Also, oscillating populations often go through long periods of very low
population size with high risk of stochastic extinction. I therefore only present responses of
stable equilibria. Moreover, the patterns obtained with saturating functional responses are
very similar to, and more easily understood from, the patterns obtained with linear functional
responses. I therefore present the patterns for linear functional responses first and
subsequently highlight the similarities and differences arising from saturating functional
responses.
I labeled each web with a two-number code (e.g. 4-3) for the lengths of its constituent
food chains. Chain length was calculated as the number of nodes from the shared nutrient to
the (shared or unshared) top consumer. I investigated plausible combinations of food chains
of length 2 to 5 (Fig. 1) and distinguished three types of webs: (i) ‘odd-even webs’ consisting
of one chain of odd and one of even length (3-2, 4-3, 5-4), (ii) ‘even-even webs’ consisting of
two even chains (4-4), and (iii) ‘odd-odd webs’ consisting of two odd chains (3-3, 5-3, 5-5).
Feasibility of an equilibrium and responses to enrichment and top consumer mortality differ
systematically between these three types of webs. To facilitate understanding of how trophic
structure arises and how it affects dynamics I have arranged all webs in a possible sequence of
community assembly along a gradient of nutrient enrichment, starting from a simple 2-level
food chain (Fig. 1). Some alternative assembly possibilities exist (e.g. web 1o instead of 1c
I did not analyze webs with more than five nodes per chain, because it seems
implausible that consumers linking the two chains would only occur at the top of such long
food chains. I also did not analyze webs where the chains differ in length by more than two
trophic levels (e.g. 5-2). For linear functional responses, the behavior of any food web with
either longer chains or greater differences in length between its two chains can, however, be
easily inferred from the general rules derived below. When functional responses are
saturating, the same is true for branched webs, whereas some looped webs show parameter
dependent response patterns.
Responses to nutrient enrichment: linear functional responses
The responses to nutrient enrichment in branched and looped food webs can be most
easily understood if I first briefly review the well-known responses of single food chains. The
top consumer in a model food chain is always strictly food limited and controls its
prey/resource at a fixed equilibrium density where food consumption exactly meets the top
consumer’s requirements to offset mortality. Consequently, the top consumer’s prey and all
other populations at an odd distance below the top consumer remain at constant density,
whereas the top consumer itself and all populations at an even distance from it increase with
enrichment (Fig. 1 a, b, o). With sufficient nutrient enrichment the top consumer may reach an
equilibrium density that permits the invasion of a higher level top consumer, adding one
trophic level to the food chain and reversing the population responses to further enrichment
(Oksanen et al. 1981). Alternatively, a second producer with a higher requirement for the
basal nutrient may invade the resident food chain. The latter requires that enrichment has
increased the nutrient to the density required by the invader, which is only possible if the
resident food chain is of odd length (e.g. Fig. 1 b to c).
Adding a generalist consumer to a 2-level chain (Fig. 1i) or a second producer to a
3-level chain (Fig. 1c) produces the simplest possible looped and branched webs, respectively.
Once there are two chains in a web, the response to nutrient enrichment depends on whether
the web is branched or looped and on the type of web (i.e. odd-odd, odd-even or even-even).
Branched webs
Branched odd-even webs. In branched webs top consumers of both chains always control the populations at odd distance below themselves at constant biomass. For branched
odd-even webs this implies that the shared nutrient is controlled by the top consumer of the
odd chain. Because neither the nutrient nor the producer in the odd chain responds to
enrichment, the odd chain as a whole cannot respond; in contrast, the chain of even length
responds as it would in the absence of a second chain (Fig. 1c, e, g). In other words, in a
branched odd-even web the even chain controls the odd chain. Consequently, biomass always
increases with enrichment in the even chain but remains constant in the odd chain.
Branched even-even webs. Grover (1997) showed that a stable branched web of two even chains is not feasible. In the assembly scenario of Fig. 1 this would require a transition
from an odd-even to an even-even web through invasion of a new top consumer into the odd
chain. However, since the top species in the odd chain of an odd-even web stays constant with
enrichment (Fig. 1c, e, g) its density cannot increase to the threshold required for invasion of a
new top consumer preying on it, thus preventing the assembly of a branched even-even web.
More generally, stable coexistence of two even chains depending on a single basal resource is
impossible, because it requires that both food chains in isolation control the resource at the
exact same equilibrium density R*. Analogous to classical resource competition (where the species with the lower R* excludes its competitor) two even chains with different R* values cannot coexist, a phenomenon that Grover (1997) termed ‘cascade competition’.
Branched odd-odd webs. Invasion of the even chain in a branched odd-even web becomes possible once its top consumer has sufficiently increased after enrichment, giving
rise to a branched odd-odd web (sequence Fig. 1 c to d, e to f, g to h). The two odd chains in
such a web respond to enrichment in the same way as they would in isolation (Fig. 1 d, f, h).
Looped webs
We have just seen in branched webs that top-down control along one chain can suppress
bottom-up responses along the other chain. Linking chains additionally through a generalist
top consumer creates an opportunity for apparent competition, where bottom-up effects from
one chain translate into top-down effects along the other chain. Looped webs therefore show
more complex responses to enrichment than do branched webs.
Looped even-even webs. An even-even topology is possible when a food web is looped. In the assembly sequence looped even-even webs arise from branched odd-odd webs. Both
top species in a branched odd-odd web increase with enrichment, eventually allowing a food
limited generalist top consumer to invade (transition Fig. 1d to l). Once established, looped
even-even webs respond to nutrient enrichment as would each of the constituent food chains
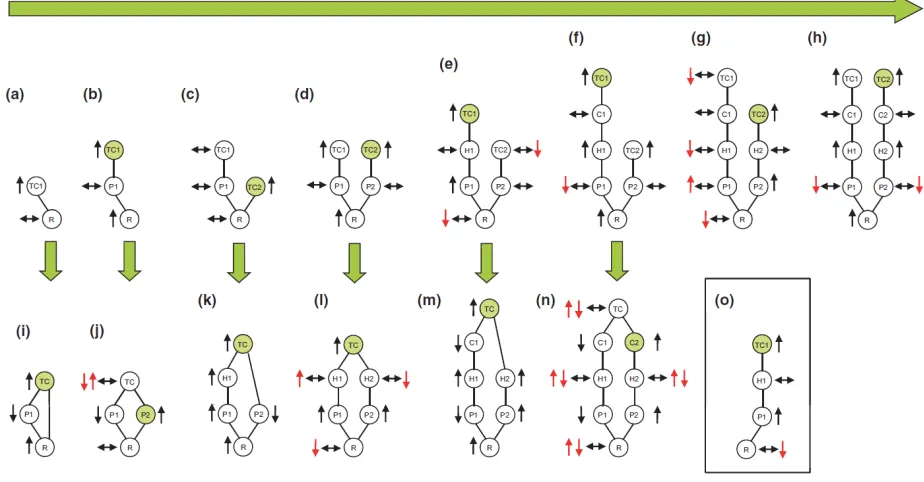
Fig. 1. Equilibrium responses to nutrient enrichment. Webs are arranged in possible assembly sequences along enrichment gradients (green arrows), the last invader being highlighted in green. Circles represent resource (R), producers (Pi), herbivores (Hi), and carnivores (Ci) in chain i (i = 1, 2)
and specialist (TCi) or generalist top consumers (TC). Black arrows next to circles indicate the
direction of change in equilibrium biomass of the compartment in response to enrichment, with horizontal arrows indicating no change. Where saturating functional responses produce qualitatively different outcomes than linear functional responses, the former are shown with red arrows. Pairs of opposed arrows indicate that compartments either increase or decrease, the equilibrium responses of R*, H1
*
, and H2 *
in panel n being correlated. (a, b, o) 2-, , 4-level food chains; (c-h) branched 2, 3-3, 4-3-3, 5-3-3, 5-4, 5-5 webs; (i-n) looped 3-2, 3-3-3, 4-3-3, 4-4, 5-4, 5-5 webs.
Looped odd-odd webs. Because branched even-even webs are infeasible, looped odd-odd webs can only arise from branched odd-odd-odd-odd webs through invasion of a higher level
consumer into one chain, which is immediately preyed upon by the resident top consumer of
the other chain (Fig. 1b to j and f to n). In a looped odd-odd web the top consumer and all
species at even distance below stay constant with enrichment, while species in odd distance
from the top decrease along one chain and increase along the other (Fig. 1j, n). Total energy
flow to the top remains thus constant with enrichment, while biomass accumulates in the
chain with the lower transfer efficiency. The chain experiencing the biomass increase is
always the one that was assembled last in the enrichment sequence (Fig. 1). With sufficient
enrichment the decreasing prey of the top consumer will go extinct, the underlying
looped odd-odd web, the 3-3 web (Holt et al. 1994, Leibold 1996). Here I have shown that the
patterns apply to looped odd-odd webs in general.
Looped odd-even webs. Looped odd-even webs show the least intuitive responses to enrichment: all species in the even chain increase; in contrast, in the odd chain species at even
distance from the top also increase but species at odd distance decrease (Fig. 1i, k, m). In
Appendix A1.2 I derive this pattern analytically. It can also be intuitively understood by
comparing branched and looped webs of identical chain lengths. Enrichment of a branched
web always increases energy flow up the even chain which, in turn, controls the resource and
the odd chain at a constant level (Fig. 1c, e, g). Now, if the even chain’s top consumer is also
the top consumer of the odd chain, increased energy flow up the even chain increases
predation pressure down the odd chain, reducing the biomass of species in odd distance from
the top along the odd chain (compare Fig. 1c vs. i, e vs. k, and g vs. m by merging the top
consumers of the branched chains into a single generalist top consumer). This will eventually
lead to the extinction of the subterminal species in the odd chain, a theoretical result that is
well established for the simplest looped odd-even web, an intraguild predation web (Fig. 1i;
Diehl & Feissel 2000).
Responses to nutrient enrichment: type 2 functional responses
Again, I first consider single food chains. Food chains up to length three respond
identically to enrichment whether functional responses are linear or saturating (Fig. 1a, b).
Responses differ, however, for longer chains. Per capita mortality of a prey decreases with its
own density when the functional response of its predator is saturating. This happens with
enrichment to the third species from the top. In chains of length four or more, the third species
from the top can therefore only be in equilibrium if the density of its food decreases with
enrichment (Fig. 1o). While this has consequences for webs with longer chains, most
enrichment responses of webs observed in the linear case are either conserved or accentuated
when functional responses are saturating.
Branched webs
Branched even-even webs remain impossible with saturating functional responses because of ‘cascade competition’ between the two food chains (Grover 1997).
Branched odd-even webs. As in the linear case, enrichment increases biomass in the even chain but not in the odd chain, because the even chain controls the resource. In a 3-2
the even chain is of length four, however, the resource decreases with enrichment.
Consequently, the odd chain suffers from ‘de-richment’ and responds accordingly; i.e. the top
consumer of the odd chain and all species at even distance from it decrease (Fig. 1e, g). In
odd-even webs with one chain of length four, dominance of the even over the odd chain is
therefore more pronounced than in the linear case; i.e. increased energy flow up the even
chain is accompanied by decreased energy flow up the odd chain (Fig. 1e, g).
Branched odd-odd webs. As in the linear case both chains respond to enrichment as would the corresponding food chains in isolation (Fig. 1d, f, h). If one chain is of length five
its producer decreases with enrichment; all other populations respond to enrichment as in the
linear case (Fig. 1f, h).
Looped webs
Results for looped webs with saturating functional responses are based on numerical
exploration backed up by analytical results (see Appendix A1.1, A1.3, A1.5, A1.6). Most
response patterns from the linear case are conserved, but deviations occur in most
compartments that remain constant in the linear case. For odd-even webs I only found
examples where the response patterns of the linear system are fully conserved (Fig. 1i, k, m).
Biomass constancy, observed for several members of linear webs, is, however, not a robust
feature (Fig. 1j, l, n). With saturating functional responses I found constancy of a food web
member only in the 3-3 web, where the basal resource remains constant (Fig. 1j, see
Appendix A1.5). Generally, in odd-odd webs the top consumer may increase or decrease
depending on parameter values, and so may all web members at even distance from the top in
the looped 5-5 web (Fig. 1j, n). In the latter web the responses of the resource and the two
herbivores are correlated (this follows from eqs. A1.1-3, A1.1-4 and A1.1-6, Appendix A1.1)
and were also correlated with the top consumer in all my numerical runs with stable equilibria
(Fig. 1 n).
Responses to top consumer mortality: linear functional responses
In any food chain with linear functional responses the top consumer always decreases
with increasing own mortality (Fig. 2a, b, s). At equilibrium, this increase in the top
consumer’s mortality must be balanced by an increase in the density of its prey, the effects of
which cascade to the nutrient level. The nutrient therefore decreases with increasing top
consumer mortality in an odd food chain (Fig. 2b), but increases in an even food chain (Fig.
then propagate through both chains, the exact responses depending on the type of web
(branched or looped; odd-odd, odd-even, or even-even). In the case of branched odd-even
webs I must also distinguish between cases where the top consumer of either the odd or the
even chain experiences increased mortality. To more easily describe these responses I call a
change in top consumer mortality a ‘manipulation’.
Common to all webs is that increasing top consumer mortality will eventually cause an
extinction. Interestingly, however, it is not always the manipulated top consumer that dies out.
Instead, the species going extinct is always the one that invaded last along the enrichment
sequence (Fig. 2), owing to its more precarious energetic balance. This implies that the top
consumer of an odd chain cannot go extinct in response to increasing own mortality, if the
remaining community would form an ‘impossible’ branched even-even web. In such cases
extinction always hits either the top consumer of the even chain (branched odd-even webs,
Fig. 2c, f, j), or a subterminal consumer (looped odd-odd webs, Fig. 2n, r).
Branched webs
In a branched web, the (top-down) effects of top consumer mortality in one chain
propagate via the shared nutrient up the other chain, with often counter-intuitive
consequences. When the manipulated chain is even, increasing top consumer mortality
translates into increased nutrient density and, thus, enriches the other chain. Total biomass
therefore decreases in the manipulated chain and increases in the other chain, where the
non-manipulated top consumer and every other population increases (Fig. 2d, g, k). In contrast,
when the manipulated chain is odd, increasing its top consumer’s mortality translates into
increased plant biomass in the manipulated chain. Plants in the manipulated odd chain then
consume a larger fraction of the nutrient, thus ‘de-riching’ the other chain. Total biomass
therefore decreases in the non-manipulated chain and increases in the manipulated chain (Fig.
2c, e, f, h, j, l). The manipulated top consumer of the odd chain itself decreases if both chains
are of odd length. Seemingly paradoxically, however, the manipulated top consumer of the
odd chain does not respond to its own mortality if the non-manipulated chain is even. In the
latter case the non-manipulated even chain controls the nutrient - and all populations at even
distance from the nutrient (including the manipulated top consumer) - at a constant level (Fig.
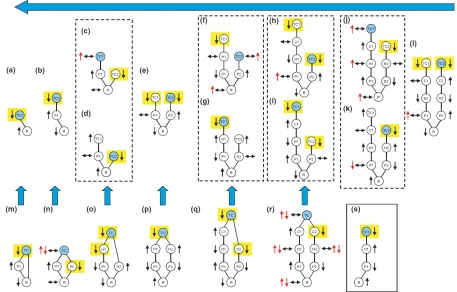
Fig. 2. Equilibrium responses to increased mortality of the top consumer highlighted in blue shading. Symbols and black and red arrows are defined as in fig. 1. The responses of R*, H1
*
, and H2 *
indicated by red arrows in panel r are correlated. Yellow background shading indicates species that may go extinct with sufficiently high top consumer mortality. Thick blue arrows point at webs resulting from such extinctions. When there are two possibilities for which species goes extinct, the outcome is shown that results in a reversal of the enrichment sequence of Fig. 1. This illustrates that, for a given community with fixed parameters, increasing its top consumer’s mortality will reverse the enrichment assembly.
Looped webs
In looped webs all populations that increase with enrichment decrease with increasing
top consumer mortality and vice versa (Fig. 2 m-r). In looped odd-even webs the response
pattern to increased top consumer mortality is therefore exactly opposite to the enrichment
pattern (Fig. 2m, o, q). Populations that stay constant with enrichment remain, however, either
constant (in looped odd-odd-webs, Fig. 2n, r) or increase (in looped even-even webs, Fig. 2p)
with increasing top consumer mortality. These results were derived analytically (see
Appendix A1.2), but can, for most food webs, be understood from three conditions: (i) with
increasing top consumer mortality, at least one of its prey must increase to maintain top
consumer mortality in balance with growth; (ii) at least one other population must decrease to