Article
A Study on the Status and Thermal Environment
Improvement of Ceiling-Embedded Indoor Cooling
and Heating Unit
Miae Seong 1, Cheolsoo Lim 1, Daigon Kim 1, Sangkyun Kim 1, Jaewan Park 2,*
1 Climate and Air Quality Research Department, National Institute of Environmental Research, Incheon, 404-708, Korea; [email protected](M,S.); [email protected](C,M.); [email protected](D,K.); [email protected](S,K.) 2 T.E.S Eng, Daejeon 701-160, Korea; [email protected]
* Correspondence: [email protected]; Tel: 88-10-3058-2397 Abstract
In this study, a basic study was performed to analyze the seasonal temperature status of a research room in the Global Environment Research Building where ceiling-embedded indoor units are installed to study the room temperature status of the building as well as to improve its thermal environment. In addition, a direction for improvement of the indoor thermal environment in the winter was proposed through a CFD (computational fluid dynamics) simulation and was proven by an additional experiment.
Through the results of this study, it appeared that if the ceiling-embedded indoor unit was installed in the small indoor space without considering the thermal vulnerability of its perimeter boundary, the air temperature of the upper part was greatly different from that of the bottom part in the winter. Hence, in this study, as a means to improve it, convectors were installed to minimize the effect of the external thermal environment and angle-controllable air flowing fans were installed to mitigate the stratification distribution. With such result, it was intended to present the essential data for improvement of the thermal environment as well as conservation of heating energy in the winter for buildings by reviewing the use of the ceiling-embedded indoor unit in the future.
Keywords: indoor unit; temperature stratification; PMV; heating; CFD
1. Introduction
The ceiling-embedded indoor unit has the advantage of increasing efficiency of indoor space since it is possible not only to configure it to the thermal distribution system of various cooling and heating heat sources such as air conditioners, multi-system air conditioners and heat pump fan coil units but also to embed the indoor unit, the power line, the cooling and heating supply piping and other required materials.[1][2][3][4] In addition, in the case of the multi-system air conditioner that mainly uses the ceiling-embedded indoor unit, since it is easy to additionally install in the existing building and the area required to install the system is small, its installation and supply continues to expand not only from small and mid-sized office buildings but also to schools, shops and homes.[5]
As a study on the ceiling used a cooling and heating supply system, [7]Tomas Mikeska et al. conducted a CFD simulation analysis on a new form of cooling and heating supply system combined with a cooling and heating radiation system and a ventilation system.[8] Zhai et al. installed sensors in a lecture room where fans were installed on the ceiling to measure temperature, humidity and airflow, experimented the room temperature in the summer and studied the level of satisfaction among persons in the room.[9] Chiang et al. conducted a verification experiment on the school research room where a ceiling type radiation cooling panel and ventilation system is installed to study the thermal environment of the ceiling type radiation cooling system, conducted a CFD simulation analysis on the experimental results and analyzed the wall temperature and the room airflow distribution in detail.[10] Chen Zhang et al built a lab scale ceiling type radiation cooling system, analyzed the PMV (predicted mean vote), the index that indicates the temperature and the indoor thermal environment by position and height, and presented the basic data for the indoor thermal environment of each system.[11] As such, studies on the development of the ceiling type cooling and heating supply system and evaluations on the indoor thermal environment have continued. However, the reality is that studies are lacking on seasonal room temperature states followed by operation of ceiling type embedded cooling and heating systems and improvement of the room temperature deviation caused by temperature stratification in the winter.
Consequently, in this study, with regards to the study object research room in the Global Environment Research Building of the National Institute of Environmental Research, where ceiling type indoor units (FCUs) are installed, the verification analysis was performed on the seasonal temperature difference between the upper and lower parts of the research room and the temperature deviation phenomenon between them due to temperature stratification in the winter. In addition, to derive the plan to reduce the temperature difference between the upper and lower parts caused by temperature stratification in the winter, the air CFD analysis within the research room was conducted and the plan derived by the CFD analysis was applied to the study object research room in order to analyze the said temperature difference. The purpose of this study was to present the basic data for improvement of the thermal environment and conservation of heating energy in the winter for buildings currently equipped with ceiling-embedded indoor units.
2. Study Description and Method
2.1 State of Construction of the Relevant Building and Method of Actual experiment Fig. 1 shows the full front view and the building overview of the Global Environment Research Building of the National Institute of Environmental Research in Korea. The Global Environment Research Building is located in Gyeongseo-dong, Seo-gu, Incheon, Korea and is composed of 1 basement floor and 2 aboveground floors. When rooms in the Global Environment Research Building are divided into heating system
types, the total cooling and heating area is 1677.9㎡, the total heating only area is 45.2㎡ and the total
area without cooling and heating is 726.1㎡. The research room, where the temperature experiment of
temperature stratification by height was conducted, is located at the west end of the second floor. In the room, 4 units of ceiling-embedded 4-way indoor units are installed to supply cooling and heating. It is 10,150mm long, 9,980mm wide and 2,700mm high. The heat source system for cooling and heating supply is the GSHP (ground source heat pump). Fig. 2 and Fig. 3 show the floor plan of the research room where the experiment was held, and locations where sensors were installed.
Figure 1 Front View of the Global Environment Research Building of the National Institute of Environmental Research
Figure 2 Temperature Sensor-Installed Locations of the Research Room
acquisition program, LabVIEW 7.1 program from National Instruments[13] was used to build the extra monitoring program for the experiment. For the experiment, data were collected for 24 hours a day from April 20, 2014 to May 17, 2015. Data were collected every minute. Therefore, 1440 pieces of data were collected a day. For the data on the operating status, the driving status and the device usage status of the cooling and heating system, data from the monitoring program already installed in the Global Environment Research Building[14] were utilized for analysis.
2.2 CFD Analysis Conditions to Derive Improvement Plan for Thermal Environment in the Winter
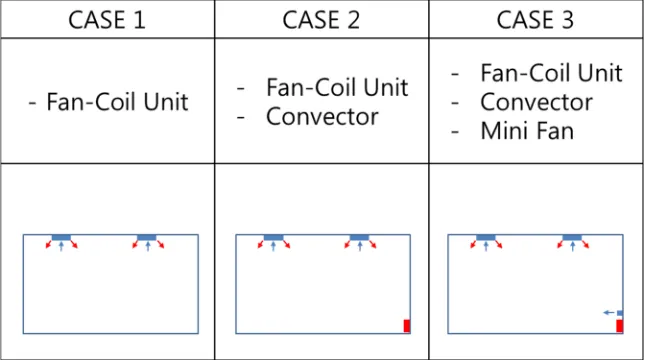
To derive the improvement plan for thermal environment in the winter of the research room in the Global Environment Research Building of the National Institute of Environmental Research, [15]the CFD analysis program was applied to the actual research room size to analyze temperature stratification on 3 modeling cases. 3 cases used in the CFD analysis are as follows: Case 1, which only the ceiling-embedded fan coil units were operated, Case 2, which both ceiling-embedded fan coil units and convectors were operated and Case 3, which both ceiling-embedded fan coil units and convectors were operated and mini fans were operated at the same time to circulate the room air of the research room. Fig. 4 and Fig. 5 illustrate conceptual drawings for 3 cases applied for the CFD analysis to derive the improvement plan for the thermal environment.
Figure 4 CFD Analysis Concept to Derive Improvement Plan for Thermal Environment
For analysis conditions for 3 cases used in the CFD analysis, the analysis modeling work was conducted on the room conditions as shown in Fig. 4 based on the site visit to the Global Environment Research Building, construction documents and construction specifications. The room size was set to 10.2m long, 10m wide and 2.7m high. The ceiling-embedded FCU used in the CFD analysis had 3,000 kcal/h for cooling capacity, 2,900 kcal/h for heating capacity and the 4-way outlet with the supply flow
rate of 12 ㎥/min. Fig. 5 illustrates 3 modeling cases used in the CFD analysis. Table 1 lists the envelope
Figure 5 3 Modeling Cases for CFD Analysis
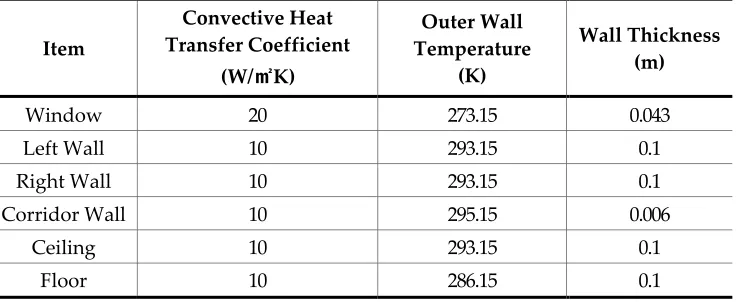
Table 1 Envelope Boundary Conditions of Study Object Research Room
Item
Convective Heat Transfer Coefficient
(W/㎡K)
Outer Wall Temperature
(K)
Wall Thickness (m)
Window 20 273.15 0.043
Left Wall 10 293.15 0.1
Right Wall 10 293.15 0.1
Corridor Wall 10 295.15 0.006
Ceiling 10 293.15 0.1
Floor 10 286.15 0.1
3. Results and Considerations
3.1 Actual Experiment Results on Room Temperature by Season and Height
3.1.1 Summer Temperature Status and Result Analysis
(A)
(B)
(C)
(D)
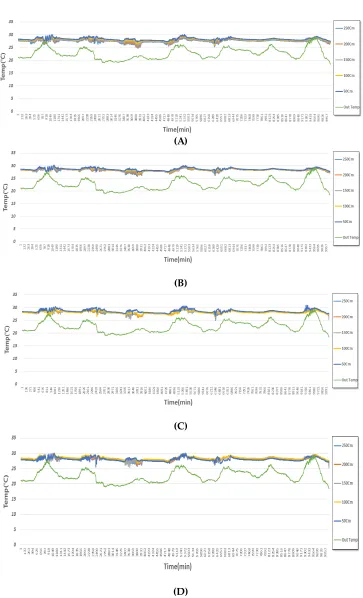
Figure 6 Summer Weekly Temperature Distribution (August 25 - August 31, 2014): (a) Temp. Sensor Location ⓛ; (b) Temp. Sensor Location ②; (c) Temp. Sensor Location ③; (d) Temp. Sensor Location
④.
between 8am until 6pm as the air-conditioner turned on and off. . The set room temperature was 28℃
and the system operated according to the governmental guidelines for energy conservation[16]. The
highest temperature in the upper part during the week appeared at 5:40 PM, August 28 and was 30.2℃
at the 230cm high point of Number ③ location (Fig. 2). At this moment, the temperature at its lowest
point (50cm high) was 29.1℃. It was analyzed that there was an insignificant difference of about 1.1℃
between the highest and the lowest temperatures. Note that all room temperatures kept decreasing
very slowly from midnight to sunrise and kept rising until sunset on holidays, Fridays and Sundays.
3.1.2 Intermediate Season (Fall) Temperature Status and Analysis
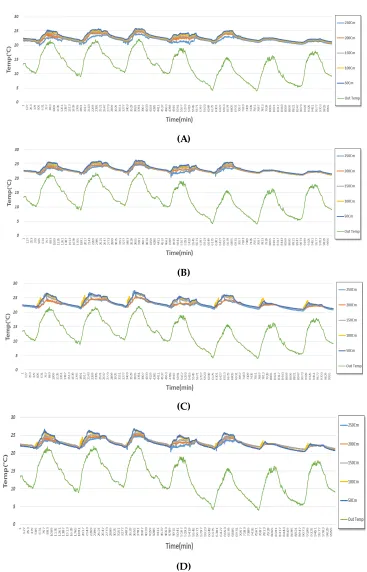
Fig. 7 illustrates the room temperature distribution during the intermediate season between October 20
(Monday) and October 26 (Sunday), 2014. Note that the temperature kept decreasing until the office
opening hour of 8:30 AM and then increased upon attendance of room users. The highest temperature
during the week appeared at 1:16 PM, October 20 and was 25.4℃ at the Number ⓛ location. At this
moment, the lowest temperature was 22.7℃. It appeared that there was a temperature difference of
2.7℃. There were two reasons why the temperature increased even if it was a period without any
cooling and heating. One was the solar radiation effect as like what appeared in the summer analysis
and the other was because the internal load generated by actual room use of occupants, that is, the
human body temperature and the heat generated from lighting and plugss flew in the room. Overall,
the room temperature showed the temperature distribution to be approximately 5℃ or above higher
than that of the summer. It was analyzed that the temperature deviation was generated between the
upper and the lower parts as the temperature dropped. In addition, during holidays of the intermediate
season, October 25 - October 26, 2014, the temperature increase pattern due to solar radiation was
similar to that in the summer and the gradual drop pattern was shown since no internal heating was
(A)
(B)
(C)
(D)
Figure 7 Intermediate Season's Weekly Temperature Distribution (October 20 - October 26, 2014): (a) Temp. Sensor Location ⓛ; (b) Temp. Sensor Location ②; (c) Temp. Sensor Location ③; (d) Temp.
Sensor Location ④.
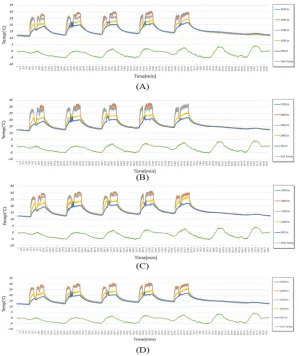
3.1.3 Winter Temperature Status and Analysis
Building of the National Institute of Environmental Research during a week during winter between January 19 - January 25, 2015. Note that the temperature decreased until 8:30 AM while no worker was present in the room and it increased from the time when heating started. The set heating temperature
during the winter used in this study was operated at 20℃ according to the governmental guidelines of
energy conservation. During the measurement period, the highest temperature appeared at 3:21 PM,
January 22, 2015 and was 30.1℃ at the 250cm high point of Number ③ location. At this moment, the
temperature of the lowest layer (50cm) was 20.4 ℃. It appeared that deviation of 9.7℃ temperature had
occurred. In the winter, it occurred that the temperature difference between the upper part and the lower part of the building was greatest during office hours while heating in operation. In particular, it appeared that the temperature deviation was bigger below 1m where occupants sat and worked. It was considered that the indoor thermal environment would be very vulnerable even if the average room temperature reached the set temperature level by the nature of the research room where occupants spent most of their time as sitting.
Figure 8 Winter Weekly Temperature Distribution (January 19 - January 25, 2015): (a) Temp. Sensor Location ⓛ; (b) Temp. Sensor Location ②; (c) Temp. Sensor Location ③; (d) Temp. Sensor Location ④.
3.2 Result of CFD Analysis to Derive an Improvement Plan for Thermal Environment in the Winter
winter and derivation of the improvement plan of the thermal environment, the CFD program was utilized to study the room temperature deviation for 3 cases before the verification experiment. There are various causes for the room temperature deviation between the upper and lower parts of the building due to temperature stratification in the winter, including condensation generated on the outer walls, the roof and the window panes, the Cold Bridge, the thermal loss and the blow rate of the ceiling-embedded indoor unit while heating in the winter. Accordingly, in this study, various conditions as above were applied for the CFD analysis.
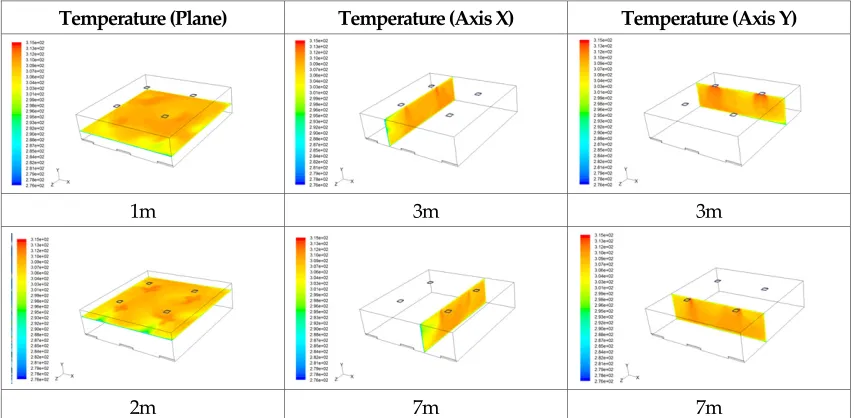
Table 2 illustrates the temperature distribution of the Case 1 analysis result in the research room by axes X, Y and Z. Based on the CFD analysis result, it is possible to note that the temperature near the windows was relatively lower. This is the phenomenon occurs because the overall heat transmission coefficient of the window is relatively low. For the research room used in the CFD analysis, it was possible to identify that a cold draft phenomenon occurred on the window glass. In addition, for the reason why the floor temperature was relatively low, it appeared that heat loss occurred significantly on the floor due to the outer air because the research room was in a piloti structure where the floor outside was exposed to the outer air. In addition, it was possible to note that the temperature gradient of each zone changed depending on the location of the ceiling-embedded indoor unit.
Table 2 Result of CFD Analysis in Case 1
Temperature (Plane) Temperature (Axis X) Temperature (Axis Y)
1m 3m 3m
2m 7m 7m
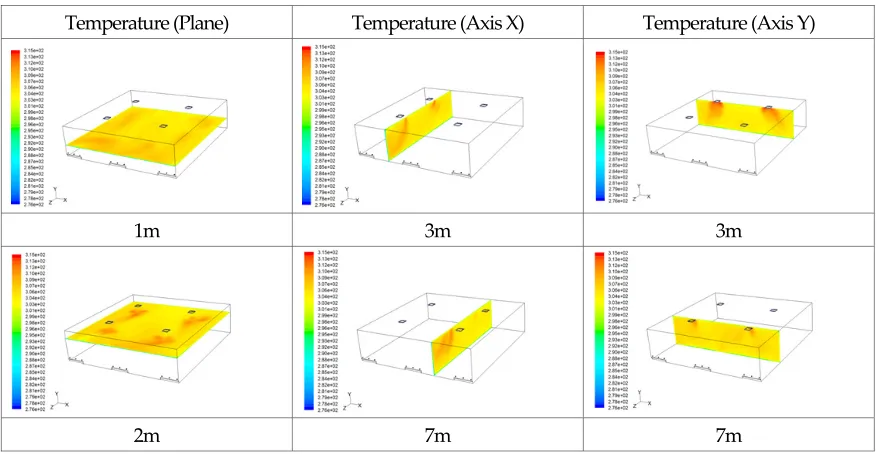
Table 3 Result of CFD Analysis in Case 2
Temperature (Plane) Temperature (Axis X) Temperature (Axis Y)
1m 3m 3m
2m 7m 7m
Table 4 shows the analysis result of Case 3 which additionally installed the circulating fan (mini fan) on the convector to mitigate the cold draft phenomenon generated on the glass and to solve low temperature airflow stagnation in the lower section. Based on the CFD analysis result, it was identified that overall temperature distribution was uniform in Case 3. In particular, it was possible to note that installation of the circulating fan removed flow stagnation from the lower section and the overall room temperature gradient became slow except for the outlet surroundings of the ceiling-embedded indoor unit (FCU).
Table 4 Result of CFD Analysis in Case 3
Temperature (Plane) Temperature (Axis X) Temperature (Axis Y)
1m 3m 3m
2m 7m 7m
convector + fan installed Case 3 improved compared to that of Case 1. For the average temperature, it
was 19.7℃ for Case 1, 24.2℃ for the only convector installed Case 2 and 25.2℃ for the convector+fan
installed Case 3. The average temperature increased as convectors and circulating fans were additionally installed and it was considered that it would be helpful to the indoor thermal environment accordingly.
Figure 9 CFD Simulated Temperature Analysis by height
3.3 Result of Verification Experiment Applied with Thermal Environment Improvement Plan
Figure 10 Installation View of Equipment System with Added Convector + Circulating Fan
Locations of temperature sensors installed for the verification experiment about thermal environment improvement plan due to temperature stratification in the winter were as shown in Fig. 2. The verification experiment was conducted from March 6, 2015 to March 17, 2015, and experiment conditions were set on each day for the verification experiment. Table 2 lists the verification experiment conditions. The experiment was conducted by cases considering the equipment operation and the table layout. In addition, to measure the thermal environment, PMVs were measured by height each day in the AM and PM. The device used for measurement was the AM-101 model PMV tester from KEM (Kyoto Electronics Manufacturing). The clothing (Clo) and the metabolic activity (Met), which are classified as subjective factors, were calculated based on the ISO 7730[23] standard and were measured based on the input clothing of 0.91 and the input metabolic activity of 1.2.
Table 2 Conditions of Verification Experiment for Thermal Environment Improvement
Item Equipment Operation Remark
Case 1 Existing FCU only
Case 2 FCU +convector
Case 3-1 FCU +convector + circulating fan 90 degrees of the circulating fan angle
Case 3-2 FCU +convector + circulating fan 120 degrees of the circulating fan angle
Fig. 11 illustrates the temperature distribution by height in the research room from the result of the verification experiment in Case 1.
Based on the experiment result, for 5 locations between 2-3PM the temperature distribution was 30.45℃
- 27.39℃ at the 250cm height and 27.6℃ - 24.7℃ at 50cm above the floor. The difference between the
the results of previous experiments. As shown in the outdoor temperature distribution graph, it was analyzed that it was due to the low temperature difference between the room and the outside since the outdoor temperature was higher than previous experiments during the additional experiment period. In addition, by the result compared of the temperatures at the outer wall and the glass exposed to the outdoor air, it was possible to note that the temperature distribution on the glass was higher than that of the outer wall due to the effect of solar radiation penetrating through the window during the heating operated time.
Figure 12 Temperature Distribution in Research Room in Case 2 Experiment: (a) Temp. Sensor Location ⓛ; (b) Temp. Sensor Location ②; (c) Temp. Sensor Location ③; (d) Temp. Sensor Location ④
Fig. 12 illustrates the temperature distribution in the research room from the result of the verification experiment in Case 2. For Case 2, which used both FCUs and convectors, for 5 locations between 2-3 PM, the temperature distribution was 28.9℃ - 25.1℃ at the 250cm height and 25.6℃ - 24.6℃ at 50cm
Figure 13 Temperature Distribution in Research Room in Case 3-1 Experiment: (a) Temp. Sensor Location ⓛ; (b) Temp. Sensor Location ②; (c) Temp. Sensor Location ③; (d) Temp. Sensor Location ④
Fig. 13 and Fig. 14 illustrate the temperature distributions in the research room from the result of the verification experiments in Case 3-1 and Case 3-2 respectively. In Case 3, FCUs, convectors and internal circulating fans were used at the same time, and the outlet angle of each internal circulating fan was controlled to analyze the temperature distribution with respect to the fan installation angle. Based on the experiment result of Case 3-1 which kept the fan outlet angle to 90 degrees, the temperature deviation by height was 2.0℃, which meant that the temperature deviation in the inventory research room was reduced. In the graph indicated for (A) in Fig. 13, it appeared that the temperature deviation by height at Location ①, which was farthest from the circulating fan, was 2.0℃ at best. Since Number
① temperature measurement location was located relatively farther from the circulating fan than other temperature measurement locations, its temperature deviation was greater than other locations due to reduced air flow from the circulating fan.
In Case 3-2, which kept the fan outlet angle to 120 degrees, the average temperature difference in the inventory research room was 2.45℃, which appeared to have increased compared to Case 3-1. It was considered that the lower air in the inventory research room was not well circulated as the outlet angle of the circulating fan was raised from 90 degrees to 120 degrees. Therefore, it was considered that it would be possible to improve stratification of the room temperature by deriving the optimal condition for smooth upper and lower air circulation when the circulating fan was used.
Fig. 15 illustrates averages of the maximum and minimum temperature differences between 14:00 and 16:00 by cases. Based on the verification experiment results of 4 cases, it appeared that the temperature difference by internal height was the lowest in Case 3-1, which used all of the FCUs, convectors and circulating fans and the circulating fan angle was set to 90 degrees. .
Figure 15 Temperature Difference by Cases
3.4 Indoor PMV Experiment and Analysis
Where M is the metabolism rate, W, the external work, Pa, the partial water vapor pressure, ta, the air temperature, tcl, the surface temperature of clothing and tr, the radiant temperature. The PMV thermal environment is divided from –3 to +3 and when it is 0, it is the most comfortable thermal environment state. Table 5, as follows, indicates the indoor thermal environment indices suggested by PMV. ASHRAE [19] suggested scales from -0.5 to +0.5 as the optimal condition.
Table 4 Thermal Sensation on PMV Scale
Cold Cool Slightly cool Neutral Slightly warm Warm Hot
-3 -2 -1 0 1 2 3
In this study, PMV values were measured on a total of 4 case verification experiments to analyze thermal comfort. The device used to measure the PMV was AM-101, which provides the PMV according to the surrounding environment level when Clo and Met are entered. To measure the indoor thermal comfort, it was measured in the AM and PM during the period when the experiments for cases were performed. Table 5 lists the experimental results measured for each case. Based on the measurement result, the minimum was –0.76 and the maximum was 1.06. It appeared that the thermal comfort varies significantly by height.
Table 5 PMV measurement Results by Cases
Height
Case 1 Case 2 Case 3-1 Case 3-2
AM PM AM PM AM PM AM PM 50cm -0.76 0.11 -0.5 0.23 -0.21 0.38 -0.18 0.34
100cm 0.02 0.41 0.31 0.43 0.15 0.67 0.18 0.53
150cm 0.18 0.48 0.56 0.81 0.35 0.73 0.65 0.74
200cm 0.24 0.7 0.75 1 0.44 0.83 0.8 1
250cm 0.37 0.78 0.83 1.05 0.47 0.87 0.84 1.06
Figure 16 Average Differences of PMV Measurement Results by Cases
4. Conclusion
In this study, the verification analysis on seasonal stratification was performed on the research room, where ceiling-embedded indoor units (FCUs) are installed in the Global Environment Research Building of the National Institute of Environmental Research, and the plan to solve the winter temperature stratification was presented. The study results are summarized as follows:
◯ Seasonal temperature status of the Global Environment Research Building according to the ceiling-embedded indoor units
Based on the result that the room temperature was measured by seasons, it appeared that the higher and lower temperature difference was not significant for the cooling season and the intermediate season without both cooling and heating. However, in a season when heating is required such as winter, it was analyzed that the lower the outdoor temperature was, the larger the temperature difference was between the upper and lower parts. In particular, it was analyzed that the temperature difference was extremely high below the 1m height where building occupants used to sit mostly when working.
◯ Winter CFD Simulation Analysis and Search for Temperature Stratification Improvement Plan Based on the CFD simulation analysis result, the average room temperature increased as equipment was added from 19.7℃ for the basic model, to 24.2℃ for the model convectors that were installed and
25.2 ℃ for the model convectors and fans that were installed. When convectors and fans were installed, it appeared that the temperature stratification was improved. It was considered that it would also help the indoor thermal environment, and thus the temperature stratification improvement plan was presented.
◯ Verification Experiment Analysis on the Improvement Plan
Finally, it was analyzed that the temperature stratification improvement was the most effective, regardless of furniture layout if operated in a basic heating system operation + convectors + circulating fans with 90 degrees.
As above, the indoor thermal environment improvement plan was presented here based on the energy modeling data and experimental data for the Global Environment Research Building.
References
1. Liu Yang.; Haiyan Yan.; Joseph C. Lam. Thermal comfort and building energy consumption implication s – A review, Applied Energy 115 (2014) 164–173
2. Baisong Ning.; Youming Chen.; Hui Liu.;, Shunbo Zhang. Cooling capacity improvement for a radiant c eiling panel with uniform surface temperature distribution, Building and Environment, 102 (2016) 64-72 3. Lin Su.; Nianping Li.; Xuhan Zhang.; Yeyao Sun.; Jiawei Qian. Heat transfer and cooling characteristics
of concrete ceiling radiant cooling panel, Applied Thermal Engineering 84 (2015) 170-179
4. Rongling Li.; Togo Yoshidomi, Ryozo Ook.; Bjarne W. Olesen. Field evaluation of performance of radia nt heating/cooling ceilingpanel system, Energy and Buildings 86 (2015) 58–65
5. Yongqiang Luo.; Ling Zhang, Zhongbing Liu.; Yingzi Wang.; Fangfang Meng.; Lei Xie. Modeling of the surface temperature field of a thermoelectric radiant ceiling panel system, Applied Energy 162 (2016) 67 5–686
6. Kwang-Chul Noh.; Jae-Soo Jang.; Myung-Do Oh. Thermal comfort and indoor air quality in the lecture room with 4-way cassette air-conditioner and mixing ventilation system, Building and Environment, 42 (2007) 689–698
7. Tomas Mikeska.; Jianhua Fan. Full scale measurements and CFD simulations of diffuse ceiling inletfor ventilation and cooling of densely occupied rooms, Energy and Buildings, 107 (2015) 59–67
8. Yongchao Zhai.; Yufeng Zhang.; Hui Zhang.; Wilmer Pasut.;, Edward Aren.; Qinglin Meng. Human co mfort and perceived air quality in warm and humid environments with ceiling fans, Building and Envi ronment 90 (2015) 178-185
9. Wei-Hwa Chiang.; Chia-Ying Wang.; Jian-Sheng Huang. Evaluation of cooling ceiling and mechanical v entilation systems on thermal comfort using CFD study in an office for subtropical region Building and Environment 48 (2012) 113-127
10. Chen Zhang.; Per Kvols Heiselberg.; Michal Pomianowski.; Tao Yub,Rasmus Lund Jensen. Experimenta l study of diffuse ceiling ventilation coupled with athermally activated building construction in an offic e room, Energy and Buildings 105 (2015) 60–70
11. Fanger PO. Calculation of thermal comfort, Introduction of a basic comfort equation. ASHRAE transact ions, 1967. 73(2): p. 4-1.
12. 34970A/34972A Data Acquisition/Switch Unit Service Guide, Third Edition, May 2012 Agilent 13. LabVIEW User Manual, April 2003, National Instruments
14. Jae Bum Lee.; Jae Wan Park.; Jong Ho Yoon.; Nam Choon Baek,;Dai Kon Kime,; U. Cheul Shinf. An emp irical study of performance characteristics of BIPV (Building Integrated Photovoltaic) system for the rea lization of zero energy building, Energy Volume 66, 1 March 2014, Pages 25–34
15. ANSYS FLUENT 12.0 User’s Guide, ANSYS, 2009
16. Law on Management of Public Authority, May 2014, KOREA
17. Fanger PO. Calculation of thermal comfort, Introduction of a basic comfort equation. ASHRAE transact ions, 1967. 73(2): p. 4-1.
18. ISO Standard 7730. Moderate thermal environments–Determination of the PMV and PPD indices and s pecification of the conditions for thermal comfort, 1994.
19. ASHRAE, ANSI Standard 55-2004, Thermal Environmental Conditions for Human Occupancy, Atlanta: American Society of Heating, Refrigerating, and Air-conditioning Engineers. Inc., USA, 2004.