Acquisition of images and parameter calculations for the
automatic identification of molecules in a thin-film extract
combined with laser
Théodore Guié Toa Bi1, Sié Ouattara1,*, Jérôme Nango Alico1, Alain Clement2
1Laboratory of Signals and Electrical Systems (L2SE), National Polytechnic Institute Houphouët Boigny, BP 1093 Yamoussoukro, Côte d’Ivoire.
2Institute of Technology of Angers (IUT) / University of Angers, France. * Correspondence: [email protected] ; Tel.: +225-57 12 75 95
Abstract: This paper presents the automation of the thin-layer chromatography technique whose separation and identification of molecules present in a mixture are currently done manually and laboriously [1]. We have therefore found an interest in automating this technique. In this part, the method implemented comprises 2 steps. First we proceeded to the segmentation of the spots obtained on the chromatographic plate. We then developed a program to identify families of molecules such as coumarins, terpenes, tannins, flavonoids, polyphenols, etc. by calculating segmentation parameters such as standard deviation, entropy, average pixel intensity from an algorithm on the matlab software. Finally our results have been compared to the results obtained by the traditional identification technique in laboratories. Some similarity between the two results obtained shows the reliability and the robustness of our technique.
Keywords: Automation, chromatography, thin film, identification, segmentation, standard deviation, entropy, average intensity, algorithm, matlab.
1. Introduction
Traditional medicine based on medicinal plants, survives and tends to develop in parallel with modern medicine in developing countries. According to the World Health Organization (WHO) in 2014, nearly 80% of people in developing countries use traditional medicine for primary health care; hence the need for scientific valorization of medicinal plants [2]. A majority of the world's population, especially in developing countries, is treated only with traditional herbal remedies [3]. Each plant can contain several thousand different compounds whose various uses are aimed at overcoming suffering and improving the health of men. [4]
In addition, the identification of families of molecules in the leaves of plants (extracts) are of great interest in laboratories of natural substances. In these laboratories all research is based on plants (stem, leaves, roots, seeds) and mostly works in the context of the revaluation of traditional medicine based on plants. [5]
However, the separation and identification of molecules is done manually, always referring to the data in the literature, which is slow and very laborious. We have therefore found an interest in automating the identification technique based on algorithms run on Matlab software version 2016. [6]
For this work, we used three (03) plants that are: Alchornea cordifolia, Paullinia pinnata (Sapindaceae), Trema guineensis (Ulmaceae).
We have first described the material and methods in which we present the segmentation of the digital color images of the extracts acquired on the plate as well as the device of experimentation acquisition of these images. The second step is a low-level image processing of segmentation parameter calculations such as entropy, standard deviation, and average pixel intensity. Finally, we compare our results with the results obtained by the traditional identification technique.
2. Materials and methods
2.1 Material
2.1.1. Chemical reagents and equipment
All the chemicals used are of analytical quality. The solvents and reagents employed were purchased commercially from Polychimie (Ivory Coast). For thin-layer chromatography, we used silica gel 60 F254 chromatoplates on an aluminum support. The different devices used for our analyzes are as follows:
• A RETSCH brand electric grinder, type SM 100 • A brand balance Sartorius (Germany)
• Burchi RII Rotary Evaporator • A magnetic stirrer
• A UV-Visible spectrophotometer • A camera
Spatial resolution: 2448x3264 (8 M pixels)
Tonal resolution: 24 bits (color)
Color space: RGB
Camera model: Infinix
Focal length: F / 2
Exposure time: 1/13 seconds
ISO sensitivity: ISO-864
Focal distance: 4 mm
Picture format: JPG image • Glassware (round bottom flask, beakers, etc.) • UV lamp (366 nm, 254 nm)
2.1.2. Plant material
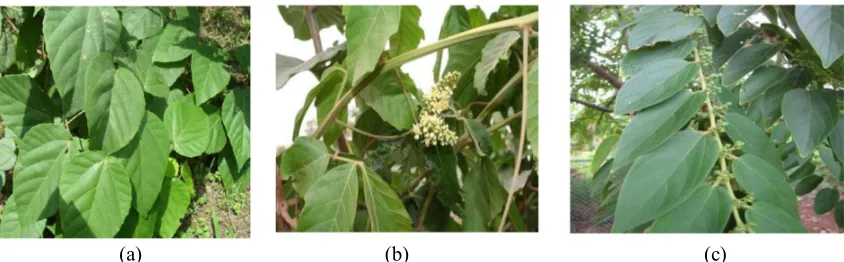
Plant organs consisting mainly of leaves were all harvested from the forest relic of Nangui Abrogoua University in Côte d'Ivoire (see Figure 1). The plant species have been identified according to the herbaria available at the National Center for Floristics (CNF).
(a) (b) (c)
Figure 1. (a): Leaves of Alchornea cordifolia, (b): Leaves of paullinia pinnata, (c): Leaves of Trema guineensis2.2 Methods
2.2.1. Selective extraction of some secondary metabolites
The hydromethanolic extracts of the various leaves were treated respectively with 3 × 20 ml of hexane, chloroform, ethyl acetate and n-butanol (see figure 2). The various organic fractions were concentrated under reduced pressure on a rotary evaporator and then stored in a refrigerator. Thus, for each crude extract, we obtain selective extracts distributed as follows: hexanic, chloroformic, ethyl acetate which were used for phytochemical screening.
Figure 2.(a) Fractionation process of the hydromethanic extract and (b) Hexanic fraction, chloroform, ethyl acetate
2.2.2. Photochemical screening and image acquisition device
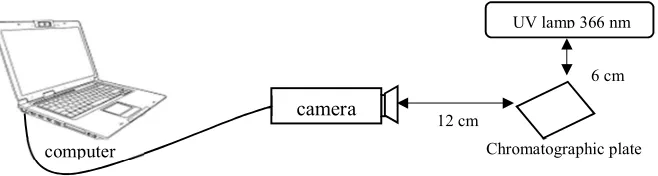
The photochemical screening was carried out according to the analytical procedures described in the work of [7], [8] and [9]. Drops of each selective extract are deposited using a capillary on the points (01 cm from each other) of the baseline drawn 1 cm from the bottom of the chromatoplates (silica gel 60 F254). The deposits are allowed to dry for a moment before introducing the plates into the chromatograph vessel containing the migration solvent. After migration and drying with a hair dryer, the chrotograms are revealed with reagents specific to the phytochemistry groups sought, then visualized first in the visible and then under a UV lamp at 366 nm (see Figure 3). The different developer systems used are:
• Hexane / AcOEt (20: 4, v / v) for hexanic fractions.
• CHCl3 / AcOEt / hexane (10: 10: 5, v / v / v) for the chloroform fractions.
• AcOEt / CH3OH / H2O / CHCl3 (18: 2,4: 2,1: 6, v / v / v / v) for the ethyl acetate fractions.
3. Results and discussions
3.1. Acquisition of images on the chromatographic plate
For each extract, we obtained images on the chromatographic plates. Figure 4 shows some of the images obtained.
Figure 4a.UV chromatogram at 366 nm chloroformic extracts
Figure 4b. UV chromatogram at 366 nm of hexane extracts
Figure 4c. UV chromatogram at 366 nm of hexane extracts
after treatment with Libermann-Büchard Figure 4 Ethyl acetate extracts after treatment with KOH d. UV chromatogram at 366 nm
camera
UV lamp 366 nm
6 cm
12 cm
Chromatographic plate
computer
Figure 4e. Chromatogram in the visible ethyl acetate extracts after treatment with KOH
Figure 4f. 366 nm UV chromatogram of the ethyl acetate extracts after treatment with Libermann-Büchard
3.2.Parameter calculations
We segmented each spot of the images in Figure 4 above, then calculated mean intensity, standard deviation, and entropy using the algorithms coded in the Matlab 2016 version running under Microsoft Windows 10 Pro on a PC based on Intel i3. Figures 5; 6 and 7 illustrate the segmentation of the different spots of the images used. We finally built a database with the values of the parameters of each task. The spots corresponding to families of molecules previously identified by the traditional technique of thin layer chromatography using developers.
Average pixel intensity
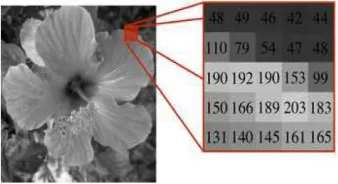
Each spot on the plate is a grayscale digital image and an array of values. Each box in this table, which stores a value, is called a pixel. Noting n the number of lines and p the number of columns of the image, we manipulate an array of n × p pixels. Figure 5, left, shows a visualization of a square array with n = p = 240, which represents 240 × 240 = 57600 pixels. For an image, we can calculate the average intensity of pixels characterizing this image [10].
Figure 5. Under image (spot) size 5x5
The algorithm (a) below calculates the average pixel intensity of the spots. (See Figure 6)
b=imshow(im1); im2=rgb2gray(im1);
h=imfreehand; (a) bw=createMask(h,b);
figure,imshow(bw)
Figure 6. (a) Segmentation of spots under UV 366 nm corresponding to families of molecules
Figure 6. (b) Segmented spots of molecule families
Standard deviation (Std):
The Std is defined by the equation (1) below.
1 2 2
1
1
(
)
(
) )
1
n
i i
Std
x
x
n
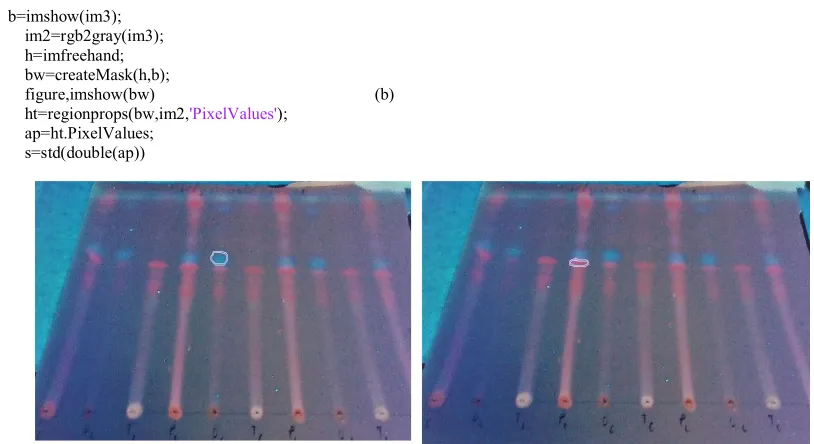
(2)The algorithm (b) below allows to calculate the standard deviation of the spots. (See Figure 7)
b=imshow(im3); im2=rgb2gray(im3); h=imfreehand; bw=createMask(h,b);
figure,imshow(bw) (b) ht=regionprops(bw,im2,'PixelValues');
ap=ht.PixelValues; s=std(double(ap))
Figure.7 (b) Segmented spots of molecule families
Entropy (H) :
The entropy H for a data source X can be calculated as in (2).
1
( )
ni ilog
iH X
P
P
(2)The algorithm (c) below calculates the average pixel intensity of the spots. (see Figure 8) below
b=imshow(im4); im2=rgb2gray(im4); h=imfreehand; bw=createMask(h,b);
figure,imshow(bw) (c) ht=regionprops(bw,im2,'PixelValues');
ap=ht.PixelValues; E=entropy(ap)
Figure 8. (a) Segmentation of spots under UV 366 nm corresponding to families of molecules
Figure 8. (b) Segmented spots of molecule families
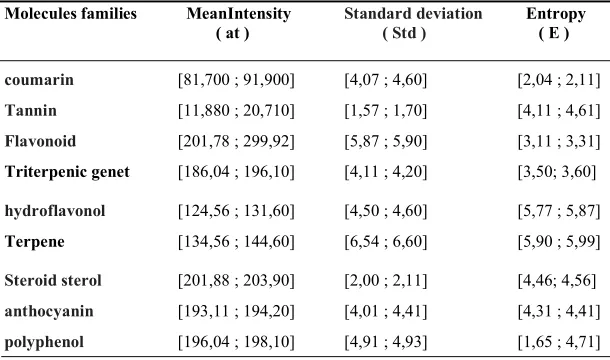
3.3. Parameter values
Table 1: Parameter values of the families of molecules of the hexane fraction
Molecules families MeanIntensity
( at ) Standard deviation ( Std ) Entropy (E)
coumarin [81,700 ; 91,900] [4,07 ; 4,60] [2,04 ; 2,11] Tannin [11,880 ; 20,710] [1,57 ; 1,70] [4,11 ; 4,61] Flavonoid [201,78 ; 299,92] [5,87 ; 5,90] [3,11 ; 3,31] Triterpenic genet [186,04 ; 196,10] [4,11 ; 4,20] [3,50; 3,60]
hydroflavonol [124,56 ; 131,60] [4,50 ; 4,60] [5,77 ; 5,87] Terpene [134,56 ; 144,60] [6,54 ; 6,60] [5,90 ; 5,99]
Steroid sterol [201,88 ; 203,90] [2,00 ; 2,11] [4,46; 4,56] anthocyanin [193,11 ; 194,20] [4,01 ; 4,41] [4,31 ; 4,41] polyphenol [196,04 ; 198,10] [4,91 ; 4,93] [1,65 ; 4,71]
Table 2: Parameter values of the families of molecules of the chloroform fraction
Molecules families MeanIntensity ( at )
Standard deviation ( Std )
Entropy ( E )
coumarin [81,700 ; 91,900] [4,07 ; 4,60] [2,04 ; 2,11] Tannin [11,880 ; 20,710] [1,57 ; 1,70] [4,11 ; 4,61] Flavonoid [201,78 ; 299,92] [5,87 ; 5,90] [3,11 ; 3,31] Triterpenic genet [186,04 ; 196,10] [4,11 ; 4,20] [3,50; 3,60]
hydroflavonol [124,56 ; 131,60] [4,50 ; 4,60] [5,77 ; 5,87] Terpene [134,56 ; 144,60] [6,54 ; 6,60] [5,90 ; 5,99]
Steroid sterol [201,88 ; 203,90] [2,00 ; 2,11] [4,46; 4,56] anthocyanin [193,11 ; 194,20] [4,01 ; 4,41] [4,31 ; 4,41] polyphenol [196,04 ; 198,10] [4,91 ; 4,93] [1,65 ; 4,71]
Table 3: Parameter values of the families of molecules of the acetate ethyl fraction
Molecules families MeanIntensity
( at ) Standard deviation ( Std )
Entropy (E )
coumarin [81,700 ; 91,900] [4,07 ; 4,60] [2,04 ; 2,11] Tannin [11,880 ; 20,710] [1,57 ; 1,70] [4,11 ; 4,61] Flavonoid [201,78 ; 299,92] [5,87 ; 5,90] [3,11 ; 3,31] Triterpenic genet [186,04 ; 196,10] [4,11 ; 4,20] [3,50; 3,60]
hydroflavonol [124,56 ; 131,60] [4,50 ; 4,60] [5,77 ; 5,87] Terpene [134,56 ; 144,60] [6,54 ; 6,60] [5,90 ; 5,99]
For the different fractions, the parameters have the same values, this allows us to develop the identification program in Figure 9 below.
Figure 9. Program of identification of the molecule
We tested the presence of coumarins, tannins and terpenes in the hexane fraction of leaves of Blighia unijugata Bak (Sapindaceae).
The protocol of the thin layer chromatography being the same, we made the segmentation of the different spots on the chromatographic plate. We then calculated the different parameters of the image processing namely entropy, front ratio (Rf), standard deviation (std) and average pixel intensity (MeanIntensity). We obtained the results recorded in Table 4. These values correspond to molecules in the database.
Table 4: parameter values of the hexane fraction of blighia unijugata leaves
MeanIntensity
( at ) Standard deviation ( Std )
Entropy ( E )
89,01 4,11 2,08
11,90 1,61 4,51
135,04 6,58 5,96
Since the values of the various parameters are defined, we have compared these results with the values in the database. From Table 4 we can confirm the presence of coumarins, tannins, terpenes in the leaves of Blighia unijugata Bak (Sapindaceae) because the values obtained correspond to the values in the database. These molecules have already been identified by the traditional method with the same plants [11].
These results thus show the reliability of this identification technique and its simplicity in its implementation.
4. Conclusion
We exposed a new thin-film family identification technique based on image segmentation and calculation of segmentation parameters such as entropy, standard deviation, and average pixel intensity. Our method shows quite satisfactory results and have been confronted with the results of the technique traditionally made from the developers and the UV lamp 366 nm and 254 nm. The results of this confrontation showed a similarity between the families of molecules obtained. This shows the reliability and robustness of our technique.
Migration and separation of the mixture as spots on the plate
Segmentation of each spot
Calculation of the mean intensity, the entropy and standard deviation of each
spot
Comparison of the results obtained with those contained in the database
In our next work, it will be a question of designing an electronic device coupled to a computer allowing to calculate automatically the entropy, the average intensity and the standard deviation of each spot in order to identify the family of molecule.
References
1. Muthu C., Aymar M., Raja N., and Ignacimuthu S. Medicinal plants used by Traditional healers in Kancheepuran District of Tamil Nadu, India. Journal of enthnobiological and ethnomedicine. 2006, 2 (43): 1186 / 1746-4269-2-43. 2. Kabran, Chemical and cytotoxic study of ten Ivory Coast plants, used in the traditional treatment of breast cancer;
2014
3. Adjanohoun E. & Aké-Assi L. Contribution to the inventory of medicinal plants of Ivory Coast. Ministry of scientific research. National Floristic Center, Abidjan, Ivory Coast. 2008, 359 p
4. Bi F.H., Irié G.M., N'gaman K.C.C., Mohou C.H.B. Studies of some plants
Therapeutics used in the treatment of high blood pressure and diabetes: two emerging pathologies in Côte d'Ivoire.
2008, Science & Nature, 39-48 pp.
5. Adjanohoun E. & Aké-Assi L. Contribution to the inventory of medicinal plants of Ivory Coast. Ministry of scientific research. National Floristic Center, Abidjan, Ivory Coast. 2008, 359 p.
6. Arbonier M. Trees, shrubs and lianas in the dry areas of West Africa. 2nd Edits CIRAD. 2002.
7. Obeng E.A. Blighia unijugata Baker. [Internet] Record from Protabase. Lemmens. 2010.
8. Zimudzi C. & Cardon D., (2005). Morinda lucida Benth. [Internet] Record from PROTA4U. Jansen, P.C.M. & Cardon, D. (Editors). PROTA (Plant Resources of Tropical Africa), Wageningen, Netherlands. <Http://www.prota4u.org/search.asp>. Accessed June 13, 2013
9. Kabran, Chemical and cytotoxic study of ten plants from Côte d'Ivoire, used in the traditional treatment of breast cancer, 2014
10. Gabriel P. Digital processing of images. '' Images of mathematics '' .2011